
|
|||||
|
 | |
| |
| |
| |
| |
| |
|
Gene: NFXL1 |
Gene summary for NFXL1 |
| Gene information | Species | Human | Gene symbol | NFXL1 | Gene ID | 152518 |
| Gene name | nuclear transcription factor, X-box binding like 1 | |
| Gene Alias | CDZFP | |
| Cytomap | 4p12 | |
| Gene Type | protein-coding | GO ID | GO:0006139 | UniProtAcc | B1Q2B0 |
Top |
Malignant transformation analysis |
| Identification of the aberrant gene expression in precancerous and cancerous lesions by comparing the gene expression of stem-like cells in diseased tissues with normal stem cells |
| Entrez ID | Symbol | Replicates | Species | Organ | Tissue | Adj P-value | Log2FC | Malignancy |
| 152518 | NFXL1 | male-WTA | Human | Thyroid | PTC | 9.01e-06 | 5.77e-02 | 0.1037 |
| 152518 | NFXL1 | PTC05 | Human | Thyroid | PTC | 4.53e-07 | 2.36e-01 | 0.2065 |
| 152518 | NFXL1 | PTC06 | Human | Thyroid | PTC | 6.08e-14 | 3.69e-01 | 0.2057 |
| 152518 | NFXL1 | PTC07 | Human | Thyroid | PTC | 5.69e-08 | 2.10e-01 | 0.2044 |
| 152518 | NFXL1 | ATC12 | Human | Thyroid | ATC | 9.68e-05 | 1.32e-01 | 0.34 |
| 152518 | NFXL1 | ATC13 | Human | Thyroid | ATC | 9.87e-37 | 6.73e-01 | 0.34 |
| 152518 | NFXL1 | ATC2 | Human | Thyroid | ATC | 9.96e-03 | 2.77e-01 | 0.34 |
| 152518 | NFXL1 | ATC4 | Human | Thyroid | ATC | 2.89e-10 | 1.72e-01 | 0.34 |
| 152518 | NFXL1 | ATC5 | Human | Thyroid | ATC | 4.68e-46 | 7.18e-01 | 0.34 |
| Page: 1 |
| Tissue | Expression Dynamics | Abbreviation |
| Thyroid | 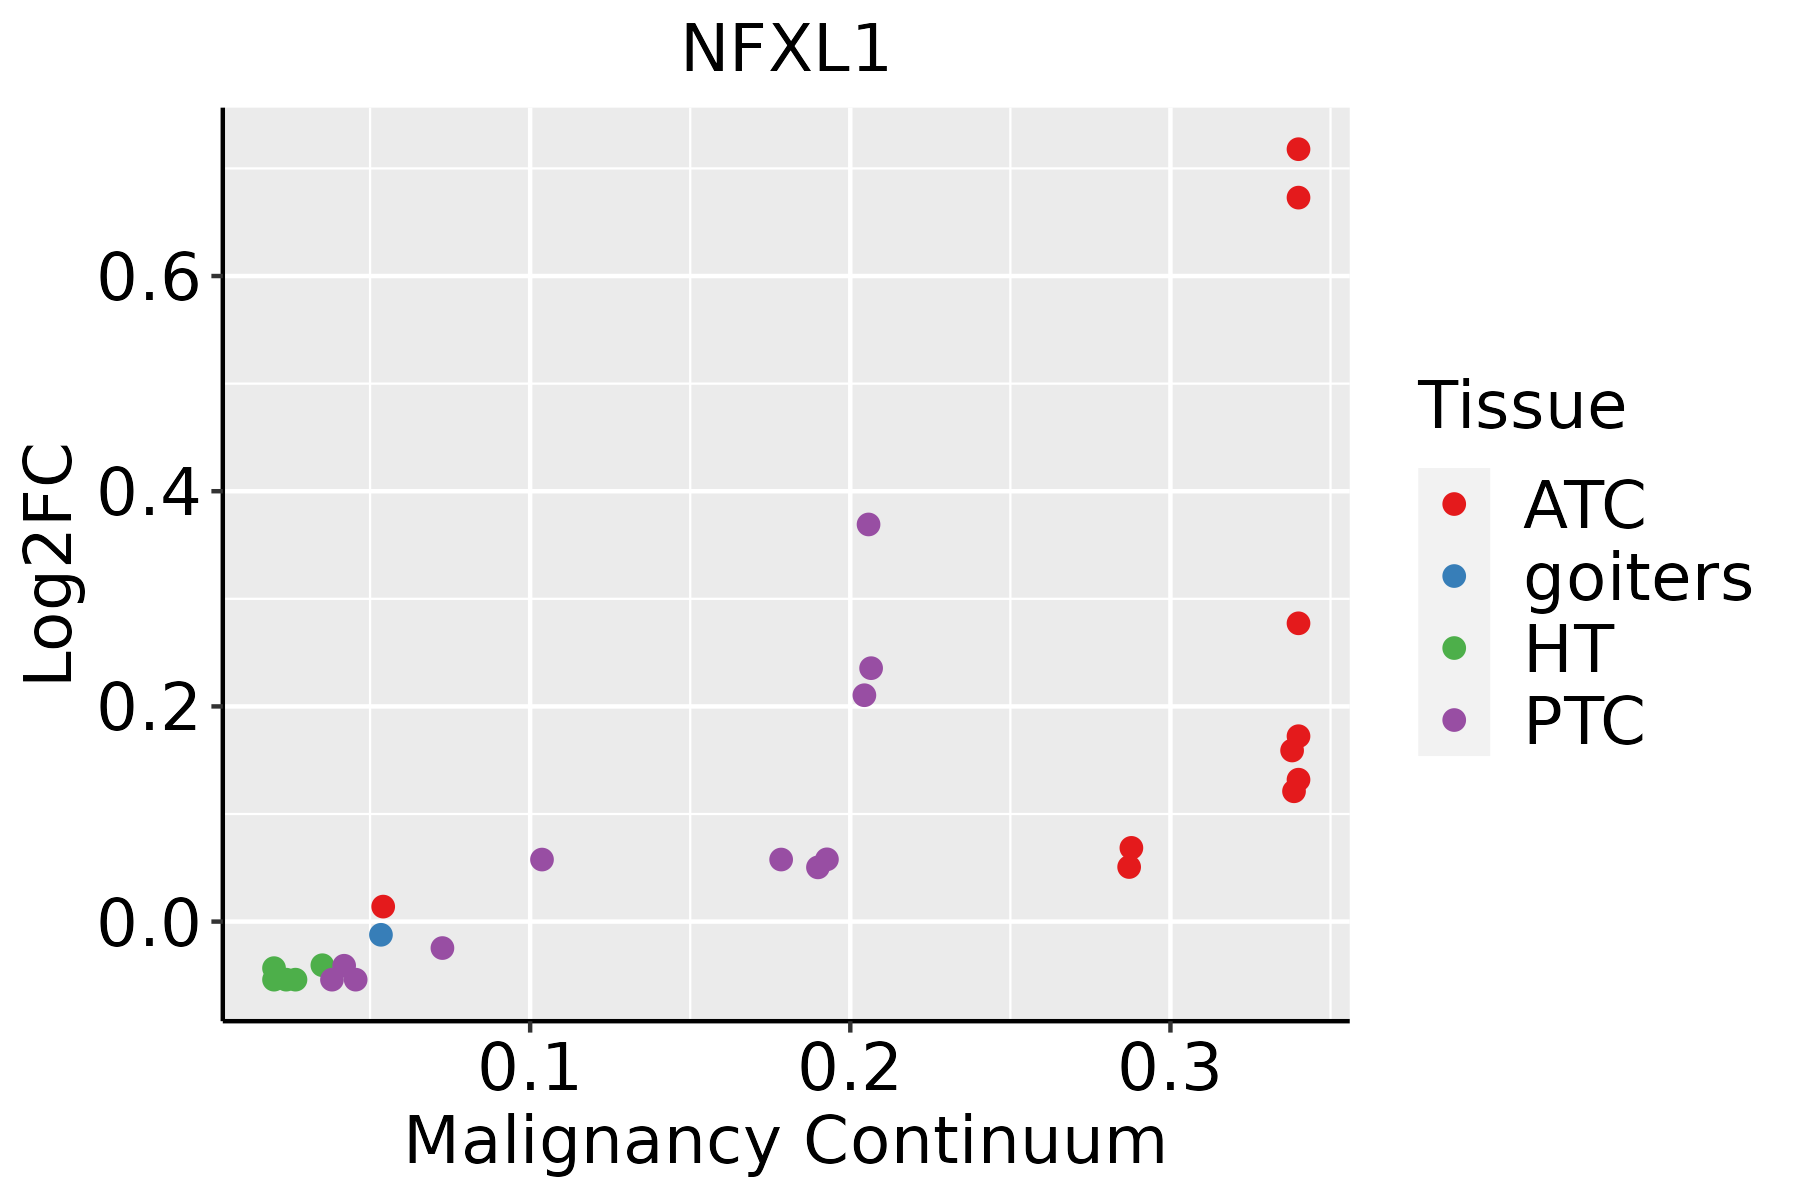 | ATC: Anaplastic thyroid cancer |
| HT: Hashimoto's thyroiditis | ||
| PTC: Papillary thyroid cancer |
| ∗log2FC in expression of this searched gene in stem-like cells from each diseased tissue sample relative to stem-like cells in normal samples in each tissue plotted against the malignancy continuum. Samples are colored based on if they are from different disease stage. |
Top |
Malignant transformation related pathway analysis |
| Find out the enriched GO biological processes and KEGG pathways involved in transition from healthy to precancer to cancer |
| Tissue | Disease Stage | Enriched GO biological Processes |
| Colorectum | AD |  |
| Colorectum | SER |  |
| Colorectum | MSS |  |
| Colorectum | MSI-H |  |
| Colorectum | FAP |  |
| ∗Top 15 enriched GO BP terms are showed in the bar plot of each disease state in each tissue. Each row represents a significant GO biological process which is colored according to the -log10(p.adjust). |
| Page: 1 2 3 4 5 6 7 8 9 |
| GO ID | Tissue | Disease Stage | Description | Gene Ratio | Bg Ratio | pvalue | p.adjust | Count |
| Page: 1 |
| Pathway ID | Tissue | Disease Stage | Description | Gene Ratio | Bg Ratio | pvalue | p.adjust | qvalue | Count |
| Page: 1 |
Top |
Cell-cell communication analysis |
| Identification of potential cell-cell interactions between two cell types and their ligand-receptor pairs for different disease states |
| Ligand | Receptor | LRpair | Pathway | Tissue | Disease Stage |
| Page: 1 |
Top |
Single-cell gene regulatory network inference analysis |
| Find out the significant the regulons (TFs) and the target genes of each regulon across cell types for different disease states |
| TF | Cell Type | Tissue | Disease Stage | Target Gene | RSS | Regulon Activity |
| ∗The dot plots of a searched regulon are shown for all cell subpopulations in each disease state of each tissue based on the regulon specific score inferred using pySCENIC and by calculating the average expression. |
| Page: 1 |
Top |
Somatic mutation of malignant transformation related genes |
| Annotation of somatic variants for genes involved in malignant transformation |
| Hugo Symbol | Variant Class | Variant Classification | dbSNP RS | HGVSc | HGVSp | HGVSp Short | SWISSPROT | BIOTYPE | SIFT | PolyPhen | Tumor Sample Barcode | Tissue | Histology | Sex | Age | Stage | Therapy Types | Drugs | Outcome |
| NFXL1 | SNV | Missense_Mutation | novel | c.2636N>G | p.Val879Gly | p.V879G | Q6ZNB6 | protein_coding | tolerated(0.37) | benign(0) | TCGA-A8-A095-01 | Breast | breast invasive carcinoma | Female | <65 | I/II | Chemotherapy | 5-fluorouracil | CR |
| NFXL1 | SNV | Missense_Mutation | rs770685540 | c.1295G>A | p.Arg432His | p.R432H | Q6ZNB6 | protein_coding | deleterious(0) | probably_damaging(0.991) | TCGA-AN-A046-01 | Breast | breast invasive carcinoma | Female | >=65 | I/II | Unknown | Unknown | SD |
| NFXL1 | SNV | Missense_Mutation | c.2157N>T | p.Leu719Phe | p.L719F | Q6ZNB6 | protein_coding | deleterious(0.05) | benign(0.219) | TCGA-AR-A24Z-01 | Breast | breast invasive carcinoma | Female | <65 | I/II | Chemotherapy | doxorubicin | SD | |
| NFXL1 | deletion | Frame_Shift_Del | novel | c.1640delN | p.Pro547HisfsTer56 | p.P547Hfs*56 | Q6ZNB6 | protein_coding | TCGA-D8-A27V-01 | Breast | breast invasive carcinoma | Female | <65 | I/II | Hormone Therapy | tamoxiphen | SD | ||
| NFXL1 | SNV | Missense_Mutation | c.2613N>A | p.Asn871Lys | p.N871K | Q6ZNB6 | protein_coding | tolerated(1) | benign(0) | TCGA-IR-A3LB-01 | Cervix | cervical & endocervical cancer | Female | <65 | I/II | Chemotherapy | cisplatin | PD | |
| NFXL1 | SNV | Missense_Mutation | novel | c.1634N>A | p.Thr545Lys | p.T545K | Q6ZNB6 | protein_coding | deleterious(0) | possibly_damaging(0.649) | TCGA-VS-A94Z-01 | Cervix | cervical & endocervical cancer | Female | <65 | I/II | Chemotherapy | cisplatin | CR |
| NFXL1 | SNV | Missense_Mutation | c.2269A>C | p.Asn757His | p.N757H | Q6ZNB6 | protein_coding | tolerated(0.12) | benign(0) | TCGA-AA-3510-01 | Colorectum | colon adenocarcinoma | Male | >=65 | I/II | Unknown | Unknown | SD | |
| NFXL1 | SNV | Missense_Mutation | novel | c.380N>T | p.Thr127Met | p.T127M | Q6ZNB6 | protein_coding | deleterious(0.01) | possibly_damaging(0.568) | TCGA-AA-3845-01 | Colorectum | colon adenocarcinoma | Female | >=65 | I/II | Unknown | Unknown | PD |
| NFXL1 | SNV | Missense_Mutation | c.2411N>T | p.Arg804Ile | p.R804I | Q6ZNB6 | protein_coding | deleterious(0) | probably_damaging(0.986) | TCGA-AA-3977-01 | Colorectum | colon adenocarcinoma | Male | >=65 | I/II | Unknown | Unknown | SD | |
| NFXL1 | SNV | Missense_Mutation | rs372423597 | c.1169N>A | p.Arg390Gln | p.R390Q | Q6ZNB6 | protein_coding | deleterious(0.03) | probably_damaging(0.943) | TCGA-AA-3984-01 | Colorectum | colon adenocarcinoma | Female | <65 | I/II | Unknown | Unknown | SD |
| Page: 1 2 3 4 5 6 7 8 9 |
Top |
Related drugs of malignant transformation related genes |
| Identification of chemicals and drugs interact with genes involved in malignant transfromation |
| (DGIdb 4.0) |
| Entrez ID | Symbol | Category | Interaction Types | Drug Claim Name | Drug Name | PMIDs |
| Page: 1 |

Copyright 2023-Present -The University of Texas Health Science Center at Houston |