| Tissue | Expression Dynamics | Abbreviation |
| Cervix | 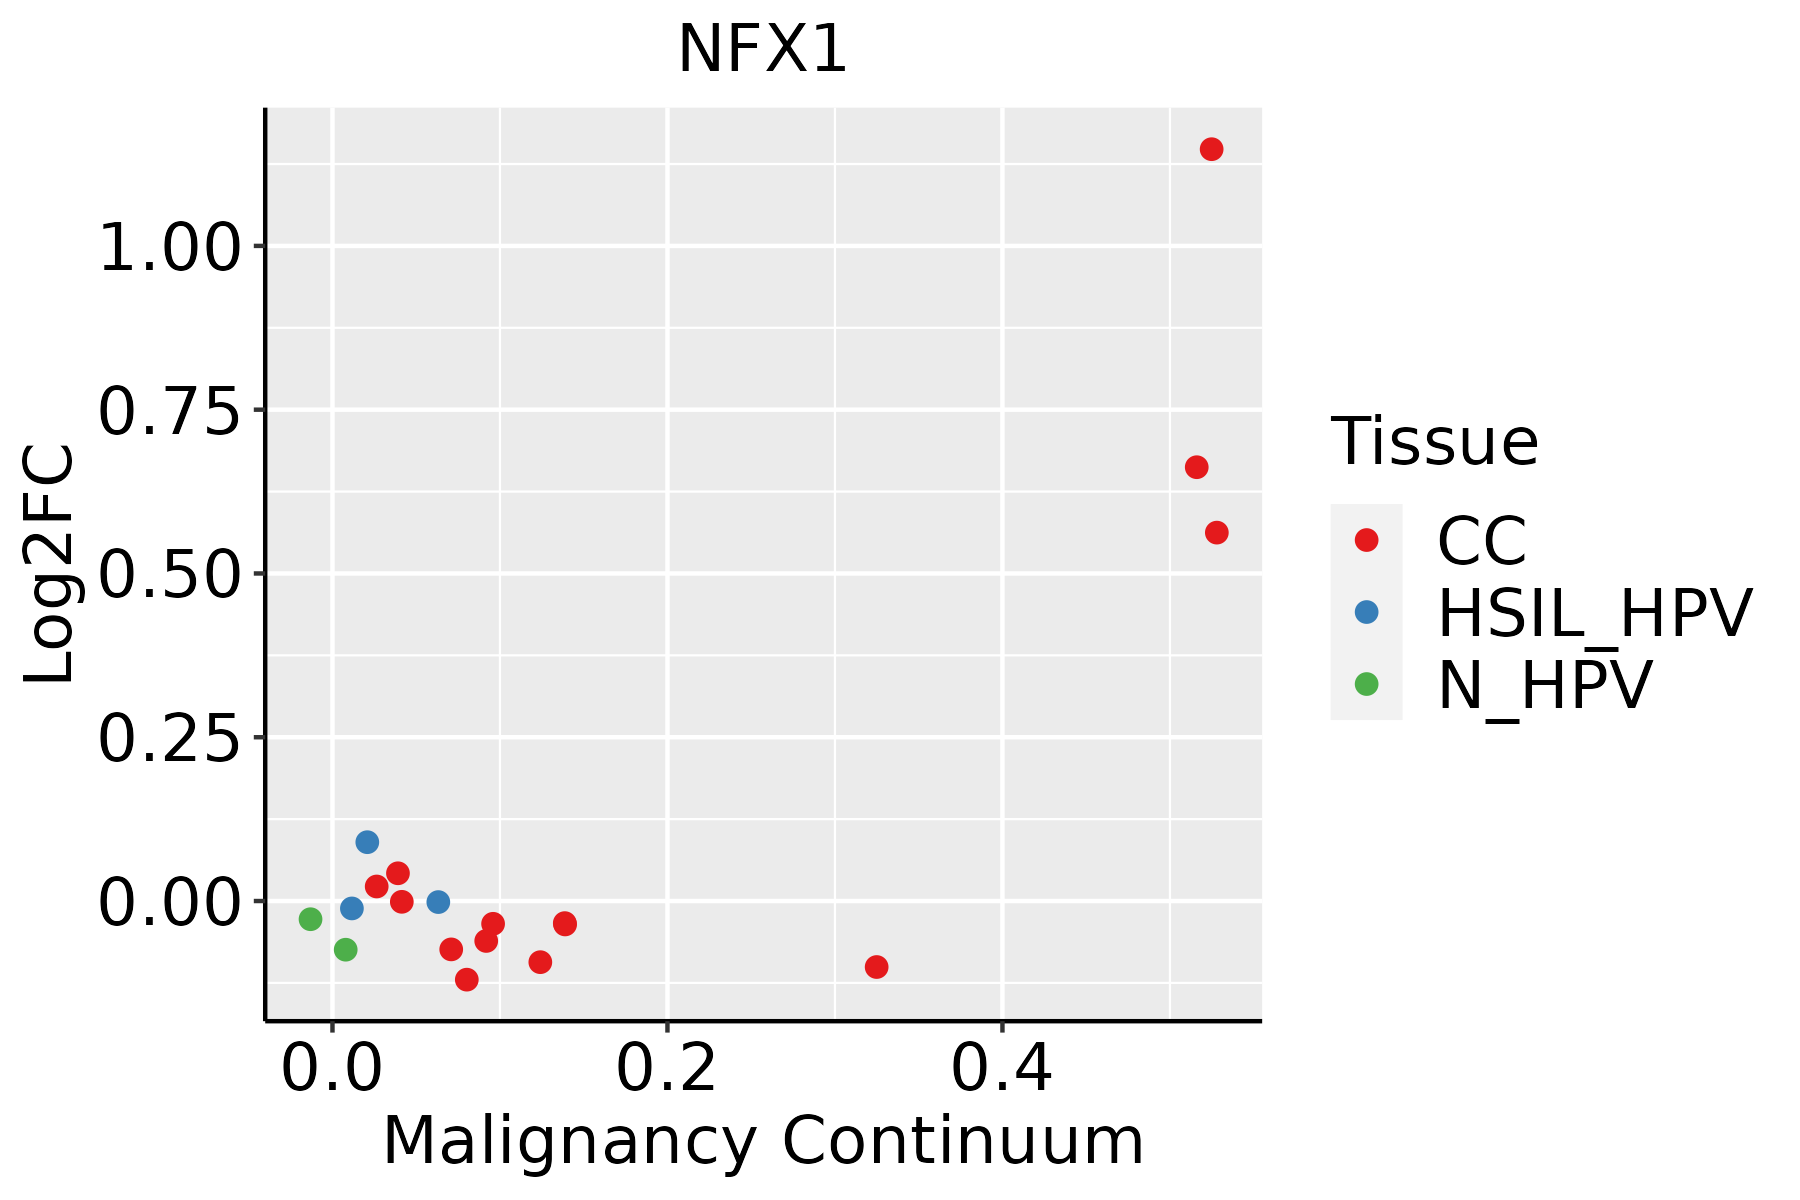 | CC: Cervix cancer |
| HSIL_HPV: HPV-infected high-grade squamous intraepithelial lesions |
| N_HPV: HPV-infected normal cervix |
| Colorectum (GSE201348) |  | FAP: Familial adenomatous polyposis |
| CRC: Colorectal cancer |
| Colorectum (HTA11) |  | AD: Adenomas |
| SER: Sessile serrated lesions |
| MSI-H: Microsatellite-high colorectal cancer |
| MSS: Microsatellite stable colorectal cancer |
| Esophagus | 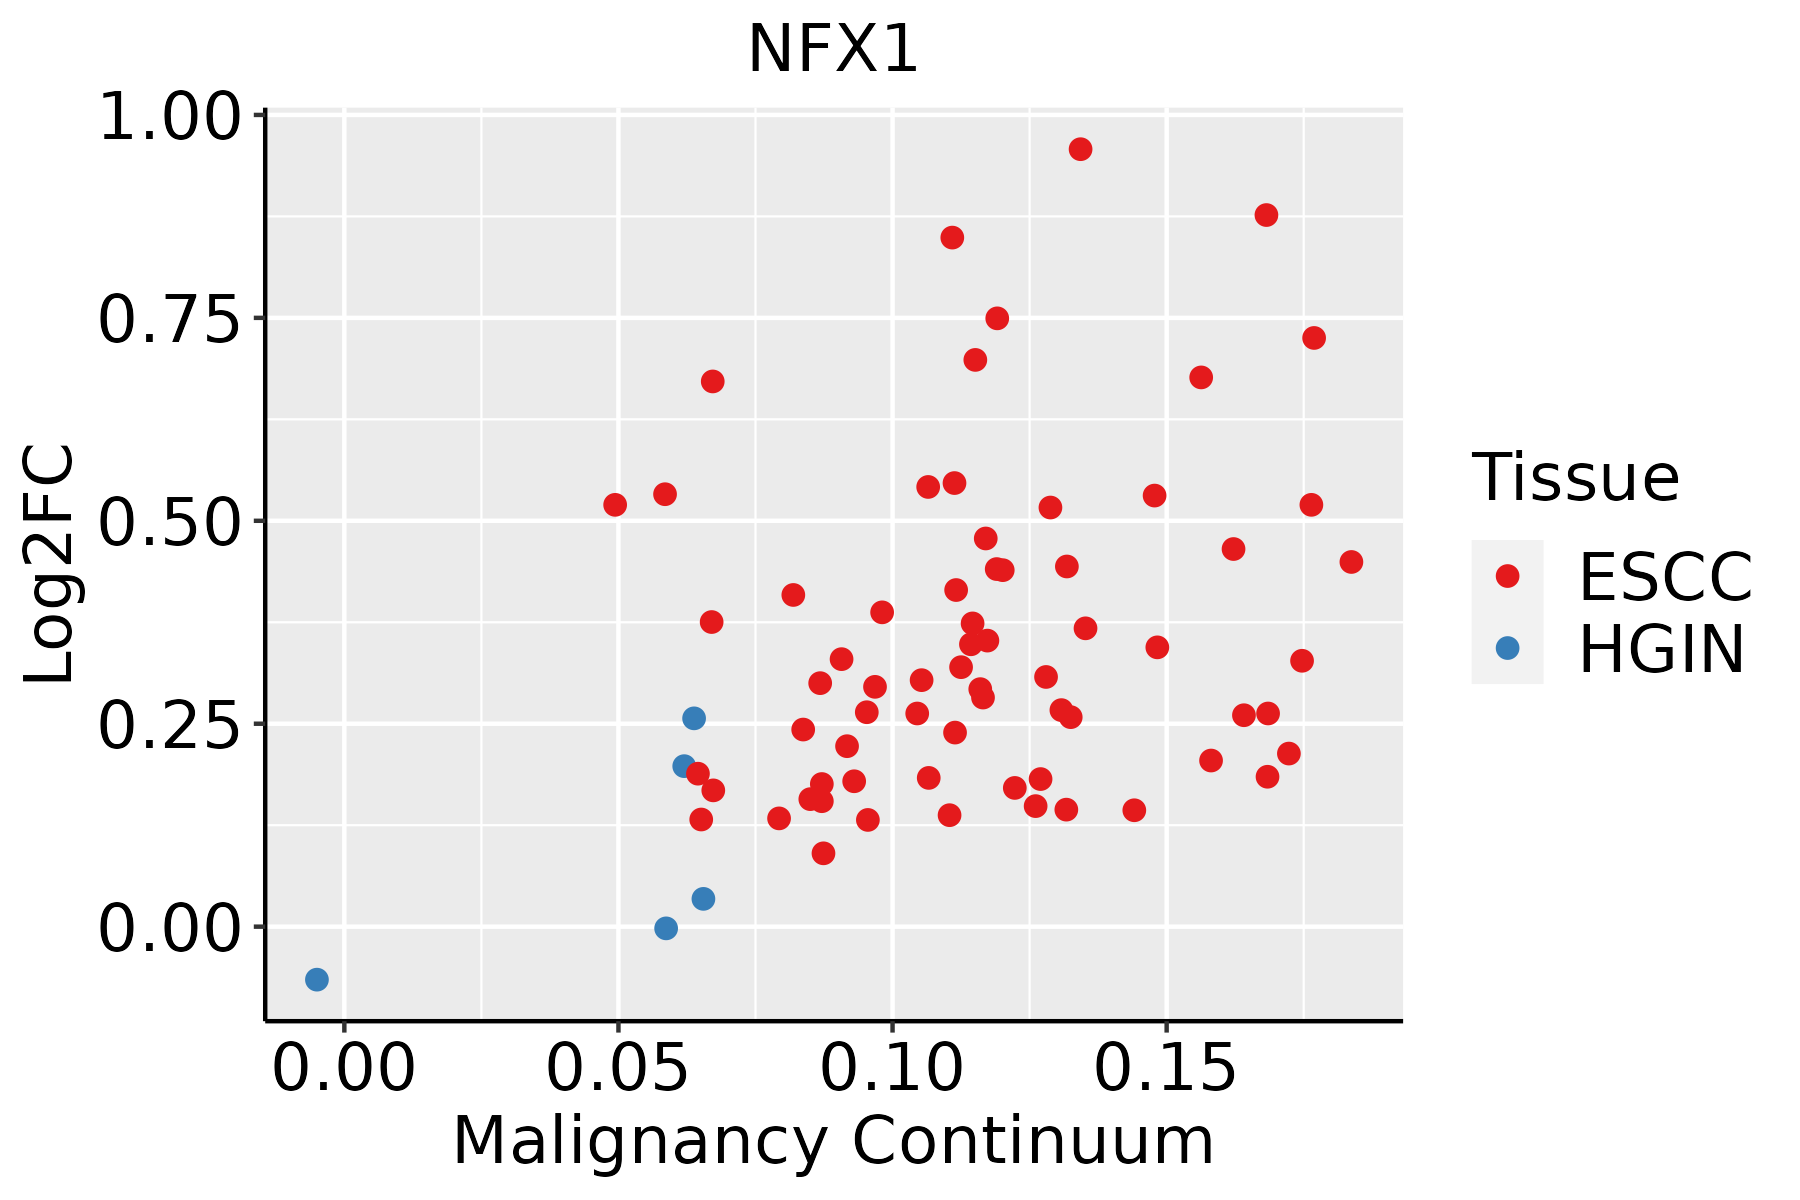 | ESCC: Esophageal squamous cell carcinoma |
| HGIN: High-grade intraepithelial neoplasias |
| LGIN: Low-grade intraepithelial neoplasias |
| Liver |  | HCC: Hepatocellular carcinoma |
| NAFLD: Non-alcoholic fatty liver disease |
| Oral Cavity | 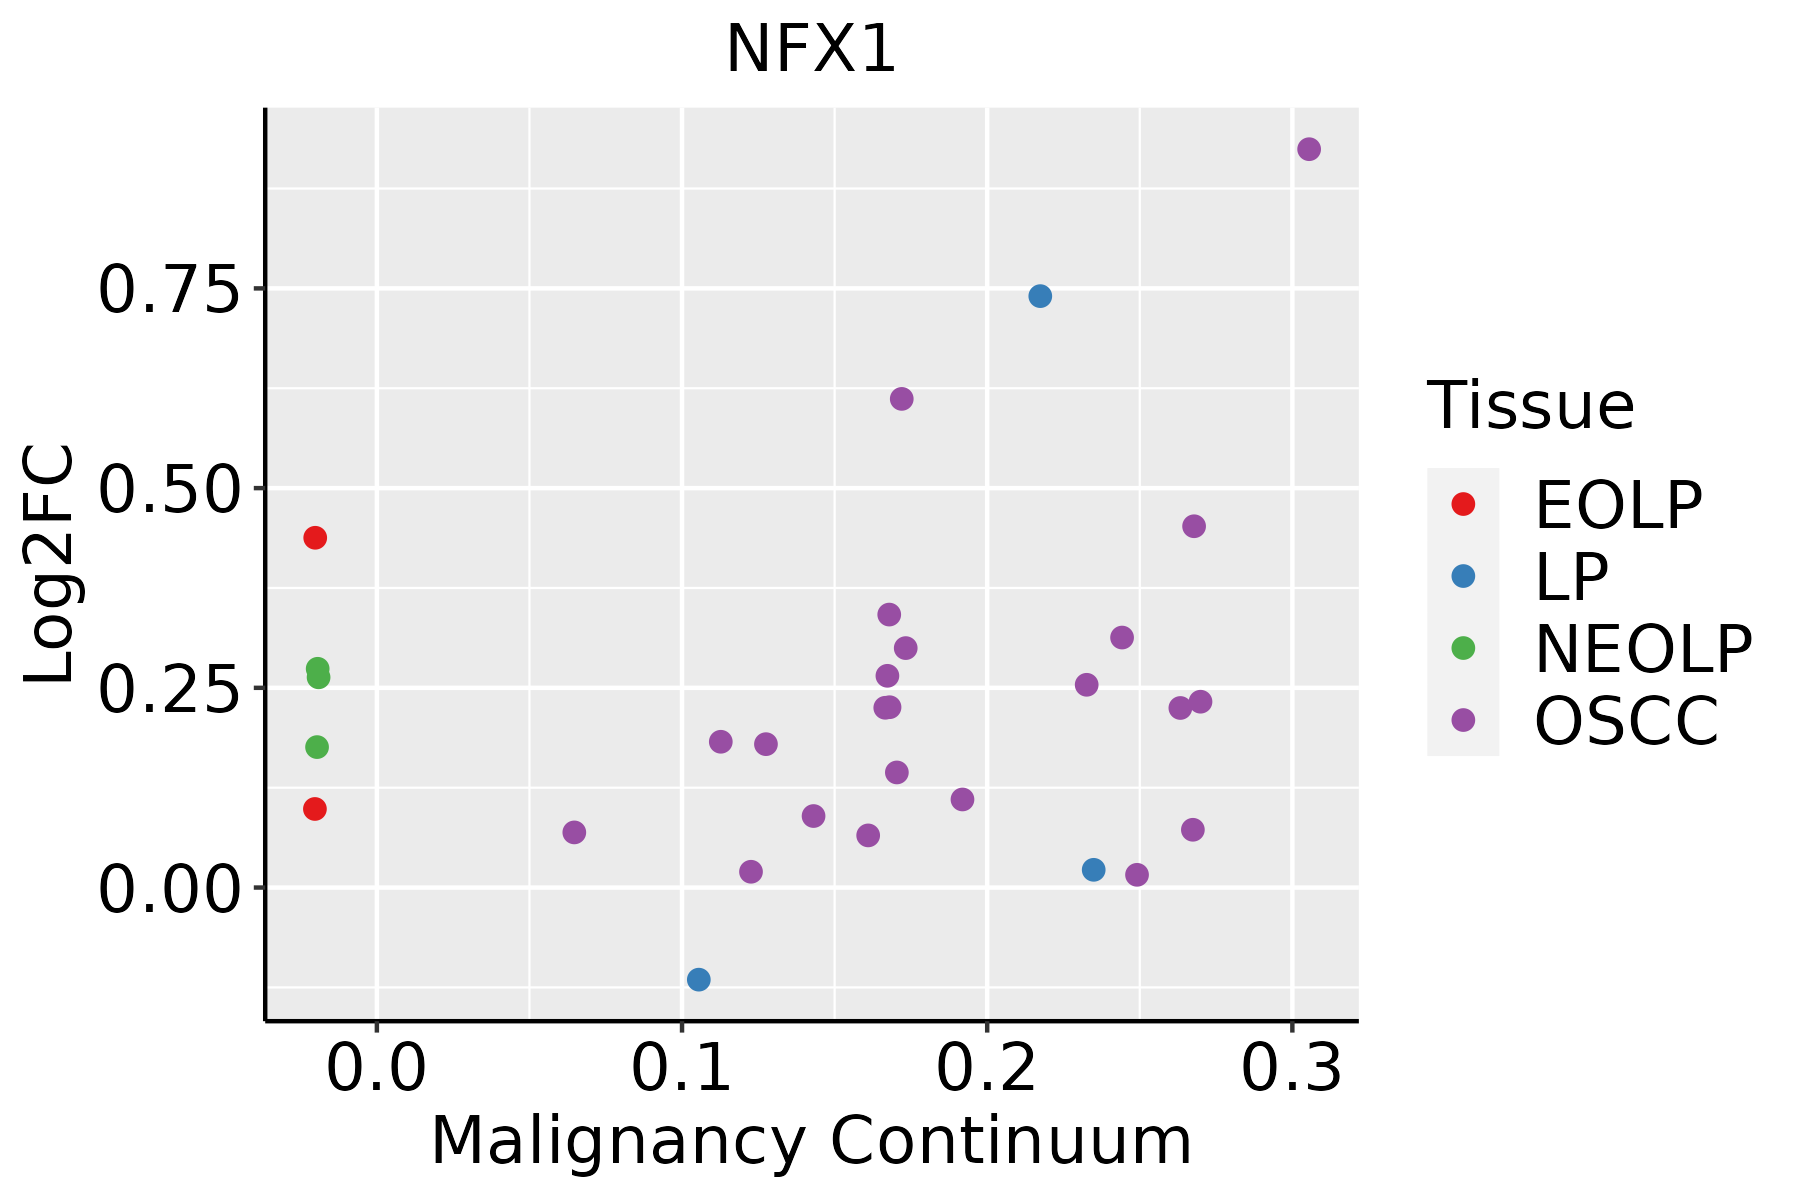 | EOLP: Erosive Oral lichen planus |
| LP: leukoplakia |
| NEOLP: Non-erosive oral lichen planus |
| OSCC: Oral squamous cell carcinoma |
| Thyroid | 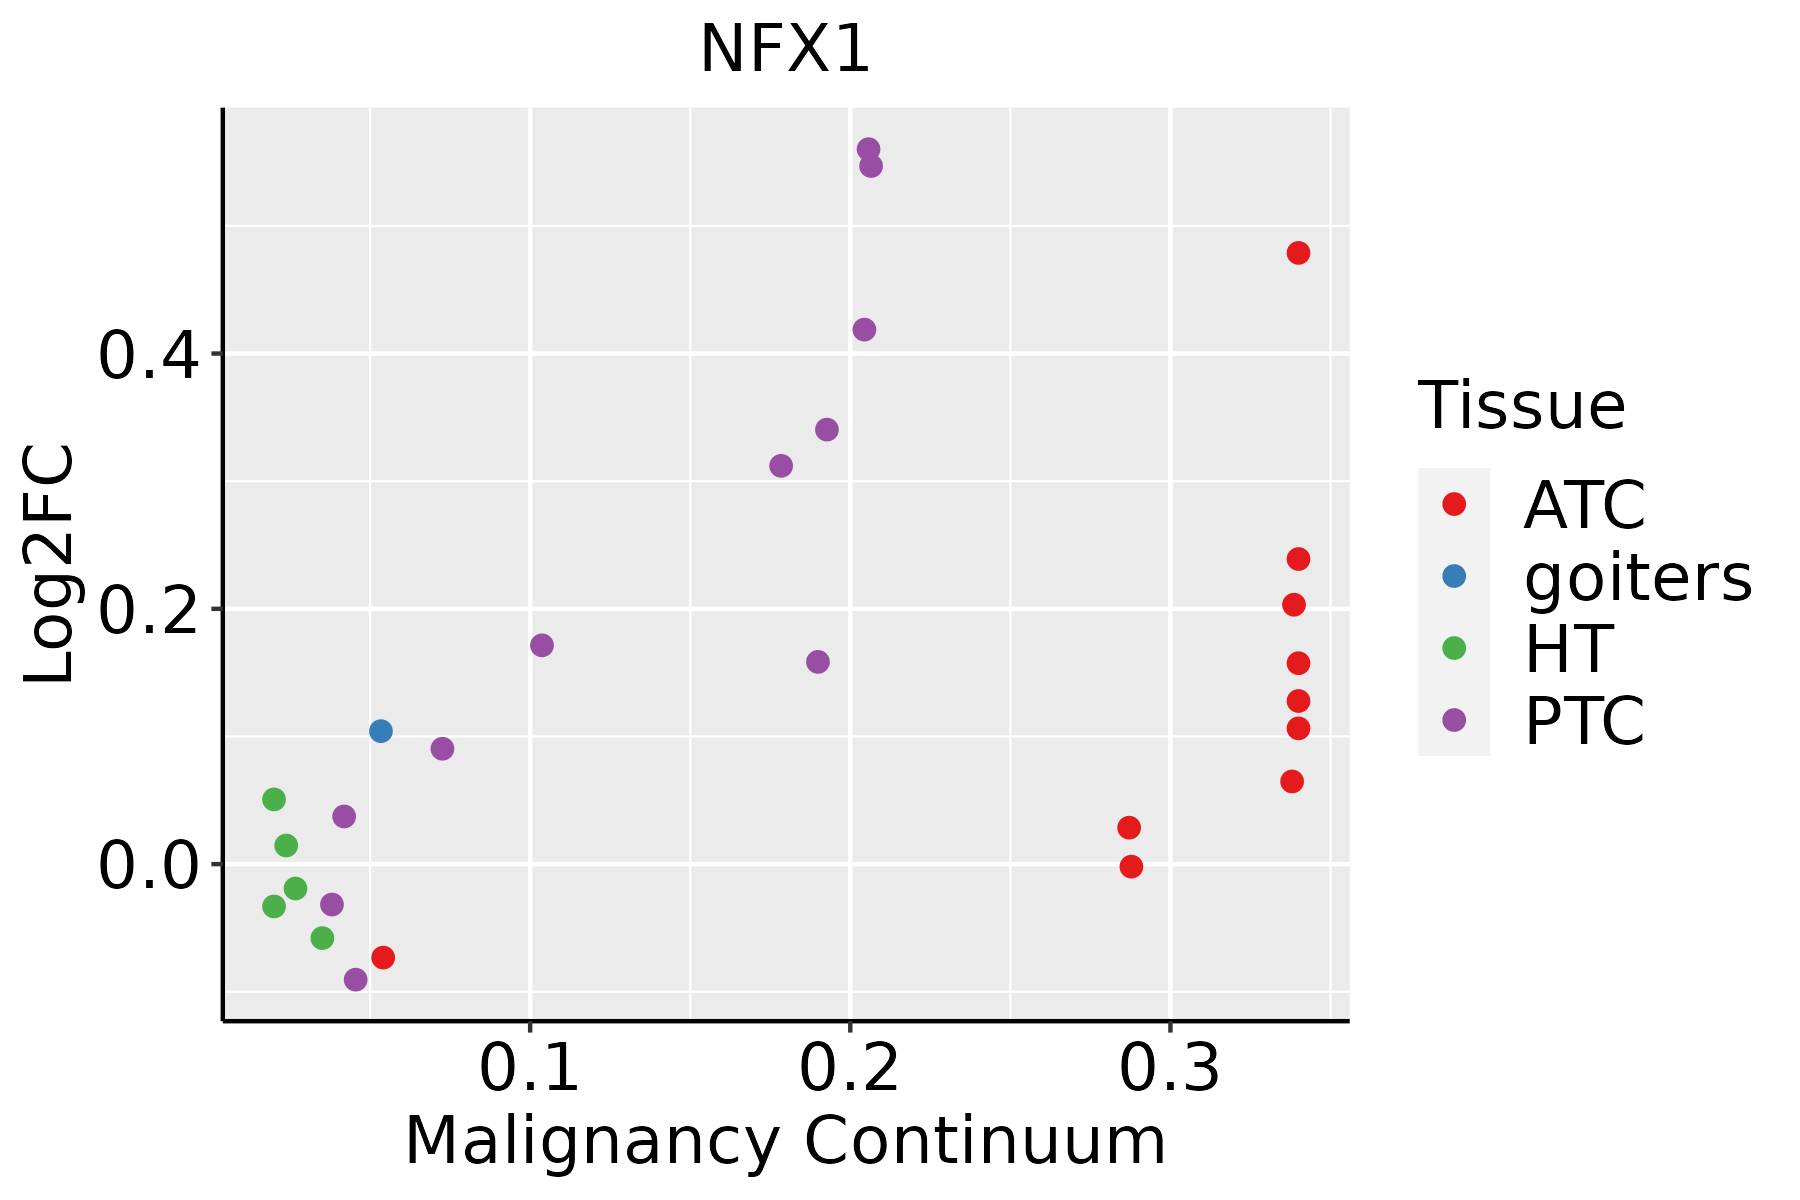 | ATC: Anaplastic thyroid cancer |
| HT: Hashimoto's thyroiditis |
| PTC: Papillary thyroid cancer |
| GO ID | Tissue | Disease Stage | Description | Gene Ratio | Bg Ratio | pvalue | p.adjust | Count |
| GO:00518656 | Cervix | CC | protein autoubiquitination | 17/2311 | 73/18723 | 6.71e-03 | 3.70e-02 | 17 |
| GO:0006325 | Colorectum | AD | chromatin organization | 119/3918 | 409/18723 | 4.85e-05 | 8.33e-04 | 119 |
| GO:0051865 | Colorectum | AD | protein autoubiquitination | 28/3918 | 73/18723 | 4.87e-04 | 5.30e-03 | 28 |
| GO:00063251 | Colorectum | SER | chromatin organization | 89/2897 | 409/18723 | 4.15e-04 | 6.17e-03 | 89 |
| GO:00063252 | Colorectum | MSS | chromatin organization | 107/3467 | 409/18723 | 7.22e-05 | 1.21e-03 | 107 |
| GO:00518652 | Colorectum | FAP | protein autoubiquitination | 22/2622 | 73/18723 | 2.88e-04 | 3.77e-03 | 22 |
| GO:00518653 | Colorectum | CRC | protein autoubiquitination | 18/2078 | 73/18723 | 8.33e-04 | 1.04e-02 | 18 |
| GO:000632517 | Esophagus | ESCC | chromatin organization | 240/8552 | 409/18723 | 6.52e-08 | 1.14e-06 | 240 |
| GO:00400295 | Esophagus | ESCC | regulation of gene expression, epigenetic | 74/8552 | 105/18723 | 2.24e-07 | 3.42e-06 | 74 |
| GO:00518658 | Esophagus | ESCC | protein autoubiquitination | 47/8552 | 73/18723 | 9.72e-04 | 4.93e-03 | 47 |
| GO:00708281 | Esophagus | ESCC | heterochromatin organization | 31/8552 | 46/18723 | 2.42e-03 | 1.06e-02 | 31 |
| GO:0045814 | Esophagus | ESCC | negative regulation of gene expression, epigenetic | 32/8552 | 50/18723 | 6.90e-03 | 2.52e-02 | 32 |
| GO:000632511 | Liver | HCC | chromatin organization | 206/7958 | 409/18723 | 7.23e-04 | 4.41e-03 | 206 |
| GO:0040029 | Liver | HCC | regulation of gene expression, epigenetic | 61/7958 | 105/18723 | 9.02e-04 | 5.31e-03 | 61 |
| GO:00518654 | Liver | HCC | protein autoubiquitination | 42/7958 | 73/18723 | 6.78e-03 | 2.73e-02 | 42 |
| GO:00400294 | Oral cavity | OSCC | regulation of gene expression, epigenetic | 59/7305 | 105/18723 | 2.62e-04 | 1.68e-03 | 59 |
| GO:000632510 | Oral cavity | OSCC | chromatin organization | 190/7305 | 409/18723 | 1.17e-03 | 5.97e-03 | 190 |
| GO:00518657 | Oral cavity | OSCC | protein autoubiquitination | 40/7305 | 73/18723 | 4.45e-03 | 1.79e-02 | 40 |
| GO:004002911 | Oral cavity | LP | regulation of gene expression, epigenetic | 39/4623 | 105/18723 | 3.00e-03 | 2.05e-02 | 39 |
| GO:005186512 | Oral cavity | LP | protein autoubiquitination | 29/4623 | 73/18723 | 3.20e-03 | 2.18e-02 | 29 |
| Pathway ID | Tissue | Disease Stage | Description | Gene Ratio | Bg Ratio | pvalue | p.adjust | qvalue | Count |
| hsa051657 | Cervix | CC | Human papillomavirus infection | 74/1267 | 331/8465 | 1.70e-04 | 1.02e-03 | 6.03e-04 | 74 |
| hsa0516512 | Cervix | CC | Human papillomavirus infection | 74/1267 | 331/8465 | 1.70e-04 | 1.02e-03 | 6.03e-04 | 74 |
| hsa0516510 | Esophagus | ESCC | Human papillomavirus infection | 215/4205 | 331/8465 | 7.86e-09 | 7.12e-08 | 3.65e-08 | 215 |
| hsa0516515 | Esophagus | ESCC | Human papillomavirus infection | 215/4205 | 331/8465 | 7.86e-09 | 7.12e-08 | 3.65e-08 | 215 |
| hsa05165 | Liver | Cirrhotic | Human papillomavirus infection | 124/2530 | 331/8465 | 1.55e-03 | 7.83e-03 | 4.83e-03 | 124 |
| hsa051651 | Liver | Cirrhotic | Human papillomavirus infection | 124/2530 | 331/8465 | 1.55e-03 | 7.83e-03 | 4.83e-03 | 124 |
| hsa051652 | Liver | HCC | Human papillomavirus infection | 188/4020 | 331/8465 | 3.34e-04 | 1.49e-03 | 8.29e-04 | 188 |
| hsa051653 | Liver | HCC | Human papillomavirus infection | 188/4020 | 331/8465 | 3.34e-04 | 1.49e-03 | 8.29e-04 | 188 |
| hsa051659 | Oral cavity | OSCC | Human papillomavirus infection | 200/3704 | 331/8465 | 3.83e-10 | 4.93e-09 | 2.51e-09 | 200 |
| hsa0516514 | Oral cavity | OSCC | Human papillomavirus infection | 200/3704 | 331/8465 | 3.83e-10 | 4.93e-09 | 2.51e-09 | 200 |
| hsa0516523 | Oral cavity | LP | Human papillomavirus infection | 121/2418 | 331/8465 | 8.00e-04 | 3.86e-03 | 2.49e-03 | 121 |
| hsa0516533 | Oral cavity | LP | Human papillomavirus infection | 121/2418 | 331/8465 | 8.00e-04 | 3.86e-03 | 2.49e-03 | 121 |
| hsa0516541 | Oral cavity | EOLP | Human papillomavirus infection | 79/1218 | 331/8465 | 1.96e-06 | 1.63e-05 | 9.60e-06 | 79 |
| hsa0516551 | Oral cavity | EOLP | Human papillomavirus infection | 79/1218 | 331/8465 | 1.96e-06 | 1.63e-05 | 9.60e-06 | 79 |
| hsa0516561 | Oral cavity | NEOLP | Human papillomavirus infection | 90/1112 | 331/8465 | 2.75e-12 | 1.75e-10 | 1.10e-10 | 90 |
| hsa0516571 | Oral cavity | NEOLP | Human papillomavirus infection | 90/1112 | 331/8465 | 2.75e-12 | 1.75e-10 | 1.10e-10 | 90 |
| Hugo Symbol | Variant Class | Variant Classification | dbSNP RS | HGVSc | HGVSp | HGVSp Short | SWISSPROT | BIOTYPE | SIFT | PolyPhen | Tumor Sample Barcode | Tissue | Histology | Sex | Age | Stage | Therapy Types | Drugs | Outcome |
| NFX1 | SNV | Missense_Mutation | novel | c.2790N>T | p.Glu930Asp | p.E930D | Q12986 | protein_coding | tolerated(0.49) | benign(0.007) | TCGA-AN-A046-01 | Breast | breast invasive carcinoma | Female | >=65 | I/II | Unknown | Unknown | SD |
| NFX1 | SNV | Missense_Mutation | rs199721480 | c.1756N>T | p.Arg586Trp | p.R586W | Q12986 | protein_coding | deleterious(0.02) | probably_damaging(0.978) | TCGA-BH-A0HF-01 | Breast | breast invasive carcinoma | Female | >=65 | I/II | Hormone Therapy | arimidex | SD |
| NFX1 | SNV | Missense_Mutation | | c.3029N>T | p.Ala1010Val | p.A1010V | Q12986 | protein_coding | tolerated(0.1) | benign(0.212) | TCGA-BH-A18G-01 | Breast | breast invasive carcinoma | Female | >=65 | I/II | Unknown | Unknown | SD |
| NFX1 | SNV | Missense_Mutation | novel | c.1387N>G | p.Pro463Ala | p.P463A | Q12986 | protein_coding | deleterious(0.01) | probably_damaging(0.968) | TCGA-BH-A8FZ-01 | Breast | breast invasive carcinoma | Female | <65 | I/II | Unknown | Unknown | SD |
| NFX1 | SNV | Missense_Mutation | | c.1911N>G | p.Phe637Leu | p.F637L | Q12986 | protein_coding | tolerated(0.54) | benign(0.009) | TCGA-D8-A1JA-01 | Breast | breast invasive carcinoma | Female | <65 | III/IV | Chemotherapy | adriamycin | PD |
| NFX1 | SNV | Missense_Mutation | | c.2948G>T | p.Ser983Ile | p.S983I | Q12986 | protein_coding | deleterious(0) | benign(0.184) | TCGA-D8-A1JM-01 | Breast | breast invasive carcinoma | Female | <65 | I/II | ChemotherapyHormone Therapy | doxorubicine | SD |
| NFX1 | SNV | Missense_Mutation | | c.568N>C | p.Cys190Arg | p.C190R | Q12986 | protein_coding | tolerated_low_confidence(0.35) | benign(0.014) | TCGA-EW-A1IZ-01 | Breast | breast invasive carcinoma | Female | <65 | III/IV | Chemotherapy | taxotere | SD |
| NFX1 | insertion | Frame_Shift_Ins | novel | c.3258_3259insTGTTTCTCTGCTTGTGTGTCTGTAT | p.Pro1087CysfsTer25 | p.P1087Cfs*25 | Q12986 | protein_coding | | | TCGA-A2-A04Y-01 | Breast | breast invasive carcinoma | Female | <65 | I/II | Chemotherapy | cytoxan | SD |
| NFX1 | insertion | Nonsense_Mutation | novel | c.1032_1033insCTGTTTTGAAAGAAGACCACATGGAACCTGATGATTGATATCCCT | p.Thr344_Gly345insLeuPheTerLysLysThrThrTrpAsnLeuMetIleAspIlePro | p.T344_G345insLF*KKTTWNLMIDIP | Q12986 | protein_coding | | | TCGA-A8-A0A1-01 | Breast | breast invasive carcinoma | Female | >=65 | I/II | Hormone Therapy | tamoxiphen | SD |
| NFX1 | insertion | Frame_Shift_Ins | novel | c.1149_1150insGCTTATGGTAGGCACCAAGAATATCTTTGTT | p.Asn384AlafsTer11 | p.N384Afs*11 | Q12986 | protein_coding | | | TCGA-AO-A03R-01 | Breast | breast invasive carcinoma | Female | <65 | I/II | Chemotherapy | doxorubicin | SD |


