
|
|||||
|
 | |
| |
| |
| |
| |
| |
|
Gene: NFS1 |
Gene summary for NFS1 |
| Gene information | Species | Human | Gene symbol | NFS1 | Gene ID | 9054 |
| Gene name | NFS1 cysteine desulfurase | |
| Gene Alias | COXPD52 | |
| Cytomap | 20q11.22 | |
| Gene Type | protein-coding | GO ID | GO:0006464 | UniProtAcc | Q53FP3 |
Top |
Malignant transformation analysis |
| Identification of the aberrant gene expression in precancerous and cancerous lesions by comparing the gene expression of stem-like cells in diseased tissues with normal stem cells |
| Entrez ID | Symbol | Replicates | Species | Organ | Tissue | Adj P-value | Log2FC | Malignancy |
| 9054 | NFS1 | HTA11_347_2000001011 | Human | Colorectum | AD | 5.95e-03 | 1.84e-01 | -0.1954 |
| 9054 | NFS1 | HTA11_866_3004761011 | Human | Colorectum | AD | 3.91e-05 | 2.55e-01 | 0.096 |
| 9054 | NFS1 | HTA11_7696_3000711011 | Human | Colorectum | AD | 1.03e-04 | 1.99e-01 | 0.0674 |
| 9054 | NFS1 | HTA11_99999970781_79442 | Human | Colorectum | MSS | 2.75e-02 | 1.86e-01 | 0.294 |
| 9054 | NFS1 | HTA11_99999971662_82457 | Human | Colorectum | MSS | 8.19e-23 | 6.19e-01 | 0.3859 |
| 9054 | NFS1 | HTA11_99999974143_84620 | Human | Colorectum | MSS | 1.26e-03 | 2.43e-01 | 0.3005 |
| 9054 | NFS1 | LZE4T | Human | Esophagus | ESCC | 6.93e-10 | 1.55e-01 | 0.0811 |
| 9054 | NFS1 | LZE20T | Human | Esophagus | ESCC | 5.18e-03 | 1.28e-01 | 0.0662 |
| 9054 | NFS1 | LZE24T | Human | Esophagus | ESCC | 1.42e-15 | 5.82e-01 | 0.0596 |
| 9054 | NFS1 | P2T-E | Human | Esophagus | ESCC | 6.25e-26 | 2.84e-01 | 0.1177 |
| 9054 | NFS1 | P4T-E | Human | Esophagus | ESCC | 8.32e-17 | 4.97e-01 | 0.1323 |
| 9054 | NFS1 | P5T-E | Human | Esophagus | ESCC | 1.04e-12 | 2.47e-01 | 0.1327 |
| 9054 | NFS1 | P8T-E | Human | Esophagus | ESCC | 8.80e-20 | 3.18e-01 | 0.0889 |
| 9054 | NFS1 | P9T-E | Human | Esophagus | ESCC | 2.23e-10 | 2.73e-01 | 0.1131 |
| 9054 | NFS1 | P10T-E | Human | Esophagus | ESCC | 5.55e-15 | 2.22e-01 | 0.116 |
| 9054 | NFS1 | P11T-E | Human | Esophagus | ESCC | 4.70e-11 | 4.19e-01 | 0.1426 |
| 9054 | NFS1 | P12T-E | Human | Esophagus | ESCC | 1.11e-11 | 2.73e-01 | 0.1122 |
| 9054 | NFS1 | P15T-E | Human | Esophagus | ESCC | 2.37e-13 | 2.84e-01 | 0.1149 |
| 9054 | NFS1 | P16T-E | Human | Esophagus | ESCC | 2.11e-19 | 3.42e-01 | 0.1153 |
| 9054 | NFS1 | P17T-E | Human | Esophagus | ESCC | 1.16e-02 | 4.09e-01 | 0.1278 |
| Page: 1 2 3 4 5 |
| Tissue | Expression Dynamics | Abbreviation |
| Colorectum (GSE201348) |  | FAP: Familial adenomatous polyposis |
| CRC: Colorectal cancer | ||
| Colorectum (HTA11) |  | AD: Adenomas |
| SER: Sessile serrated lesions | ||
| MSI-H: Microsatellite-high colorectal cancer | ||
| MSS: Microsatellite stable colorectal cancer | ||
| Esophagus | 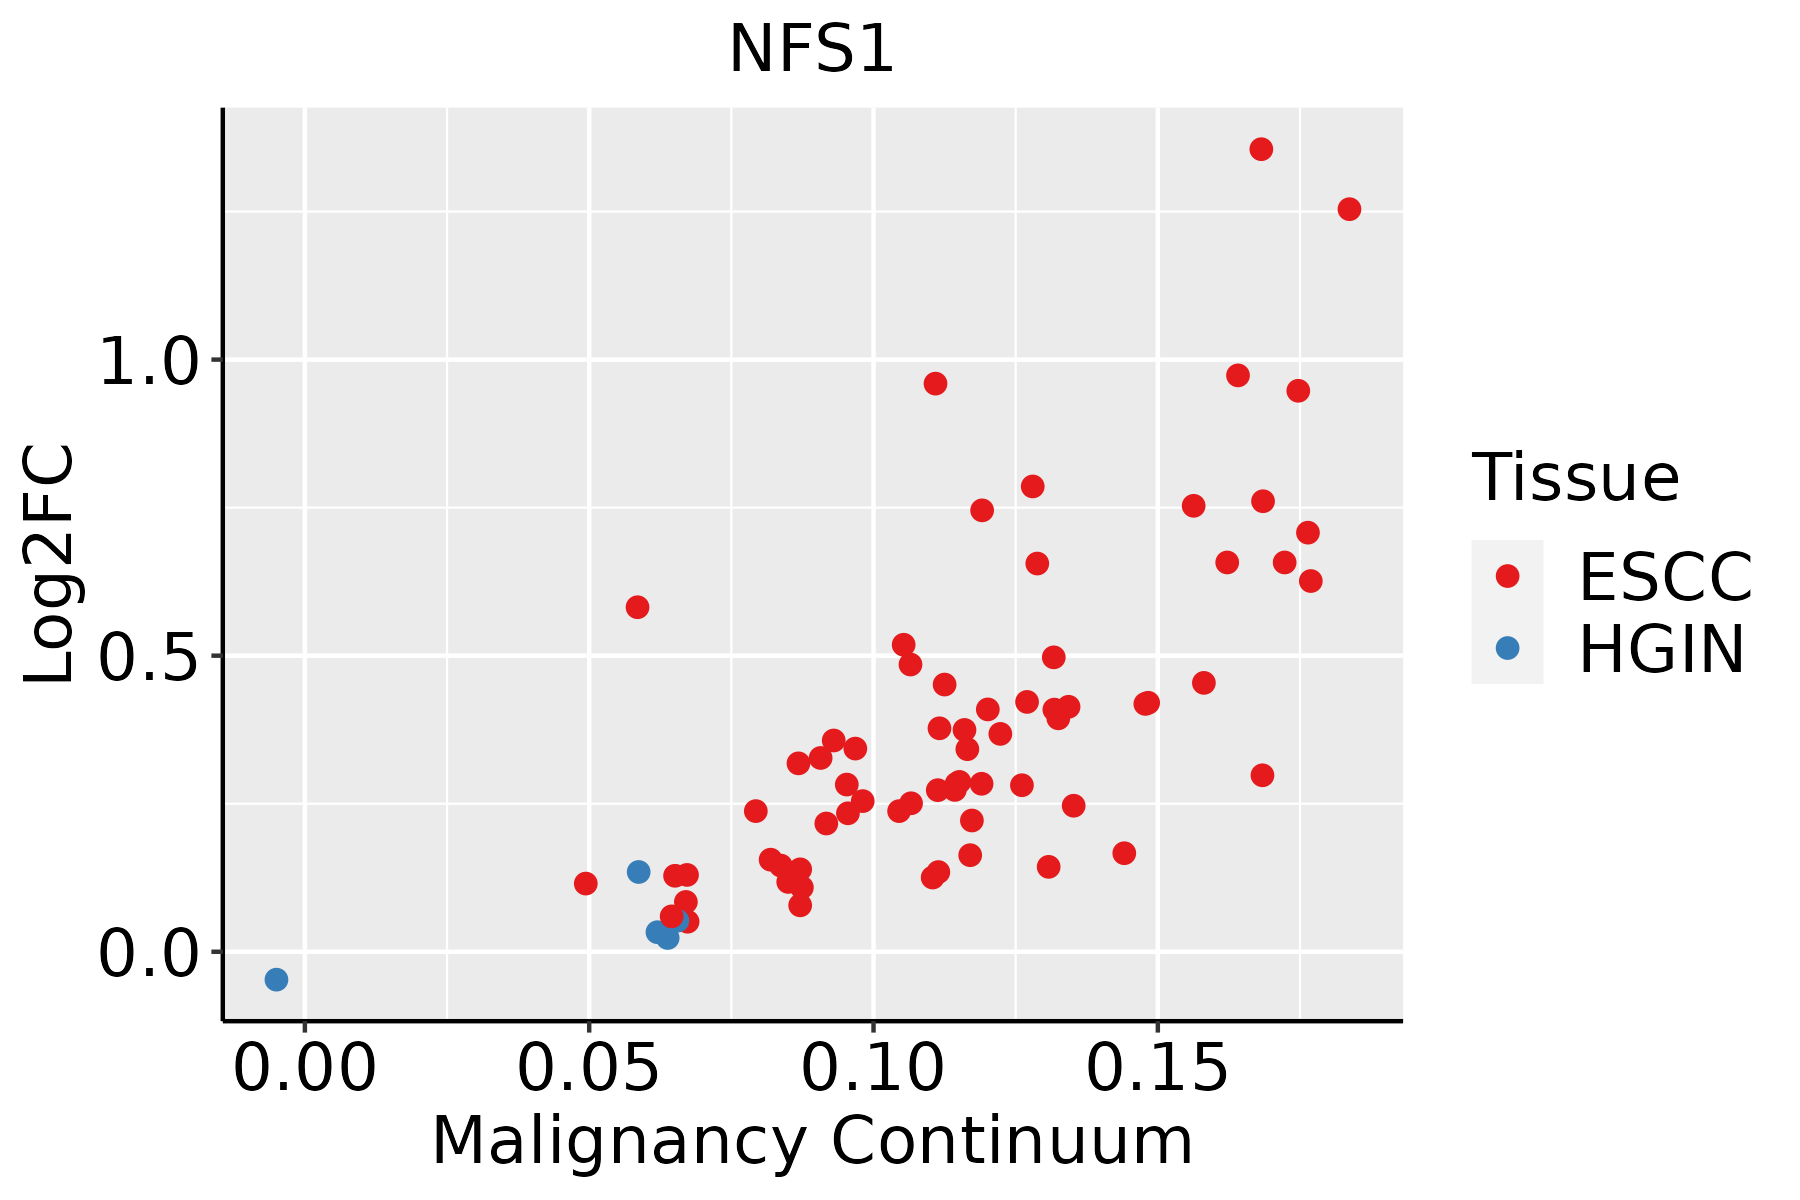 | ESCC: Esophageal squamous cell carcinoma |
| HGIN: High-grade intraepithelial neoplasias | ||
| LGIN: Low-grade intraepithelial neoplasias | ||
| Liver | 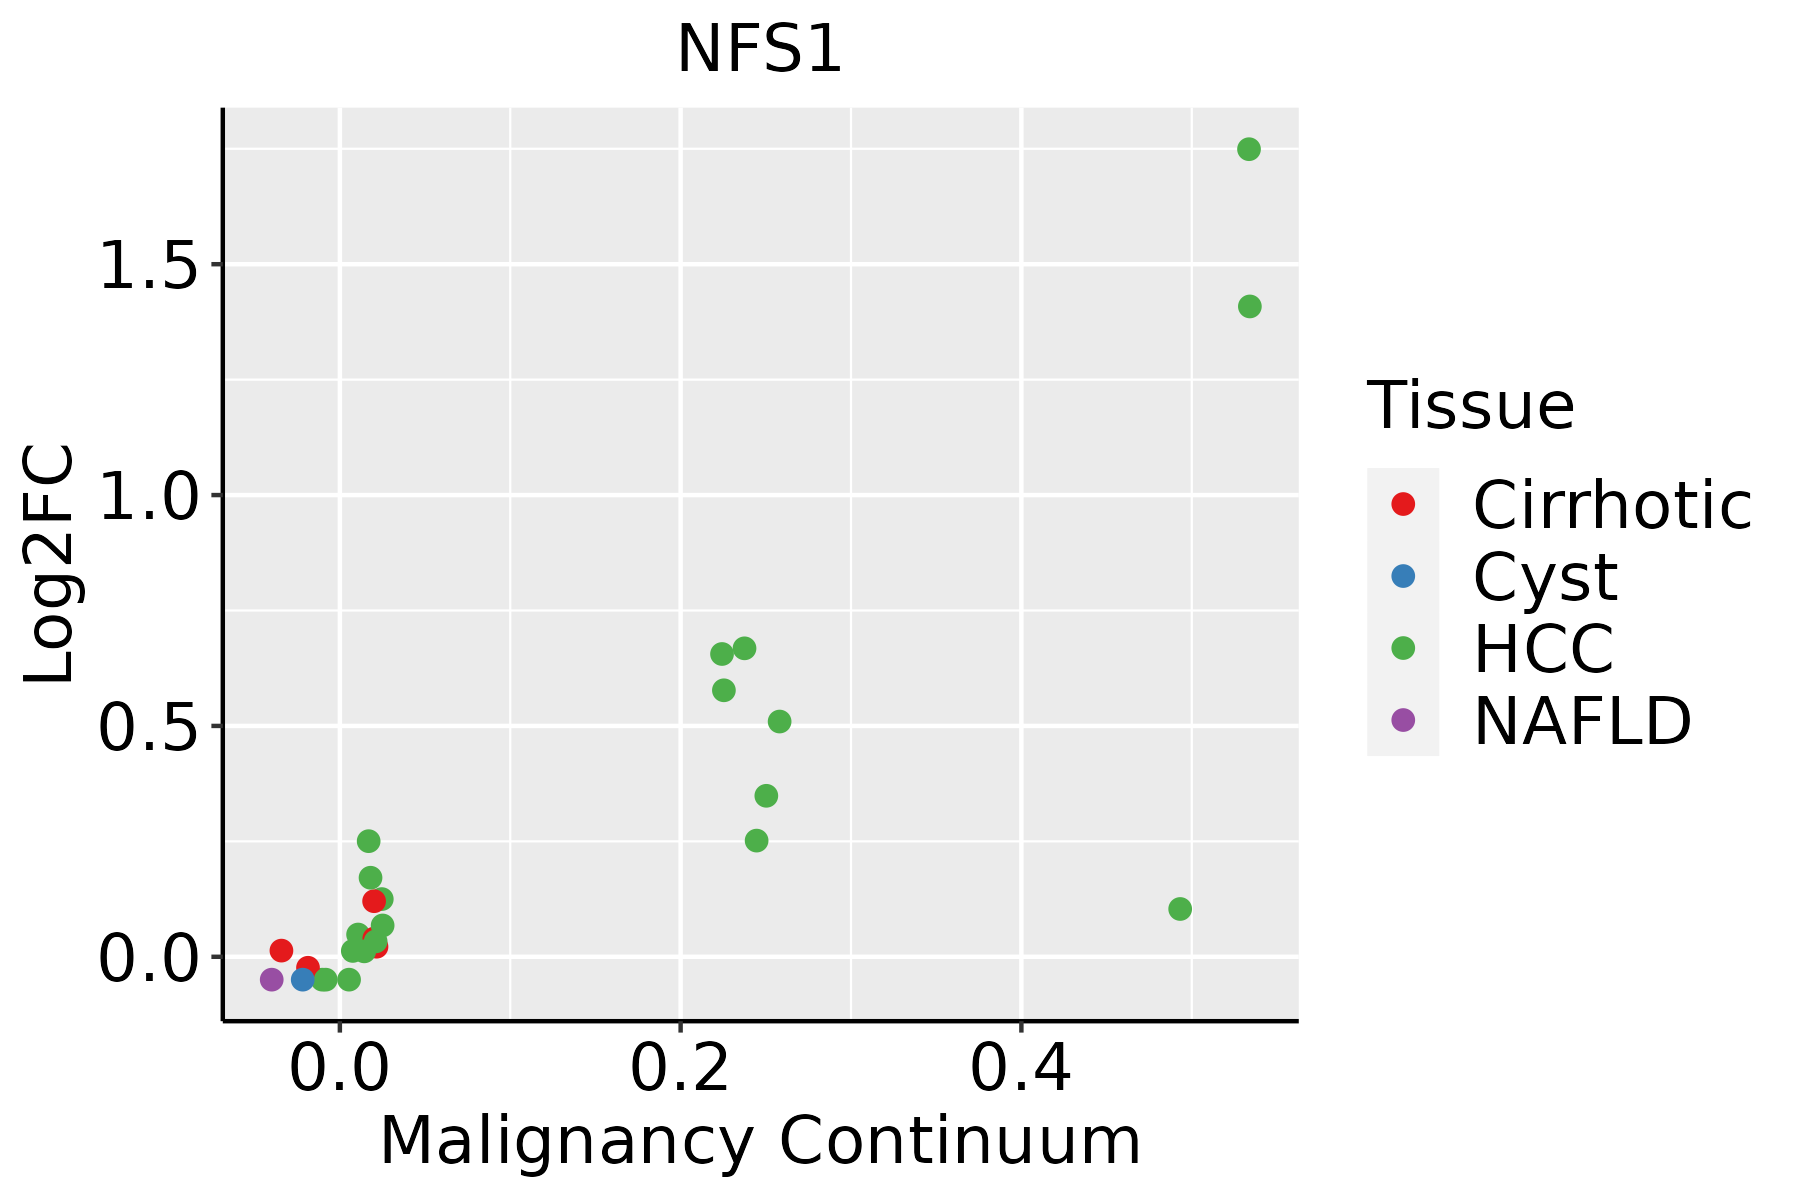 | HCC: Hepatocellular carcinoma |
| NAFLD: Non-alcoholic fatty liver disease | ||
| Oral Cavity |  | EOLP: Erosive Oral lichen planus |
| LP: leukoplakia | ||
| NEOLP: Non-erosive oral lichen planus | ||
| OSCC: Oral squamous cell carcinoma | ||
| Skin | 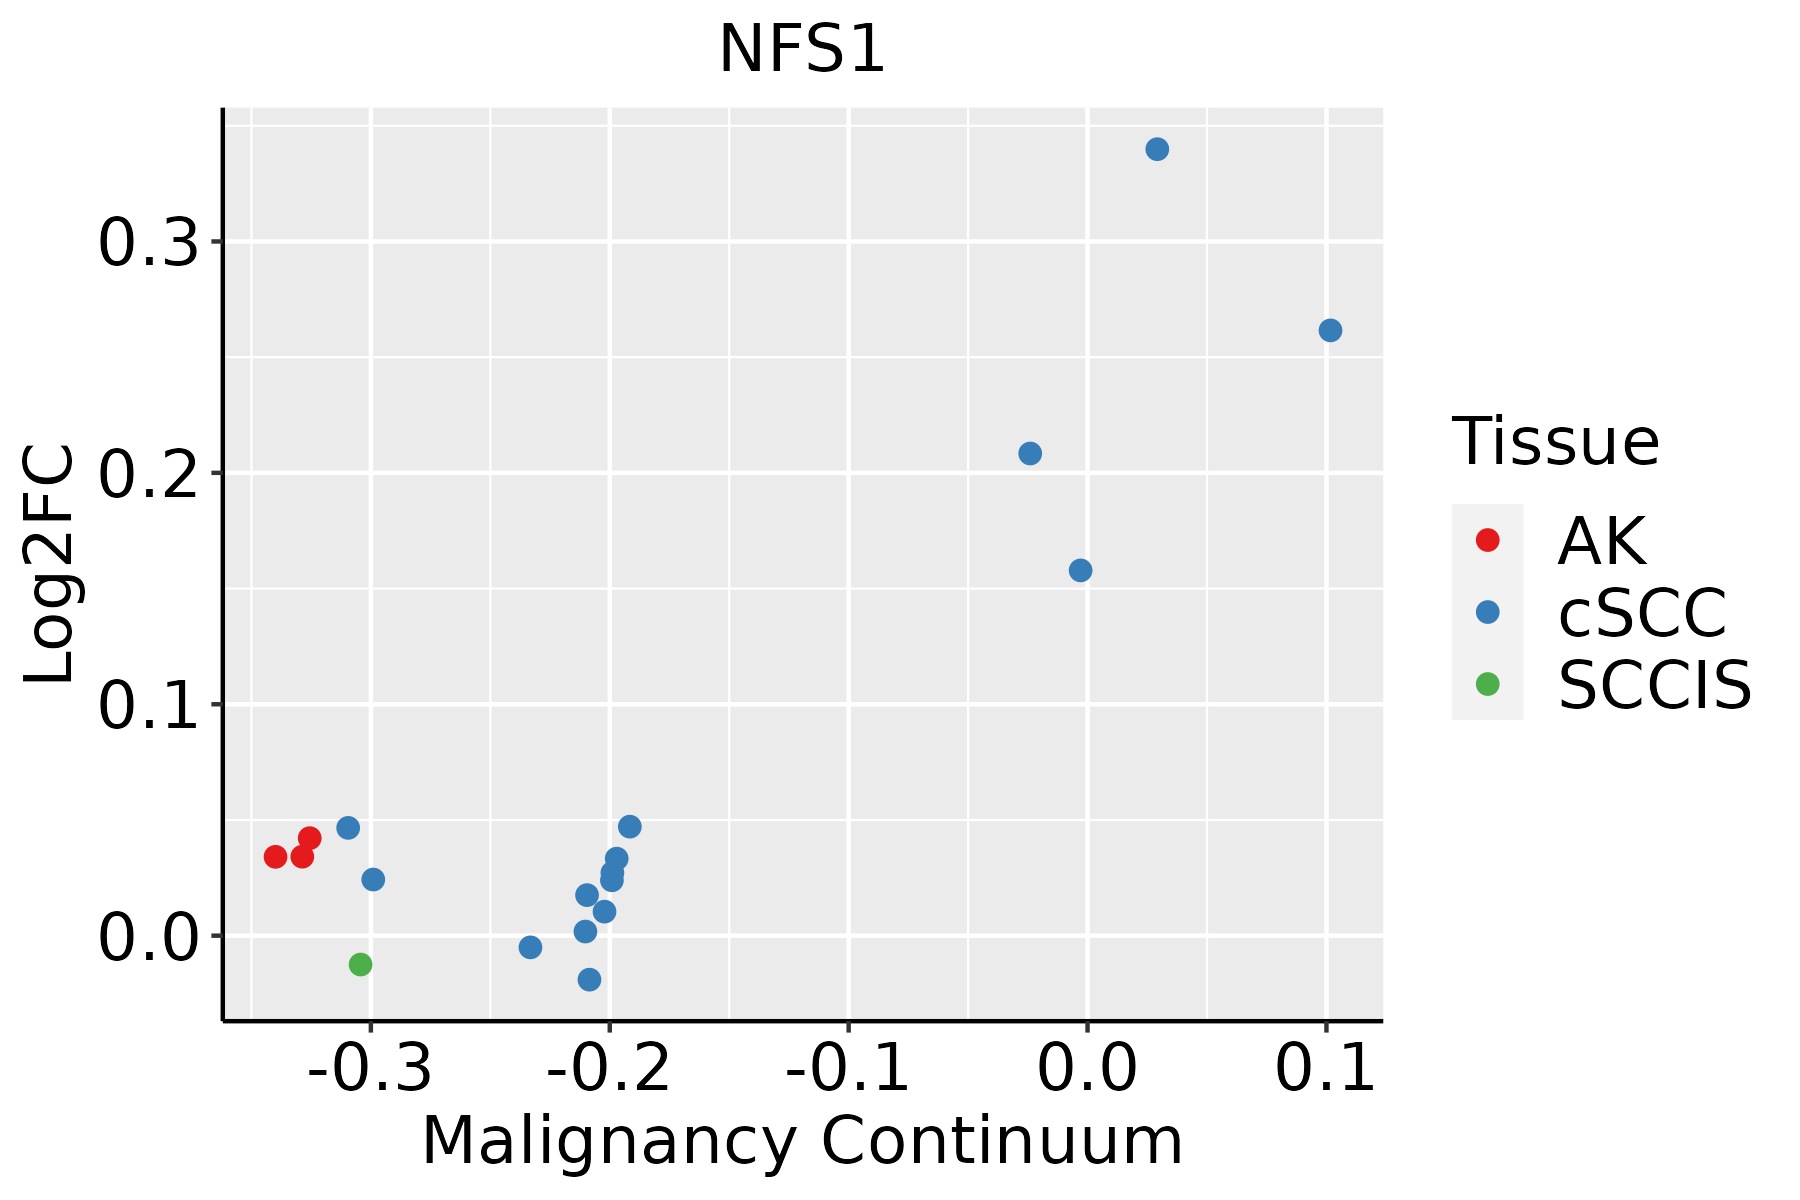 | AK: Actinic keratosis |
| cSCC: Cutaneous squamous cell carcinoma | ||
| SCCIS:squamous cell carcinoma in situ |
| ∗log2FC in expression of this searched gene in stem-like cells from each diseased tissue sample relative to stem-like cells in normal samples in each tissue plotted against the malignancy continuum. Samples are colored based on if they are from different disease stage. |
Top |
Malignant transformation related pathway analysis |
| Find out the enriched GO biological processes and KEGG pathways involved in transition from healthy to precancer to cancer |
| Tissue | Disease Stage | Enriched GO biological Processes |
| Colorectum | AD |  |
| Colorectum | SER |  |
| Colorectum | MSS |  |
| Colorectum | MSI-H |  |
| Colorectum | FAP |  |
| ∗Top 15 enriched GO BP terms are showed in the bar plot of each disease state in each tissue. Each row represents a significant GO biological process which is colored according to the -log10(p.adjust). |
| Page: 1 2 3 4 5 6 7 8 9 |
| GO ID | Tissue | Disease Stage | Description | Gene Ratio | Bg Ratio | pvalue | p.adjust | Count |
| GO:0006790 | Colorectum | AD | sulfur compound metabolic process | 101/3918 | 339/18723 | 6.46e-05 | 1.07e-03 | 101 |
| GO:00067902 | Colorectum | MSS | sulfur compound metabolic process | 85/3467 | 339/18723 | 1.52e-03 | 1.39e-02 | 85 |
| GO:00067906 | Esophagus | ESCC | sulfur compound metabolic process | 201/8552 | 339/18723 | 2.64e-07 | 3.94e-06 | 201 |
| GO:001622611 | Esophagus | ESCC | iron-sulfur cluster assembly | 21/8552 | 26/18723 | 2.69e-04 | 1.63e-03 | 21 |
| GO:003116311 | Esophagus | ESCC | metallo-sulfur cluster assembly | 21/8552 | 26/18723 | 2.69e-04 | 1.63e-03 | 21 |
| GO:000679011 | Liver | Cirrhotic | sulfur compound metabolic process | 129/4634 | 339/18723 | 3.06e-08 | 1.04e-06 | 129 |
| GO:000679021 | Liver | HCC | sulfur compound metabolic process | 212/7958 | 339/18723 | 5.60e-14 | 3.39e-12 | 212 |
| GO:0016226 | Liver | HCC | iron-sulfur cluster assembly | 18/7958 | 26/18723 | 5.37e-03 | 2.24e-02 | 18 |
| GO:0031163 | Liver | HCC | metallo-sulfur cluster assembly | 18/7958 | 26/18723 | 5.37e-03 | 2.24e-02 | 18 |
| GO:00067905 | Oral cavity | OSCC | sulfur compound metabolic process | 168/7305 | 339/18723 | 4.50e-05 | 3.84e-04 | 168 |
| GO:00162262 | Oral cavity | OSCC | iron-sulfur cluster assembly | 19/7305 | 26/18723 | 4.46e-04 | 2.70e-03 | 19 |
| GO:00311632 | Oral cavity | OSCC | metallo-sulfur cluster assembly | 19/7305 | 26/18723 | 4.46e-04 | 2.70e-03 | 19 |
| GO:00162261 | Oral cavity | LP | iron-sulfur cluster assembly | 15/4623 | 26/18723 | 3.34e-04 | 3.34e-03 | 15 |
| GO:00311631 | Oral cavity | LP | metallo-sulfur cluster assembly | 15/4623 | 26/18723 | 3.34e-04 | 3.34e-03 | 15 |
| GO:000679012 | Oral cavity | LP | sulfur compound metabolic process | 106/4623 | 339/18723 | 3.36e-03 | 2.25e-02 | 106 |
| GO:00162264 | Skin | cSCC | iron-sulfur cluster assembly | 14/4864 | 26/18723 | 2.26e-03 | 1.32e-02 | 14 |
| GO:00311634 | Skin | cSCC | metallo-sulfur cluster assembly | 14/4864 | 26/18723 | 2.26e-03 | 1.32e-02 | 14 |
| Page: 1 |
| Pathway ID | Tissue | Disease Stage | Description | Gene Ratio | Bg Ratio | pvalue | p.adjust | qvalue | Count |
| hsa012405 | Esophagus | ESCC | Biosynthesis of cofactors | 97/4205 | 153/8465 | 3.88e-04 | 1.35e-03 | 6.94e-04 | 97 |
| hsa0124012 | Esophagus | ESCC | Biosynthesis of cofactors | 97/4205 | 153/8465 | 3.88e-04 | 1.35e-03 | 6.94e-04 | 97 |
| hsa01240 | Liver | Cirrhotic | Biosynthesis of cofactors | 66/2530 | 153/8465 | 3.11e-04 | 1.99e-03 | 1.23e-03 | 66 |
| hsa012401 | Liver | Cirrhotic | Biosynthesis of cofactors | 66/2530 | 153/8465 | 3.11e-04 | 1.99e-03 | 1.23e-03 | 66 |
| hsa012402 | Liver | HCC | Biosynthesis of cofactors | 103/4020 | 153/8465 | 4.67e-07 | 5.05e-06 | 2.81e-06 | 103 |
| hsa012403 | Liver | HCC | Biosynthesis of cofactors | 103/4020 | 153/8465 | 4.67e-07 | 5.05e-06 | 2.81e-06 | 103 |
| hsa012404 | Oral cavity | OSCC | Biosynthesis of cofactors | 88/3704 | 153/8465 | 3.84e-04 | 1.20e-03 | 6.12e-04 | 88 |
| hsa0124011 | Oral cavity | OSCC | Biosynthesis of cofactors | 88/3704 | 153/8465 | 3.84e-04 | 1.20e-03 | 6.12e-04 | 88 |
| hsa0124021 | Oral cavity | LP | Biosynthesis of cofactors | 57/2418 | 153/8465 | 1.17e-02 | 3.91e-02 | 2.52e-02 | 57 |
| hsa0124031 | Oral cavity | LP | Biosynthesis of cofactors | 57/2418 | 153/8465 | 1.17e-02 | 3.91e-02 | 2.52e-02 | 57 |
| Page: 1 |
Top |
Cell-cell communication analysis |
| Identification of potential cell-cell interactions between two cell types and their ligand-receptor pairs for different disease states |
| Ligand | Receptor | LRpair | Pathway | Tissue | Disease Stage |
| Page: 1 |
Top |
Single-cell gene regulatory network inference analysis |
| Find out the significant the regulons (TFs) and the target genes of each regulon across cell types for different disease states |
| TF | Cell Type | Tissue | Disease Stage | Target Gene | RSS | Regulon Activity |
| ∗The dot plots of a searched regulon are shown for all cell subpopulations in each disease state of each tissue based on the regulon specific score inferred using pySCENIC and by calculating the average expression. |
| Page: 1 |
Top |
Somatic mutation of malignant transformation related genes |
| Annotation of somatic variants for genes involved in malignant transformation |
| Hugo Symbol | Variant Class | Variant Classification | dbSNP RS | HGVSc | HGVSp | HGVSp Short | SWISSPROT | BIOTYPE | SIFT | PolyPhen | Tumor Sample Barcode | Tissue | Histology | Sex | Age | Stage | Therapy Types | Drugs | Outcome |
| NFS1 | SNV | Missense_Mutation | c.553N>T | p.Asp185Tyr | p.D185Y | Q9Y697 | protein_coding | deleterious(0) | probably_damaging(0.992) | TCGA-BH-A0BZ-01 | Breast | breast invasive carcinoma | Female | <65 | III/IV | Chemotherapy | doxorubicin | CR | |
| NFS1 | insertion | Frame_Shift_Ins | novel | c.1325_1326insAGAGG | p.Met442IlefsTer24 | p.M442Ifs*24 | Q9Y697 | protein_coding | TCGA-A8-A09X-01 | Breast | breast invasive carcinoma | Female | <65 | III/IV | Unknown | Unknown | SD | ||
| NFS1 | insertion | Nonsense_Mutation | novel | c.1324_1325insCAGACTGAATGGACAGTTTCT | p.Met442delinsThrAspTerMetAspSerPheLeu | p.M442delinsTD*MDSFL | Q9Y697 | protein_coding | TCGA-A8-A09X-01 | Breast | breast invasive carcinoma | Female | <65 | III/IV | Unknown | Unknown | SD | ||
| NFS1 | insertion | Frame_Shift_Ins | novel | c.429_430insACTTGTTTCTTTTTCTTTTTTTTGAGATGGAGTCTCACTCTTTTGCC | p.Ser144ThrfsTer22 | p.S144Tfs*22 | Q9Y697 | protein_coding | TCGA-AN-A0FF-01 | Breast | breast invasive carcinoma | Female | <65 | I/II | Unknown | Unknown | SD | ||
| NFS1 | SNV | Missense_Mutation | c.1234N>T | p.Arg412Cys | p.R412C | Q9Y697 | protein_coding | deleterious(0) | probably_damaging(0.986) | TCGA-2W-A8YY-01 | Cervix | cervical & endocervical cancer | Female | <65 | I/II | Chemotherapy | cisplatin | CR | |
| NFS1 | SNV | Missense_Mutation | novel | c.680N>C | p.Val227Ala | p.V227A | Q9Y697 | protein_coding | deleterious(0.03) | possibly_damaging(0.73) | TCGA-AA-3950-01 | Colorectum | colon adenocarcinoma | Female | >=65 | I/II | Unknown | Unknown | SD |
| NFS1 | SNV | Missense_Mutation | rs148047173 | c.824N>A | p.Arg275His | p.R275H | Q9Y697 | protein_coding | deleterious(0) | probably_damaging(0.983) | TCGA-AA-A01R-01 | Colorectum | colon adenocarcinoma | Male | <65 | III/IV | Chemotherapy | 5-fluorouracil | PD |
| NFS1 | SNV | Missense_Mutation | c.644N>A | p.Ile215Asn | p.I215N | Q9Y697 | protein_coding | deleterious(0) | probably_damaging(0.974) | TCGA-AZ-4313-01 | Colorectum | colon adenocarcinoma | Female | <65 | I/II | Unknown | Unknown | SD | |
| NFS1 | SNV | Missense_Mutation | novel | c.470N>C | p.Lys157Thr | p.K157T | Q9Y697 | protein_coding | deleterious(0) | probably_damaging(1) | TCGA-AZ-4315-01 | Colorectum | colon adenocarcinoma | Male | <65 | I/II | Unknown | Unknown | SD |
| NFS1 | SNV | Missense_Mutation | c.705N>T | p.Gln235His | p.Q235H | Q9Y697 | protein_coding | deleterious(0) | probably_damaging(0.997) | TCGA-AZ-6601-01 | Colorectum | colon adenocarcinoma | Male | >=65 | I/II | Unknown | Unknown | PD |
| Page: 1 2 3 4 5 |
Top |
Related drugs of malignant transformation related genes |
| Identification of chemicals and drugs interact with genes involved in malignant transfromation |
| (DGIdb 4.0) |
| Entrez ID | Symbol | Category | Interaction Types | Drug Claim Name | Drug Name | PMIDs |
| Page: 1 |

Copyright 2023-Present -The University of Texas Health Science Center at Houston |