
|
|||||
|
 | |
| |
| |
| |
| |
| |
|
Gene: NFRKB |
Gene summary for NFRKB |
| Gene information | Species | Human | Gene symbol | NFRKB | Gene ID | 4798 |
| Gene name | nuclear factor related to kappaB binding protein | |
| Gene Alias | INO80G | |
| Cytomap | 11q24.3 | |
| Gene Type | protein-coding | GO ID | GO:0006139 | UniProtAcc | A0A024R3K9 |
Top |
Malignant transformation analysis |
| Identification of the aberrant gene expression in precancerous and cancerous lesions by comparing the gene expression of stem-like cells in diseased tissues with normal stem cells |
| Entrez ID | Symbol | Replicates | Species | Organ | Tissue | Adj P-value | Log2FC | Malignancy |
| 4798 | NFRKB | LZE4T | Human | Esophagus | ESCC | 1.45e-03 | 5.03e-02 | 0.0811 |
| 4798 | NFRKB | LZE7T | Human | Esophagus | ESCC | 2.10e-06 | 2.16e-01 | 0.0667 |
| 4798 | NFRKB | LZE20T | Human | Esophagus | ESCC | 4.69e-02 | 8.47e-02 | 0.0662 |
| 4798 | NFRKB | LZE24T | Human | Esophagus | ESCC | 4.37e-16 | 3.19e-01 | 0.0596 |
| 4798 | NFRKB | P1T-E | Human | Esophagus | ESCC | 4.56e-04 | 1.76e-01 | 0.0875 |
| 4798 | NFRKB | P2T-E | Human | Esophagus | ESCC | 3.26e-06 | 5.38e-02 | 0.1177 |
| 4798 | NFRKB | P4T-E | Human | Esophagus | ESCC | 9.41e-16 | 3.69e-01 | 0.1323 |
| 4798 | NFRKB | P5T-E | Human | Esophagus | ESCC | 1.34e-08 | 1.19e-02 | 0.1327 |
| 4798 | NFRKB | P8T-E | Human | Esophagus | ESCC | 2.21e-14 | 4.73e-01 | 0.0889 |
| 4798 | NFRKB | P9T-E | Human | Esophagus | ESCC | 9.57e-12 | 1.13e-01 | 0.1131 |
| 4798 | NFRKB | P10T-E | Human | Esophagus | ESCC | 1.18e-13 | 1.60e-01 | 0.116 |
| 4798 | NFRKB | P12T-E | Human | Esophagus | ESCC | 1.04e-16 | 2.22e-01 | 0.1122 |
| 4798 | NFRKB | P15T-E | Human | Esophagus | ESCC | 8.88e-11 | 6.18e-02 | 0.1149 |
| 4798 | NFRKB | P16T-E | Human | Esophagus | ESCC | 4.14e-10 | 1.70e-01 | 0.1153 |
| 4798 | NFRKB | P17T-E | Human | Esophagus | ESCC | 9.82e-03 | 8.86e-02 | 0.1278 |
| 4798 | NFRKB | P20T-E | Human | Esophagus | ESCC | 3.86e-13 | 1.37e-01 | 0.1124 |
| 4798 | NFRKB | P21T-E | Human | Esophagus | ESCC | 9.42e-12 | 2.69e-01 | 0.1617 |
| 4798 | NFRKB | P22T-E | Human | Esophagus | ESCC | 1.07e-07 | 9.18e-03 | 0.1236 |
| 4798 | NFRKB | P23T-E | Human | Esophagus | ESCC | 2.22e-12 | 1.89e-01 | 0.108 |
| 4798 | NFRKB | P24T-E | Human | Esophagus | ESCC | 1.44e-10 | 3.78e-02 | 0.1287 |
| Page: 1 2 3 4 |
| Tissue | Expression Dynamics | Abbreviation |
| Esophagus | 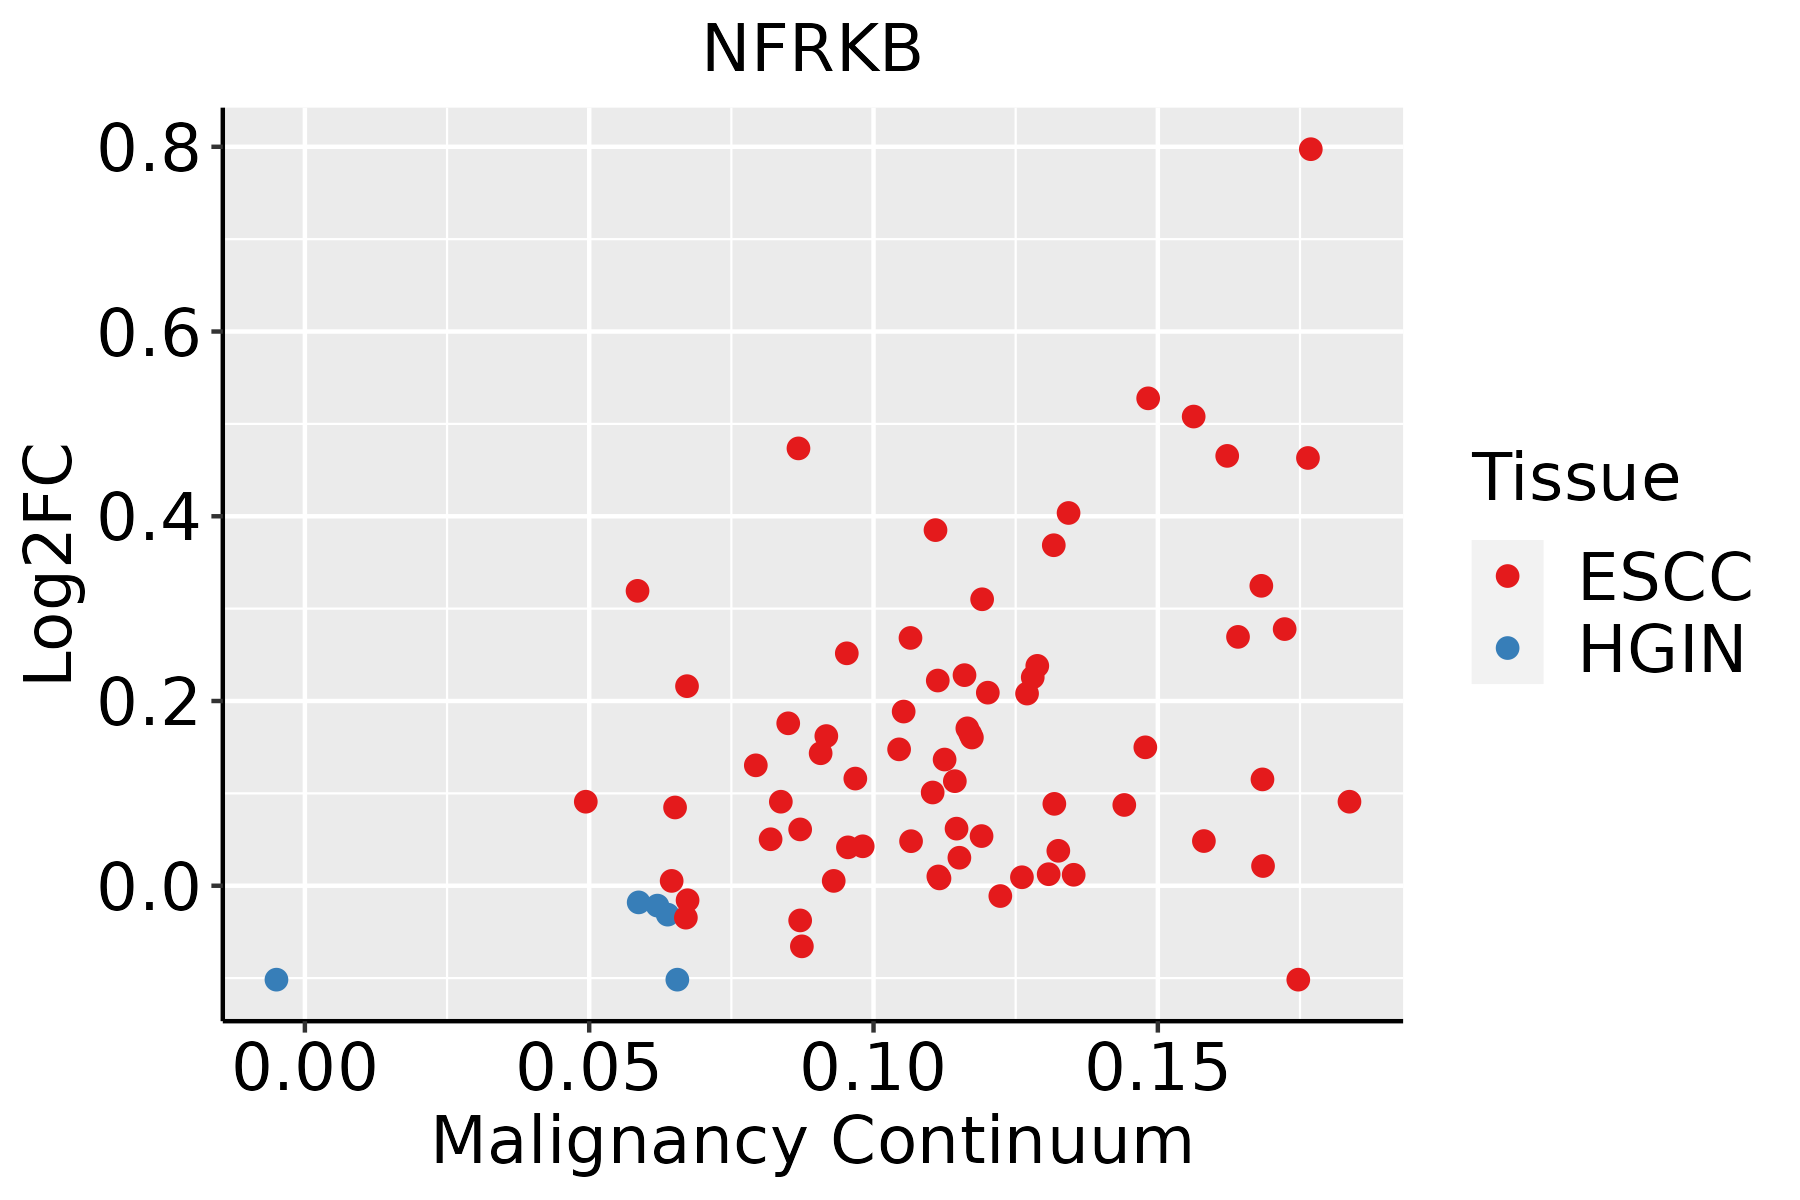 | ESCC: Esophageal squamous cell carcinoma |
| HGIN: High-grade intraepithelial neoplasias | ||
| LGIN: Low-grade intraepithelial neoplasias | ||
| Liver | 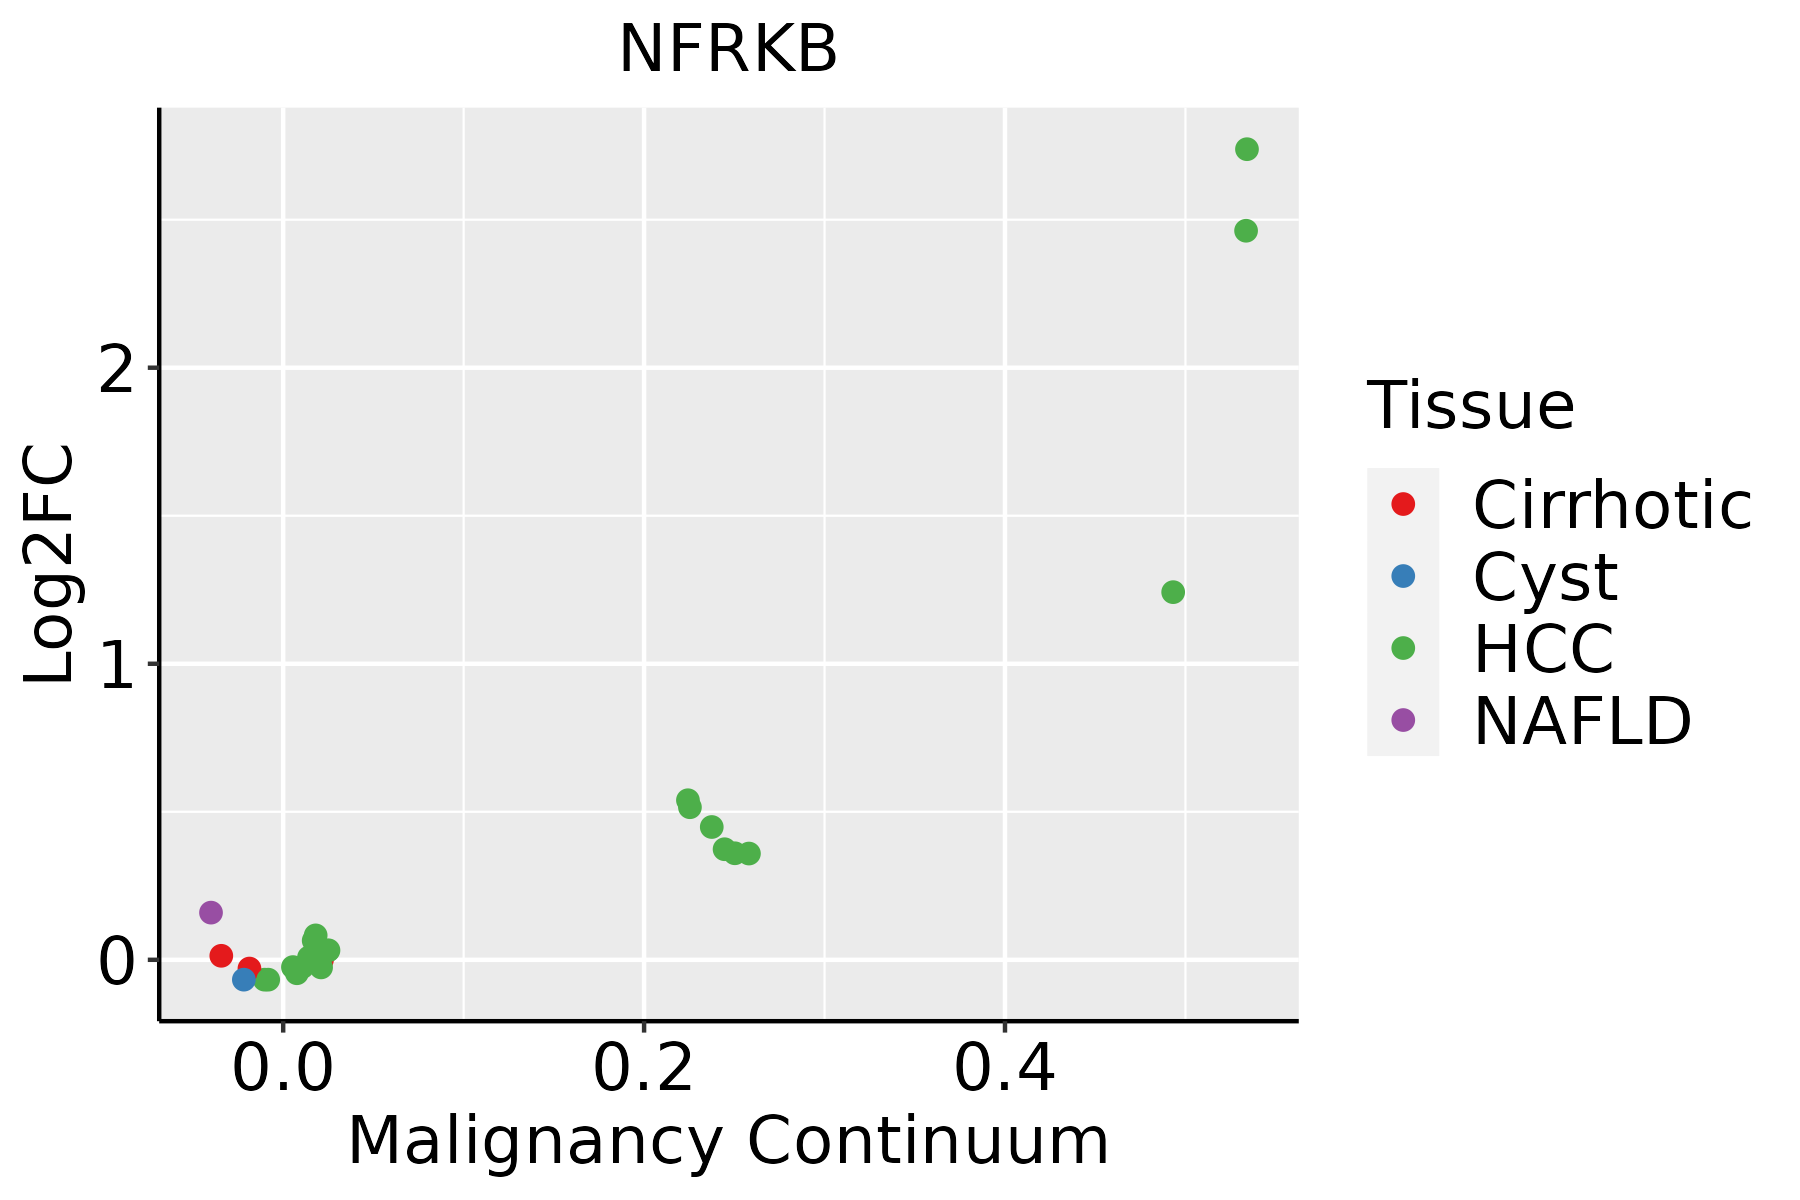 | HCC: Hepatocellular carcinoma |
| NAFLD: Non-alcoholic fatty liver disease | ||
| Oral Cavity |  | EOLP: Erosive Oral lichen planus |
| LP: leukoplakia | ||
| NEOLP: Non-erosive oral lichen planus | ||
| OSCC: Oral squamous cell carcinoma |
| ∗log2FC in expression of this searched gene in stem-like cells from each diseased tissue sample relative to stem-like cells in normal samples in each tissue plotted against the malignancy continuum. Samples are colored based on if they are from different disease stage. |
Top |
Malignant transformation related pathway analysis |
| Find out the enriched GO biological processes and KEGG pathways involved in transition from healthy to precancer to cancer |
| Tissue | Disease Stage | Enriched GO biological Processes |
| Colorectum | AD |  |
| Colorectum | SER |  |
| Colorectum | MSS |  |
| Colorectum | MSI-H |  |
| Colorectum | FAP |  |
| ∗Top 15 enriched GO BP terms are showed in the bar plot of each disease state in each tissue. Each row represents a significant GO biological process which is colored according to the -log10(p.adjust). |
| Page: 1 2 3 4 5 6 7 8 9 |
| GO ID | Tissue | Disease Stage | Description | Gene Ratio | Bg Ratio | pvalue | p.adjust | Count |
| GO:00063101 | Esophagus | ESCC | DNA recombination | 168/8552 | 305/18723 | 5.58e-04 | 3.05e-03 | 168 |
| GO:0006310 | Oral cavity | OSCC | DNA recombination | 147/7305 | 305/18723 | 6.33e-04 | 3.56e-03 | 147 |
| Page: 1 |
| Pathway ID | Tissue | Disease Stage | Description | Gene Ratio | Bg Ratio | pvalue | p.adjust | qvalue | Count |
| Page: 1 |
Top |
Cell-cell communication analysis |
| Identification of potential cell-cell interactions between two cell types and their ligand-receptor pairs for different disease states |
| Ligand | Receptor | LRpair | Pathway | Tissue | Disease Stage |
| Page: 1 |
Top |
Single-cell gene regulatory network inference analysis |
| Find out the significant the regulons (TFs) and the target genes of each regulon across cell types for different disease states |
| TF | Cell Type | Tissue | Disease Stage | Target Gene | RSS | Regulon Activity |
| ∗The dot plots of a searched regulon are shown for all cell subpopulations in each disease state of each tissue based on the regulon specific score inferred using pySCENIC and by calculating the average expression. |
| Page: 1 |
Top |
Somatic mutation of malignant transformation related genes |
| Annotation of somatic variants for genes involved in malignant transformation |
| Hugo Symbol | Variant Class | Variant Classification | dbSNP RS | HGVSc | HGVSp | HGVSp Short | SWISSPROT | BIOTYPE | SIFT | PolyPhen | Tumor Sample Barcode | Tissue | Histology | Sex | Age | Stage | Therapy Types | Drugs | Outcome |
| NFRKB | SNV | Missense_Mutation | c.1153G>A | p.Glu385Lys | p.E385K | Q6P4R8 | protein_coding | deleterious(0.01) | probably_damaging(0.987) | TCGA-A2-A0CP-01 | Breast | breast invasive carcinoma | Female | <65 | I/II | Chemotherapy | cytoxan | SD | |
| NFRKB | SNV | Missense_Mutation | novel | c.3265N>A | p.Leu1089Ile | p.L1089I | Q6P4R8 | protein_coding | deleterious_low_confidence(0) | probably_damaging(0.994) | TCGA-AN-A046-01 | Breast | breast invasive carcinoma | Female | >=65 | I/II | Unknown | Unknown | SD |
| NFRKB | SNV | Missense_Mutation | rs777665064 | c.878N>A | p.Arg293Gln | p.R293Q | Q6P4R8 | protein_coding | deleterious(0) | probably_damaging(0.996) | TCGA-AN-A0AK-01 | Breast | breast invasive carcinoma | Female | >=65 | I/II | Unknown | Unknown | SD |
| NFRKB | SNV | Missense_Mutation | novel | c.1634N>G | p.Val545Gly | p.V545G | Q6P4R8 | protein_coding | tolerated(0.07) | probably_damaging(0.973) | TCGA-AN-A0FX-01 | Breast | breast invasive carcinoma | Female | <65 | I/II | Unknown | Unknown | SD |
| NFRKB | SNV | Missense_Mutation | c.748N>T | p.Arg250Cys | p.R250C | Q6P4R8 | protein_coding | tolerated(0.06) | benign(0.003) | TCGA-AN-A0FY-01 | Breast | breast invasive carcinoma | Female | <65 | I/II | Unknown | Unknown | SD | |
| NFRKB | SNV | Missense_Mutation | c.3487N>A | p.Val1163Met | p.V1163M | Q6P4R8 | protein_coding | deleterious_low_confidence(0.04) | benign(0.022) | TCGA-EW-A1IZ-01 | Breast | breast invasive carcinoma | Female | <65 | III/IV | Chemotherapy | taxotere | SD | |
| NFRKB | SNV | Missense_Mutation | rs752173923 | c.814N>A | p.Ala272Thr | p.A272T | Q6P4R8 | protein_coding | tolerated(0.29) | benign(0.003) | TCGA-OL-A5RW-01 | Breast | breast invasive carcinoma | Female | <65 | I/II | Chemotherapy | adriamycin | CR |
| NFRKB | insertion | Nonsense_Mutation | novel | c.3130_3131insAGTGAAGTTGAGTATCCATT | p.Ala1044GlufsTer2 | p.A1044Efs*2 | Q6P4R8 | protein_coding | TCGA-A2-A0CU-01 | Breast | breast invasive carcinoma | Female | >=65 | I/II | Hormone Therapy | tamoxiphen | SD | ||
| NFRKB | deletion | Frame_Shift_Del | novel | c.3481delN | p.Ala1161LeufsTer7 | p.A1161Lfs*7 | Q6P4R8 | protein_coding | TCGA-D8-A27V-01 | Breast | breast invasive carcinoma | Female | <65 | I/II | Hormone Therapy | tamoxiphen | SD | ||
| NFRKB | SNV | Missense_Mutation | novel | c.2180N>A | p.Pro727His | p.P727H | Q6P4R8 | protein_coding | deleterious(0.02) | benign(0.346) | TCGA-2W-A8YY-01 | Cervix | cervical & endocervical cancer | Female | <65 | I/II | Chemotherapy | cisplatin | CR |
| Page: 1 2 3 4 5 6 7 8 9 10 11 12 |
Top |
Related drugs of malignant transformation related genes |
| Identification of chemicals and drugs interact with genes involved in malignant transfromation |
| (DGIdb 4.0) |
| Entrez ID | Symbol | Category | Interaction Types | Drug Claim Name | Drug Name | PMIDs |
| Page: 1 |

Copyright 2023-Present -The University of Texas Health Science Center at Houston |