| GO ID | Tissue | Disease Stage | Description | Gene Ratio | Bg Ratio | pvalue | p.adjust | Count |
| GO:0045185111 | Esophagus | ESCC | maintenance of protein location | 71/8552 | 94/18723 | 3.41e-09 | 7.24e-08 | 71 |
| GO:0051235110 | Esophagus | ESCC | maintenance of location | 200/8552 | 327/18723 | 1.01e-08 | 2.02e-07 | 200 |
| GO:00510908 | Esophagus | ESCC | regulation of DNA-binding transcription factor activity | 252/8552 | 440/18723 | 5.22e-07 | 6.97e-06 | 252 |
| GO:005122013 | Esophagus | ESCC | cytoplasmic sequestering of protein | 18/8552 | 22/18723 | 5.69e-04 | 3.10e-03 | 18 |
| GO:00434332 | Esophagus | ESCC | negative regulation of DNA-binding transcription factor activity | 103/8552 | 185/18723 | 3.86e-03 | 1.57e-02 | 103 |
| GO:00429943 | Esophagus | ESCC | cytoplasmic sequestering of transcription factor | 12/8552 | 15/18723 | 7.31e-03 | 2.63e-02 | 12 |
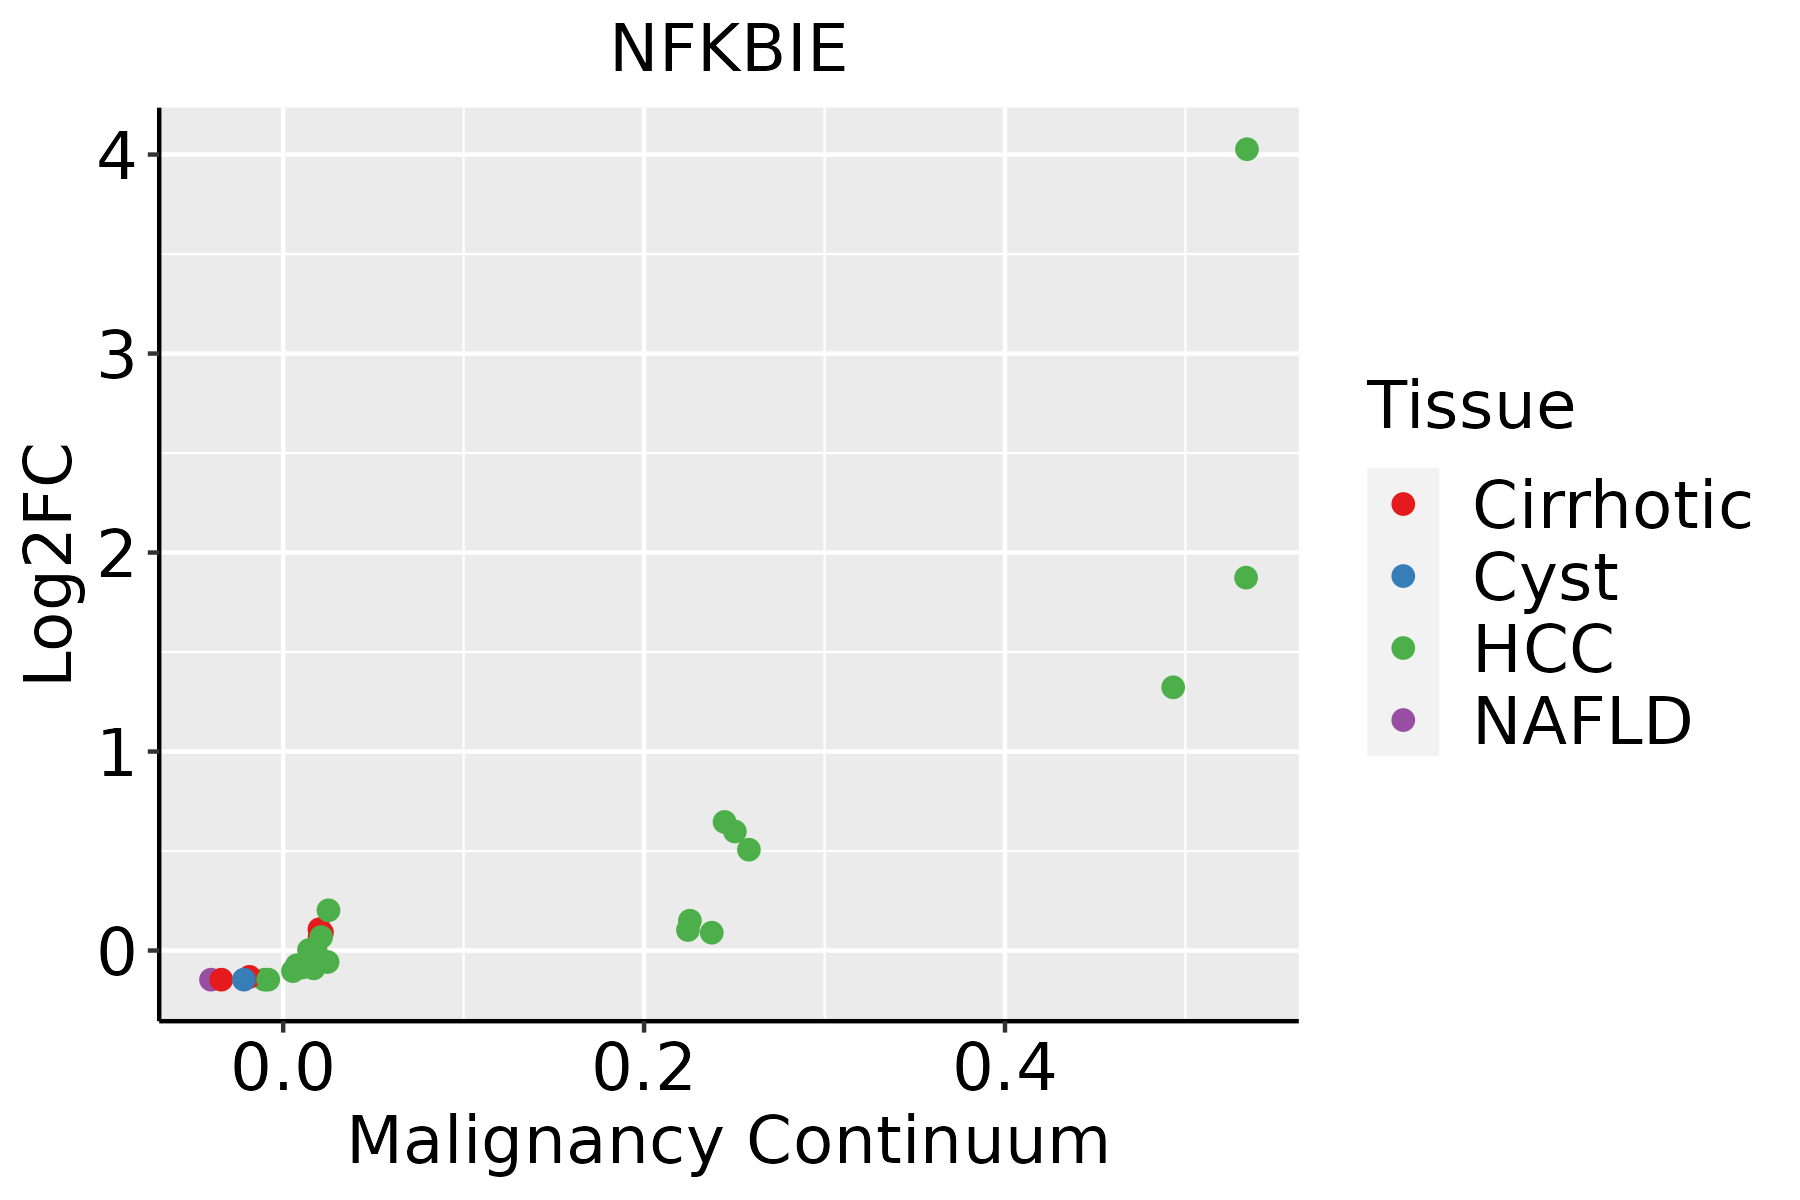
| GO:00451857 | Liver | Cirrhotic | maintenance of protein location | 46/4634 | 94/18723 | 3.31e-07 | 7.90e-06 | 46 |
| GO:005123511 | Liver | Cirrhotic | maintenance of location | 117/4634 | 327/18723 | 4.78e-06 | 7.86e-05 | 117 |
| GO:00512202 | Liver | Cirrhotic | cytoplasmic sequestering of protein | 13/4634 | 22/18723 | 6.27e-04 | 4.80e-03 | 13 |
| GO:0042994 | Liver | Cirrhotic | cytoplasmic sequestering of transcription factor | 9/4634 | 15/18723 | 3.88e-03 | 2.10e-02 | 9 |
| GO:005123521 | Liver | HCC | maintenance of location | 185/7958 | 327/18723 | 1.70e-07 | 3.12e-06 | 185 |
| GO:005122011 | Liver | HCC | cytoplasmic sequestering of protein | 20/7958 | 22/18723 | 3.00e-06 | 3.98e-05 | 20 |
| GO:004518512 | Liver | HCC | maintenance of protein location | 61/7958 | 94/18723 | 9.61e-06 | 1.12e-04 | 61 |
| GO:00429941 | Liver | HCC | cytoplasmic sequestering of transcription factor | 14/7958 | 15/18723 | 5.65e-05 | 5.26e-04 | 14 |
| GO:00510902 | Liver | HCC | regulation of DNA-binding transcription factor activity | 220/7958 | 440/18723 | 8.04e-04 | 4.82e-03 | 220 |
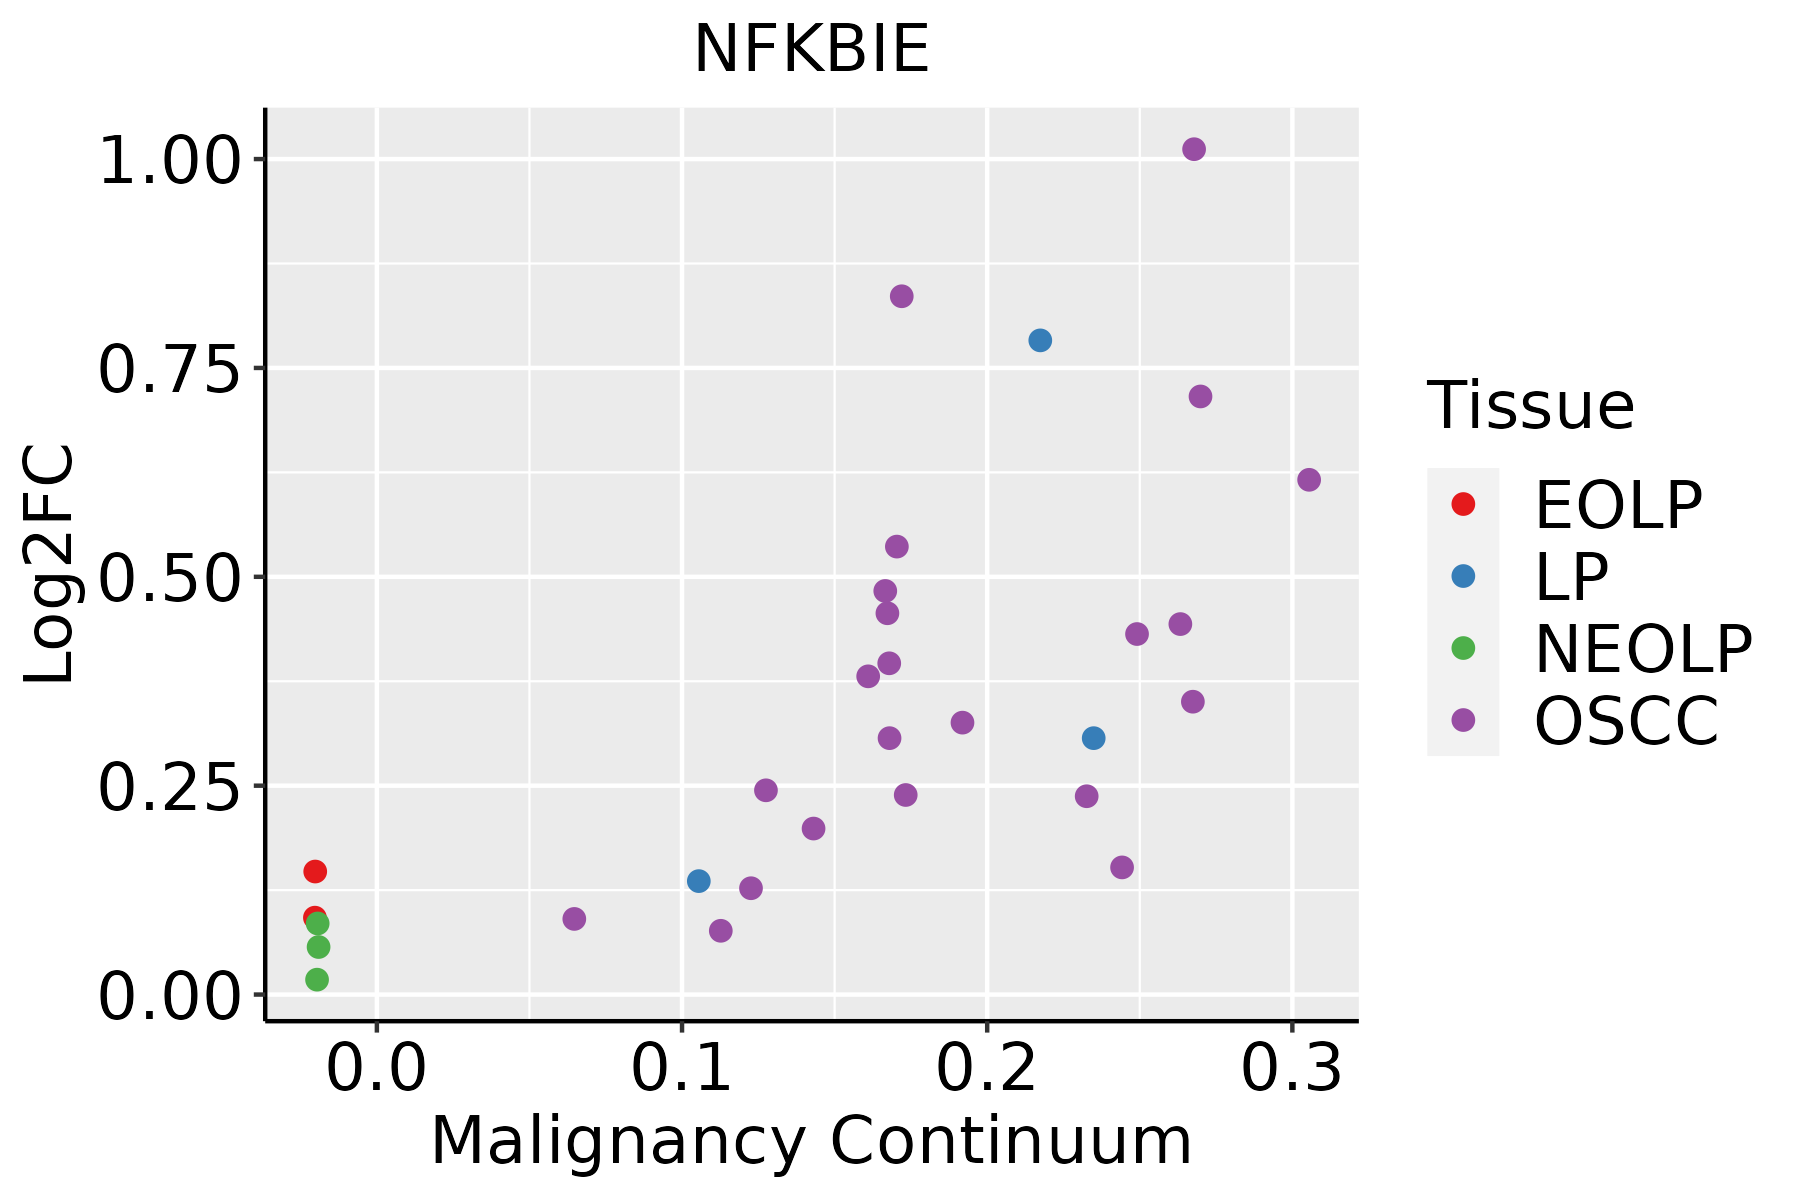
| GO:005123518 | Oral cavity | OSCC | maintenance of location | 182/7305 | 327/18723 | 6.16e-10 | 1.58e-08 | 182 |
| GO:004518520 | Oral cavity | OSCC | maintenance of protein location | 65/7305 | 94/18723 | 3.00e-09 | 6.88e-08 | 65 |
| GO:00510907 | Oral cavity | OSCC | regulation of DNA-binding transcription factor activity | 221/7305 | 440/18723 | 9.06e-07 | 1.23e-05 | 221 |
| GO:00512204 | Oral cavity | OSCC | cytoplasmic sequestering of protein | 15/7305 | 22/18723 | 5.34e-03 | 2.07e-02 | 15 |
| GO:00429942 | Oral cavity | OSCC | cytoplasmic sequestering of transcription factor | 11/7305 | 15/18723 | 7.49e-03 | 2.75e-02 | 11 |
| Pathway ID | Tissue | Disease Stage | Description | Gene Ratio | Bg Ratio | pvalue | p.adjust | qvalue | Count |
| hsa05169210 | Esophagus | ESCC | Epstein-Barr virus infection | 151/4205 | 202/8465 | 1.55e-13 | 3.45e-12 | 1.77e-12 | 151 |
| hsa0472225 | Esophagus | ESCC | Neurotrophin signaling pathway | 80/4205 | 119/8465 | 7.33e-05 | 3.07e-04 | 1.57e-04 | 80 |
| hsa052356 | Esophagus | ESCC | PD-L1 expression and PD-1 checkpoint pathway in cancer | 58/4205 | 89/8465 | 2.19e-03 | 6.16e-03 | 3.16e-03 | 58 |
| hsa046599 | Esophagus | ESCC | Th17 cell differentiation | 68/4205 | 108/8465 | 3.53e-03 | 9.30e-03 | 4.76e-03 | 68 |
| hsa046585 | Esophagus | ESCC | Th1 and Th2 cell differentiation | 58/4205 | 92/8465 | 6.49e-03 | 1.60e-02 | 8.19e-03 | 58 |
| hsa046607 | Esophagus | ESCC | T cell receptor signaling pathway | 63/4205 | 104/8465 | 1.60e-02 | 3.60e-02 | 1.84e-02 | 63 |
| hsa0516937 | Esophagus | ESCC | Epstein-Barr virus infection | 151/4205 | 202/8465 | 1.55e-13 | 3.45e-12 | 1.77e-12 | 151 |
| hsa04722111 | Esophagus | ESCC | Neurotrophin signaling pathway | 80/4205 | 119/8465 | 7.33e-05 | 3.07e-04 | 1.57e-04 | 80 |
| hsa0523511 | Esophagus | ESCC | PD-L1 expression and PD-1 checkpoint pathway in cancer | 58/4205 | 89/8465 | 2.19e-03 | 6.16e-03 | 3.16e-03 | 58 |
| hsa0465914 | Esophagus | ESCC | Th17 cell differentiation | 68/4205 | 108/8465 | 3.53e-03 | 9.30e-03 | 4.76e-03 | 68 |
| hsa0465812 | Esophagus | ESCC | Th1 and Th2 cell differentiation | 58/4205 | 92/8465 | 6.49e-03 | 1.60e-02 | 8.19e-03 | 58 |
| hsa0466013 | Esophagus | ESCC | T cell receptor signaling pathway | 63/4205 | 104/8465 | 1.60e-02 | 3.60e-02 | 1.84e-02 | 63 |
| hsa0516914 | Liver | Cirrhotic | Epstein-Barr virus infection | 80/2530 | 202/8465 | 1.80e-03 | 8.33e-03 | 5.13e-03 | 80 |
| hsa0516915 | Liver | Cirrhotic | Epstein-Barr virus infection | 80/2530 | 202/8465 | 1.80e-03 | 8.33e-03 | 5.13e-03 | 80 |
| hsa0516921 | Liver | HCC | Epstein-Barr virus infection | 128/4020 | 202/8465 | 3.17e-06 | 2.79e-05 | 1.55e-05 | 128 |
| hsa0472210 | Liver | HCC | Neurotrophin signaling pathway | 74/4020 | 119/8465 | 8.27e-04 | 3.26e-03 | 1.81e-03 | 74 |
| hsa049202 | Liver | HCC | Adipocytokine signaling pathway | 45/4020 | 69/8465 | 2.19e-03 | 7.55e-03 | 4.20e-03 | 45 |
| hsa0516931 | Liver | HCC | Epstein-Barr virus infection | 128/4020 | 202/8465 | 3.17e-06 | 2.79e-05 | 1.55e-05 | 128 |
| hsa0472211 | Liver | HCC | Neurotrophin signaling pathway | 74/4020 | 119/8465 | 8.27e-04 | 3.26e-03 | 1.81e-03 | 74 |
| hsa049203 | Liver | HCC | Adipocytokine signaling pathway | 45/4020 | 69/8465 | 2.19e-03 | 7.55e-03 | 4.20e-03 | 45 |
| Hugo Symbol | Variant Class | Variant Classification | dbSNP RS | HGVSc | HGVSp | HGVSp Short | SWISSPROT | BIOTYPE | SIFT | PolyPhen | Tumor Sample Barcode | Tissue | Histology | Sex | Age | Stage | Therapy Types | Drugs | Outcome |
| NFKBIE | SNV | Missense_Mutation | rs768072245 | c.704N>C | p.Arg235Pro | p.R235P | O00221 | protein_coding | tolerated(0.19) | benign(0.077) | TCGA-A2-A04Q-01 | Breast | breast invasive carcinoma | Female | <65 | I/II | Chemotherapy | adriamycin | SD |
| NFKBIE | SNV | Missense_Mutation | | c.1498N>C | p.Asp500His | p.D500H | O00221 | protein_coding | deleterious_low_confidence(0) | possibly_damaging(0.597) | TCGA-A8-A097-01 | Breast | breast invasive carcinoma | Female | >=65 | I/II | Hormone Therapy | tamoxiphen | SD |
| NFKBIE | SNV | Missense_Mutation | rs768072245 | c.704G>C | p.Arg235Pro | p.R235P | O00221 | protein_coding | tolerated(0.19) | benign(0.077) | TCGA-BH-A0DL-01 | Breast | breast invasive carcinoma | Female | <65 | I/II | Chemotherapy | cytoxan | CR |
| NFKBIE | SNV | Missense_Mutation | rs768072245 | c.704G>C | p.Arg235Pro | p.R235P | O00221 | protein_coding | tolerated(0.19) | benign(0.077) | TCGA-C8-A133-01 | Breast | breast invasive carcinoma | Female | >=65 | III/IV | Unknown | Unknown | SD |
| NFKBIE | SNV | Missense_Mutation | novel | c.463T>C | p.Tyr155His | p.Y155H | O00221 | protein_coding | tolerated(0.2) | benign(0.275) | TCGA-GI-A2C9-01 | Breast | breast invasive carcinoma | Female | <65 | I/II | Unspecific | | SD |
| NFKBIE | SNV | Missense_Mutation | novel | c.1376C>T | p.Ala459Val | p.A459V | O00221 | protein_coding | tolerated(0.08) | probably_damaging(0.985) | TCGA-2W-A8YY-01 | Cervix | cervical & endocervical cancer | Female | <65 | I/II | Chemotherapy | cisplatin | CR |
| NFKBIE | SNV | Missense_Mutation | novel | c.113N>A | p.Arg38Gln | p.R38Q | O00221 | protein_coding | | benign(0.022) | TCGA-C5-A7CK-01 | Cervix | cervical & endocervical cancer | Female | <65 | I/II | Chemotherapy | cisplatin | SD |
| NFKBIE | SNV | Missense_Mutation | novel | c.445N>A | p.Glu149Lys | p.E149K | O00221 | protein_coding | deleterious(0.05) | benign(0.124) | TCGA-JW-A5VL-01 | Cervix | cervical & endocervical cancer | Female | <65 | I/II | Unknown | Unknown | SD |
| NFKBIE | SNV | Missense_Mutation | | c.1171N>T | p.Arg391Trp | p.R391W | O00221 | protein_coding | deleterious(0) | benign(0.417) | TCGA-AA-A010-01 | Colorectum | colon adenocarcinoma | Female | <65 | I/II | Chemotherapy | folinic | CR |
| NFKBIE | SNV | Missense_Mutation | | c.1171N>T | p.Arg391Trp | p.R391W | O00221 | protein_coding | deleterious(0) | benign(0.417) | TCGA-CA-6717-01 | Colorectum | colon adenocarcinoma | Male | <65 | I/II | Chemotherapy | oxaliplatin | CR |