
|
|||||
|
 | |
| |
| |
| |
| |
| |
|
Gene: NFKBIA |
Gene summary for NFKBIA |
| Gene information | Species | Human | Gene symbol | NFKBIA | Gene ID | 4792 |
| Gene name | NFKB inhibitor alpha | |
| Gene Alias | EDAID2 | |
| Cytomap | 14q13.2 | |
| Gene Type | protein-coding | GO ID | GO:0002221 | UniProtAcc | P25963 |
Top |
Malignant transformation analysis |
| Identification of the aberrant gene expression in precancerous and cancerous lesions by comparing the gene expression of stem-like cells in diseased tissues with normal stem cells |
| Entrez ID | Symbol | Replicates | Species | Organ | Tissue | Adj P-value | Log2FC | Malignancy |
| 4792 | NFKBIA | GSM4909280 | Human | Breast | Precancer | 1.32e-03 | 4.23e-01 | 0.0305 |
| 4792 | NFKBIA | GSM4909281 | Human | Breast | IDC | 3.69e-26 | -7.89e-01 | 0.21 |
| 4792 | NFKBIA | GSM4909282 | Human | Breast | IDC | 1.34e-06 | 3.33e-01 | -0.0288 |
| 4792 | NFKBIA | GSM4909285 | Human | Breast | IDC | 2.82e-25 | -6.38e-01 | 0.21 |
| 4792 | NFKBIA | GSM4909286 | Human | Breast | IDC | 1.79e-37 | -7.97e-01 | 0.1081 |
| 4792 | NFKBIA | GSM4909290 | Human | Breast | IDC | 4.11e-17 | -7.16e-01 | 0.2096 |
| 4792 | NFKBIA | GSM4909291 | Human | Breast | IDC | 1.33e-08 | -5.54e-01 | 0.1753 |
| 4792 | NFKBIA | GSM4909292 | Human | Breast | IDC | 1.08e-06 | -1.11e+00 | 0.1236 |
| 4792 | NFKBIA | GSM4909293 | Human | Breast | IDC | 1.38e-25 | -6.61e-01 | 0.1581 |
| 4792 | NFKBIA | GSM4909294 | Human | Breast | IDC | 6.86e-30 | -9.83e-01 | 0.2022 |
| 4792 | NFKBIA | GSM4909296 | Human | Breast | IDC | 2.01e-29 | -9.50e-01 | 0.1524 |
| 4792 | NFKBIA | GSM4909297 | Human | Breast | IDC | 5.99e-17 | -6.47e-01 | 0.1517 |
| 4792 | NFKBIA | GSM4909298 | Human | Breast | IDC | 4.02e-26 | -7.67e-01 | 0.1551 |
| 4792 | NFKBIA | GSM4909301 | Human | Breast | IDC | 5.37e-29 | -9.46e-01 | 0.1577 |
| 4792 | NFKBIA | GSM4909302 | Human | Breast | IDC | 3.19e-30 | -9.15e-01 | 0.1545 |
| 4792 | NFKBIA | GSM4909304 | Human | Breast | IDC | 1.15e-37 | -1.05e+00 | 0.1636 |
| 4792 | NFKBIA | GSM4909305 | Human | Breast | IDC | 4.53e-02 | 2.16e-02 | 0.0436 |
| 4792 | NFKBIA | GSM4909306 | Human | Breast | IDC | 2.49e-14 | -4.97e-01 | 0.1564 |
| 4792 | NFKBIA | GSM4909307 | Human | Breast | IDC | 9.94e-20 | -7.71e-01 | 0.1569 |
| 4792 | NFKBIA | GSM4909308 | Human | Breast | IDC | 1.33e-07 | -8.01e-02 | 0.158 |
| Page: 1 2 3 4 5 6 7 8 9 10 11 12 13 14 15 |
| Tissue | Expression Dynamics | Abbreviation |
| Breast | 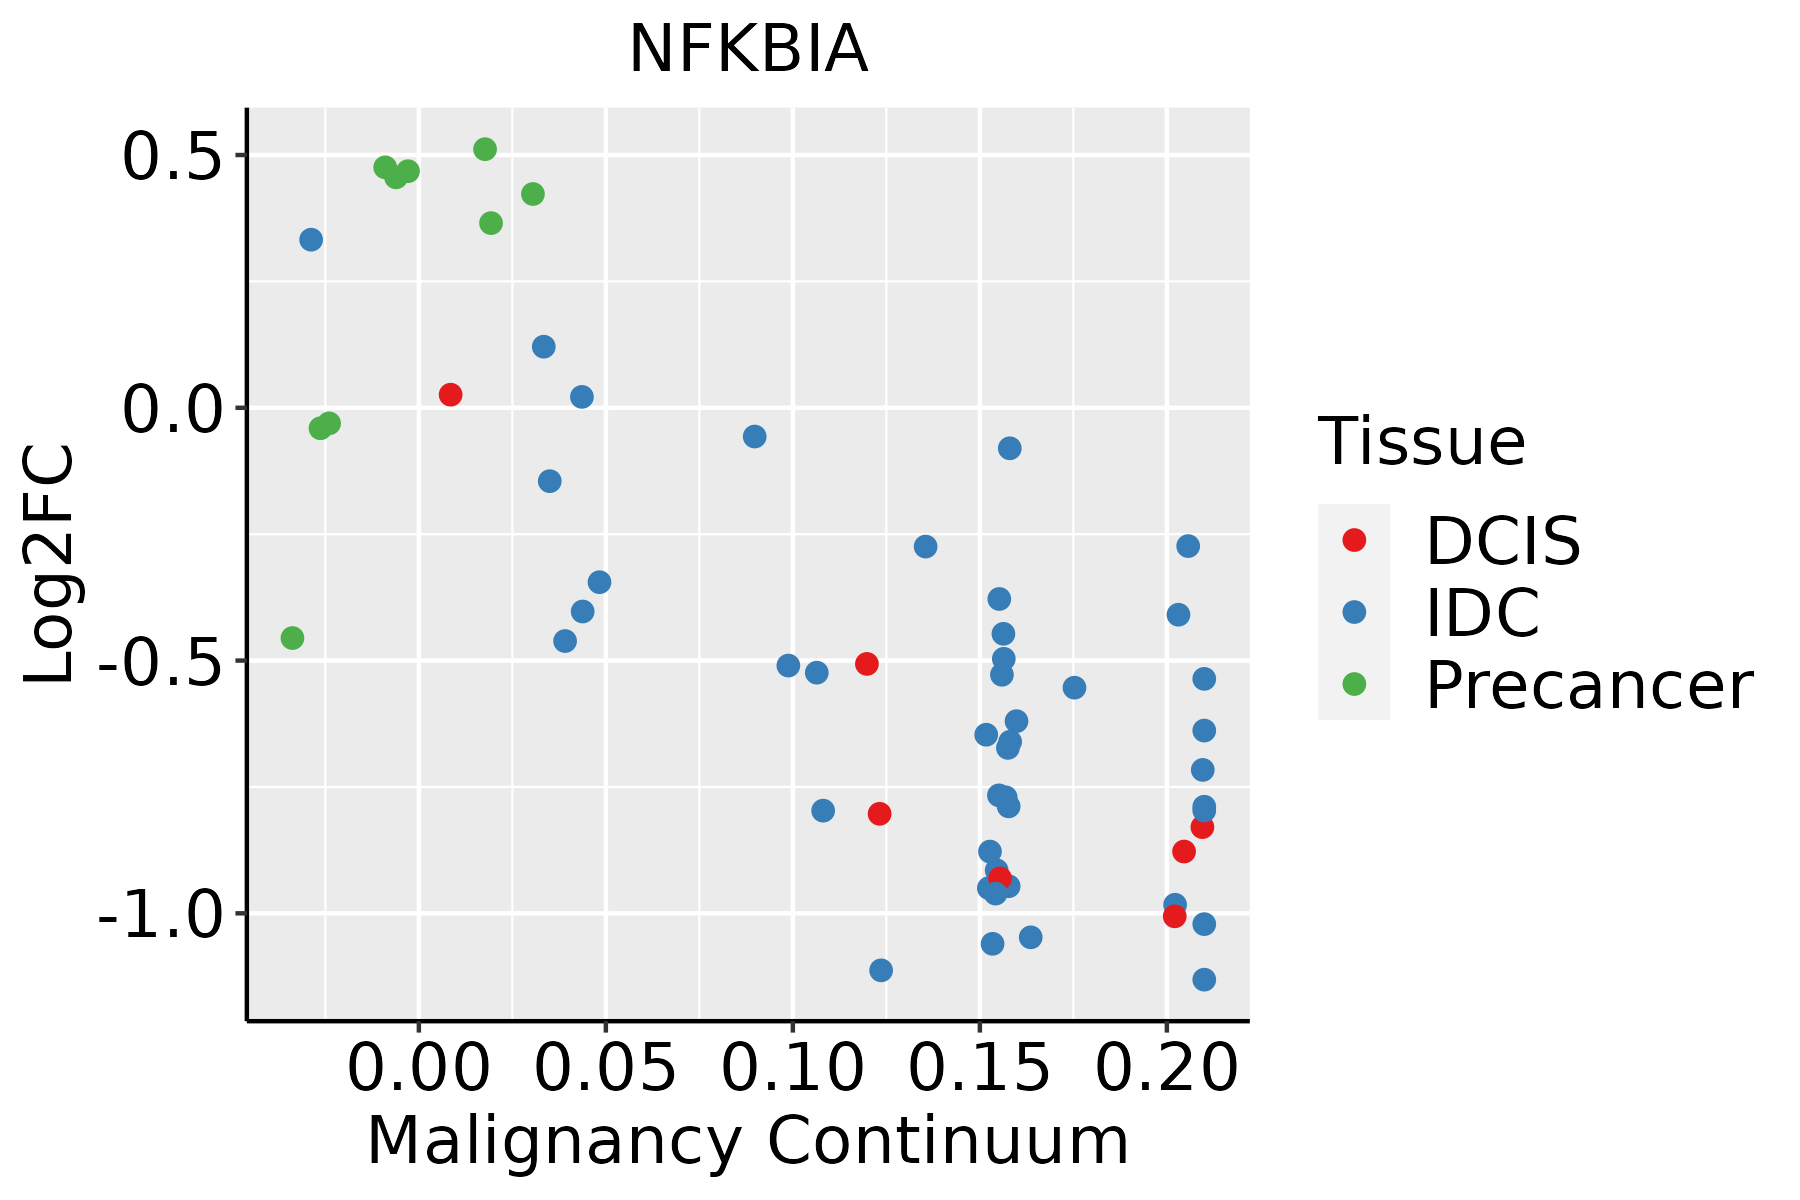 | IDC: Invasive ductal carcinoma |
| DCIS: Ductal carcinoma in situ | ||
| Precancer(BRCA1-mut): Precancerous lesion from BRCA1 mutation carriers | ||
| Cervix | 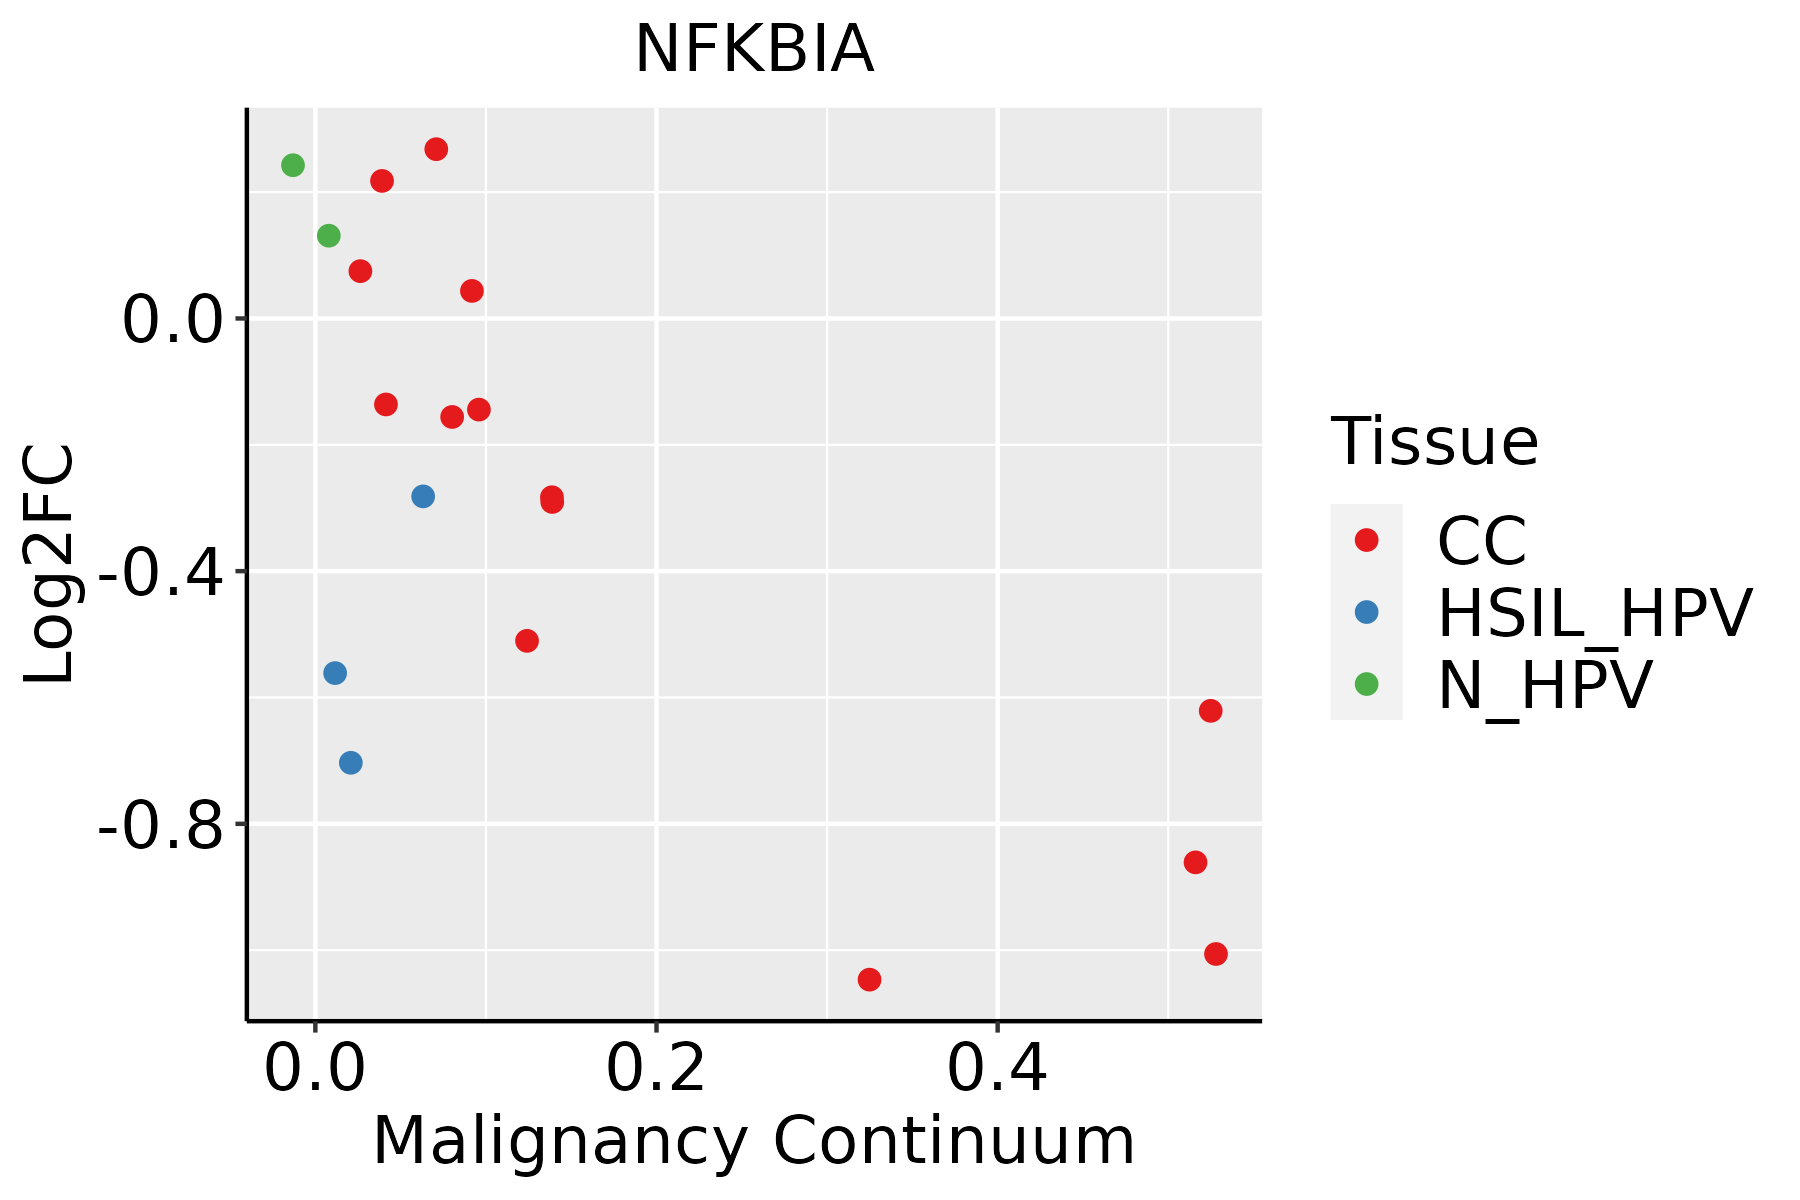 | CC: Cervix cancer |
| HSIL_HPV: HPV-infected high-grade squamous intraepithelial lesions | ||
| N_HPV: HPV-infected normal cervix | ||
| Colorectum (GSE201348) |  | FAP: Familial adenomatous polyposis |
| CRC: Colorectal cancer | ||
| Colorectum (HTA11) |  | AD: Adenomas |
| SER: Sessile serrated lesions | ||
| MSI-H: Microsatellite-high colorectal cancer | ||
| MSS: Microsatellite stable colorectal cancer | ||
| Endometrium | 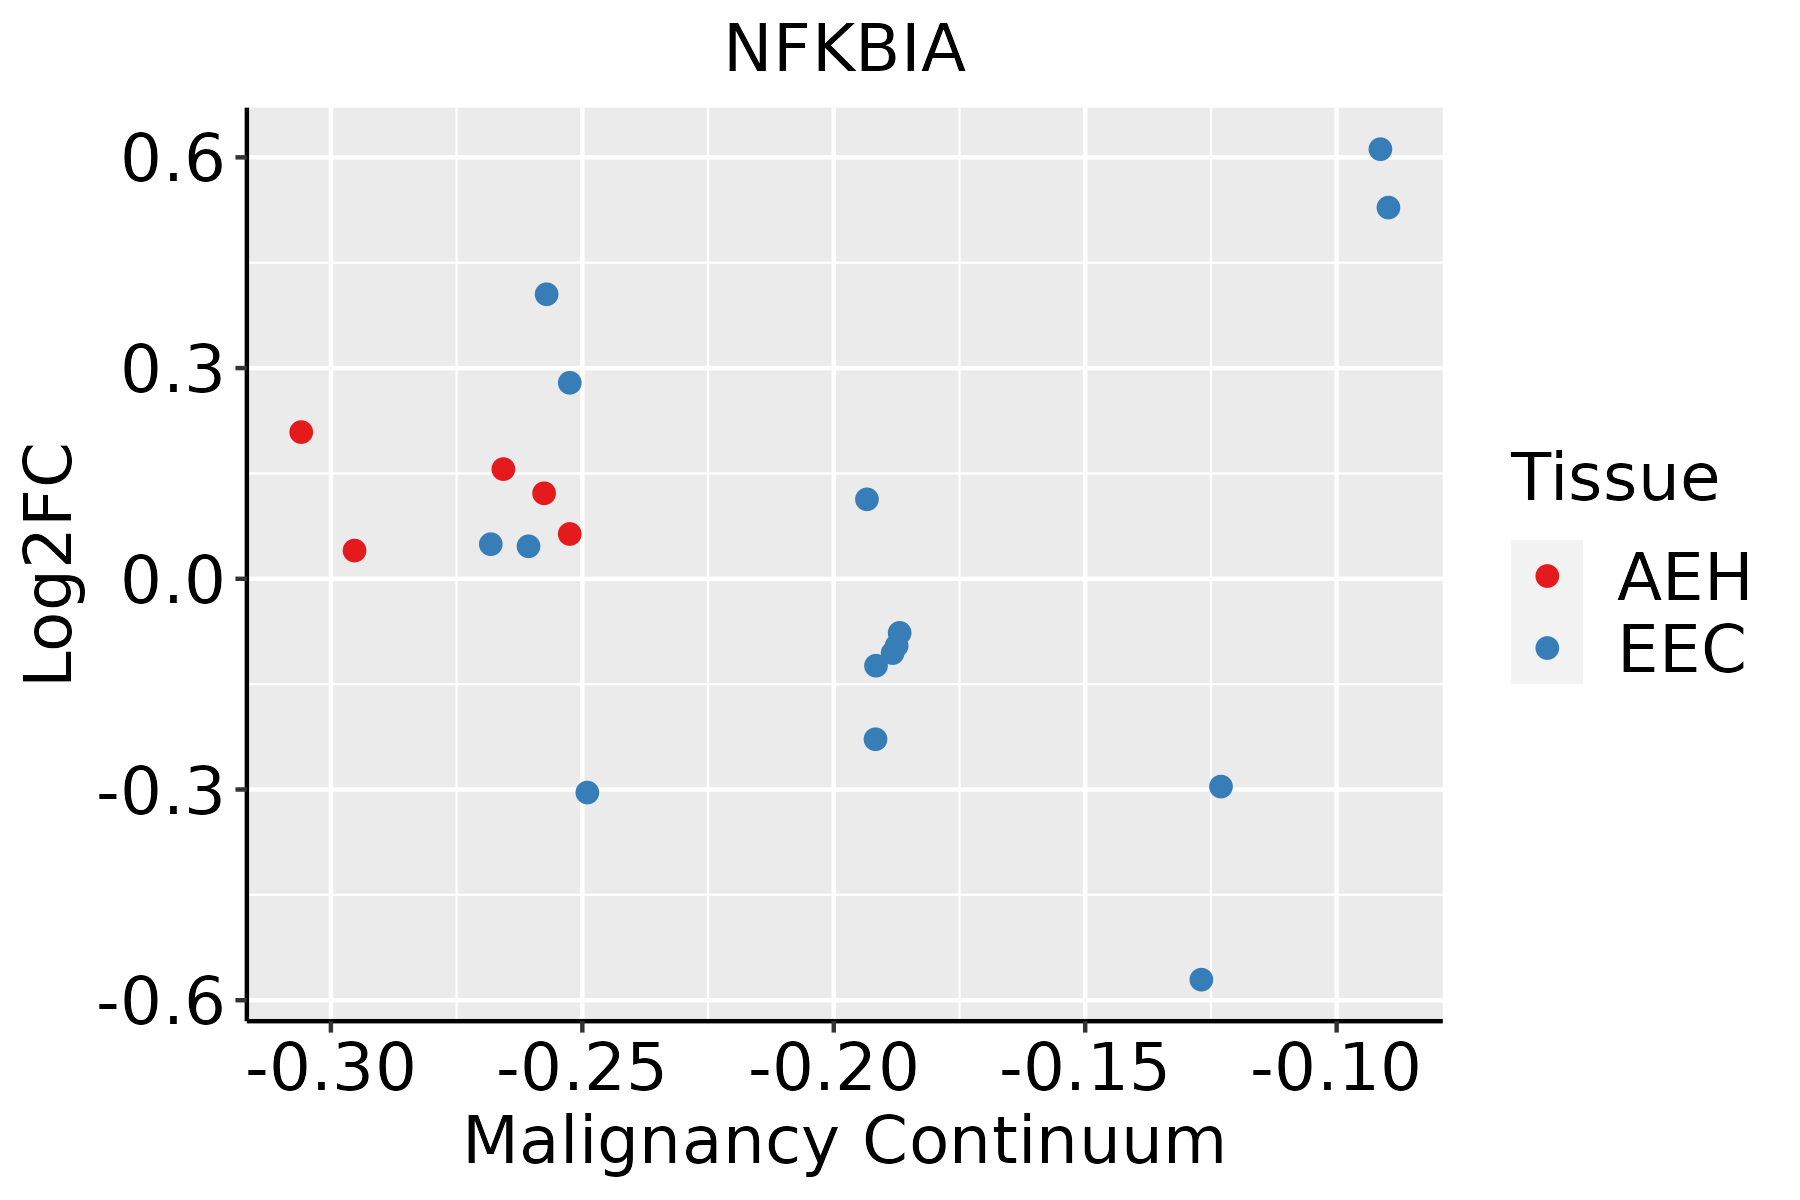 | AEH: Atypical endometrial hyperplasia |
| EEC: Endometrioid Cancer | ||
| Esophagus | 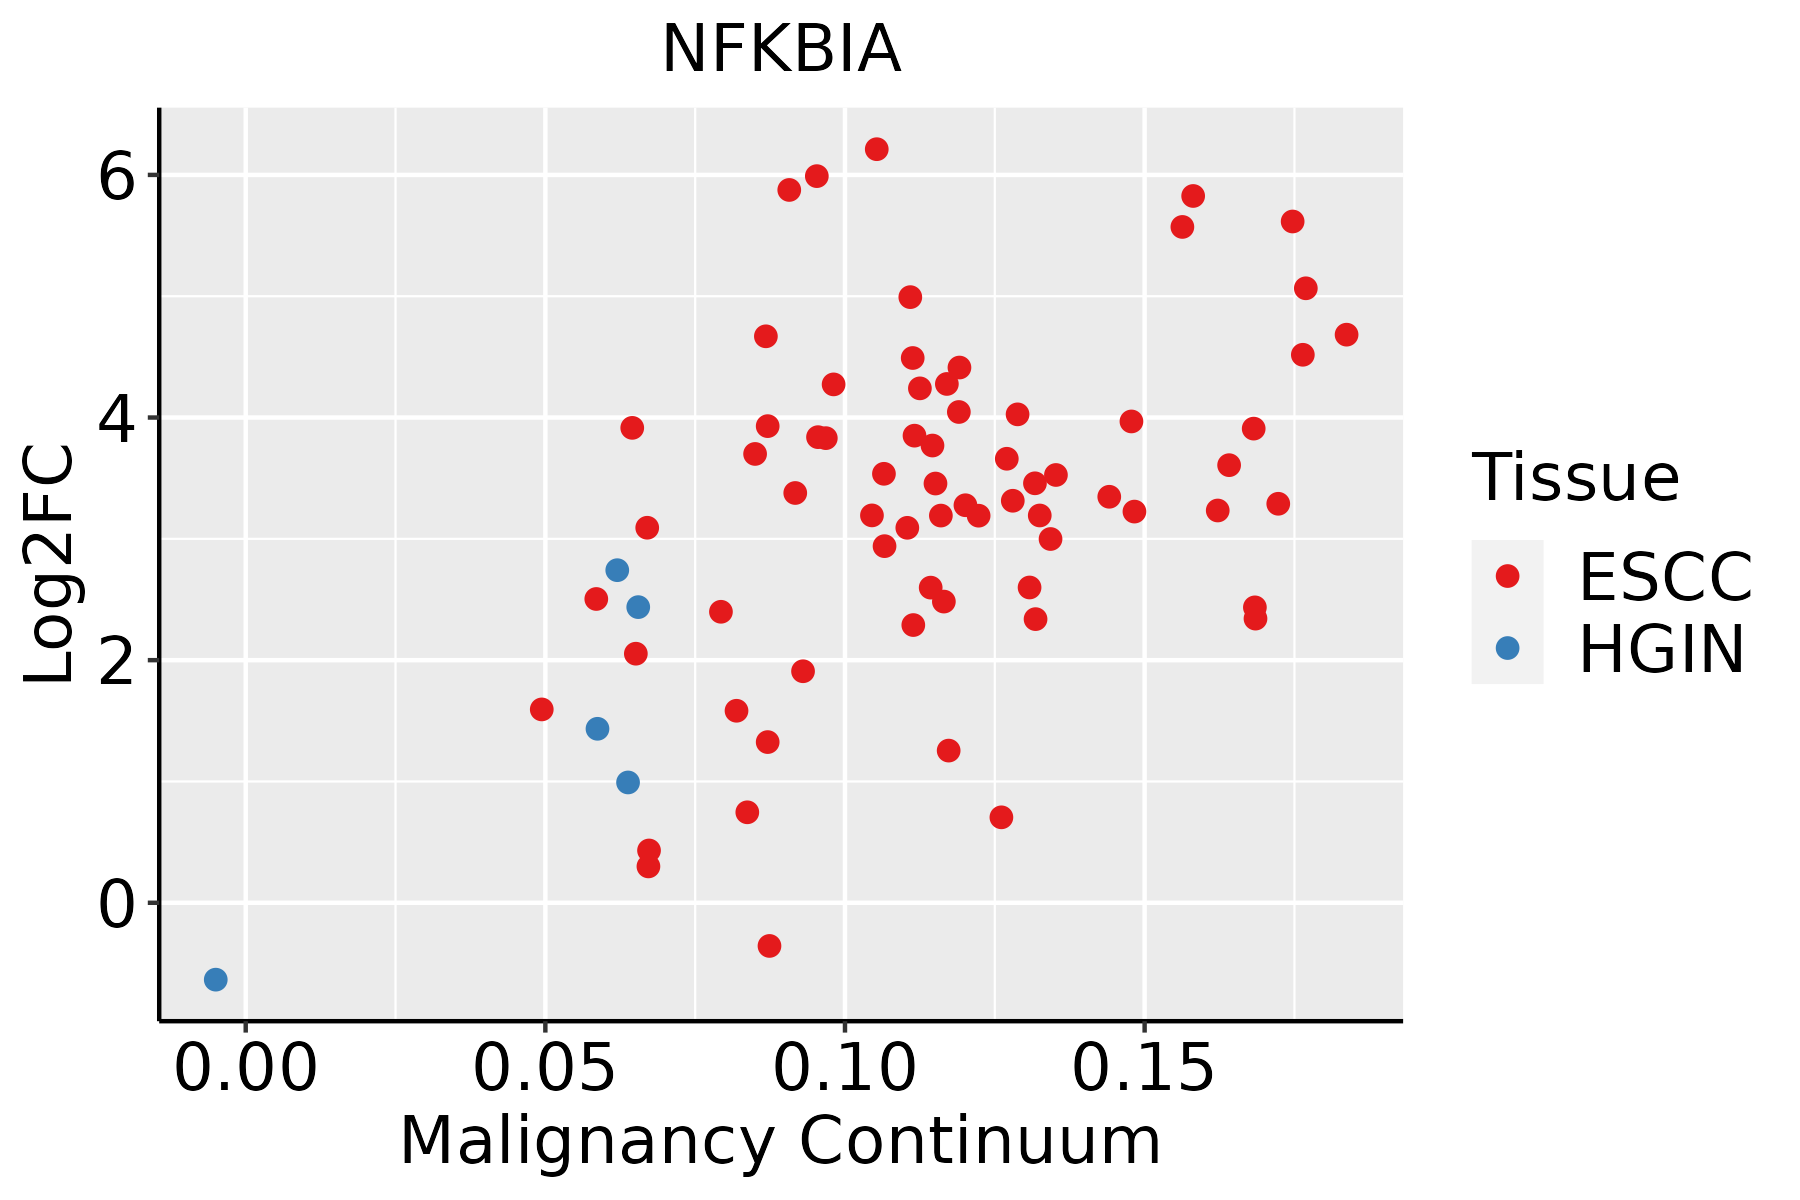 | ESCC: Esophageal squamous cell carcinoma |
| HGIN: High-grade intraepithelial neoplasias | ||
| LGIN: Low-grade intraepithelial neoplasias | ||
| GC |  | CAG: Chronic atrophic gastritis |
| CAG with IM: Chronic atrophic gastritis with intestinal metaplasia | ||
| CSG: Chronic superficial gastritis | ||
| GC: Gastric cancer | ||
| SIM: Severe intestinal metaplasia | ||
| WIM: Wild intestinal metaplasia | ||
| Liver | 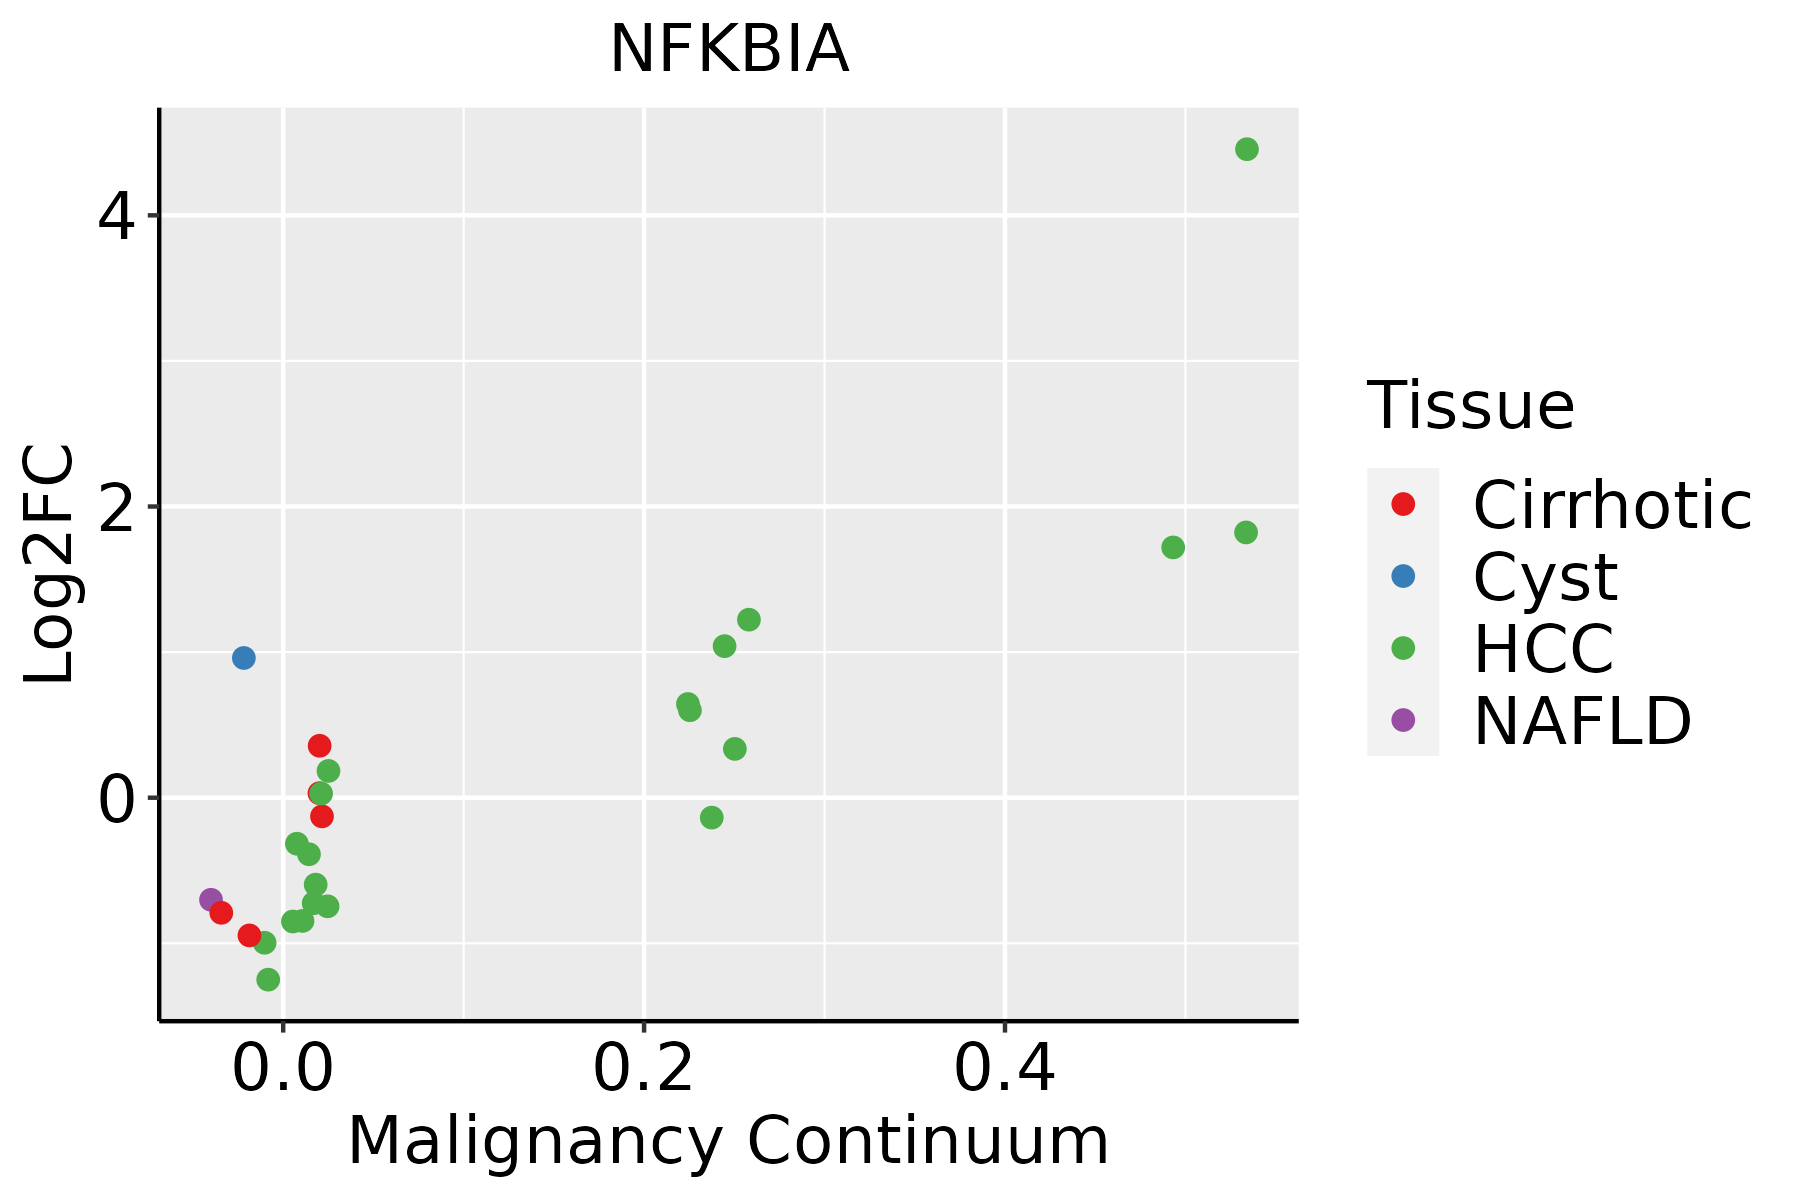 | HCC: Hepatocellular carcinoma |
| NAFLD: Non-alcoholic fatty liver disease | ||
| Lung |  | AAH: Atypical adenomatous hyperplasia |
| AIS: Adenocarcinoma in situ | ||
| IAC: Invasive lung adenocarcinoma | ||
| MIA: Minimally invasive adenocarcinoma | ||
| Oral Cavity |  | EOLP: Erosive Oral lichen planus |
| LP: leukoplakia | ||
| NEOLP: Non-erosive oral lichen planus | ||
| OSCC: Oral squamous cell carcinoma | ||
| Prostate | 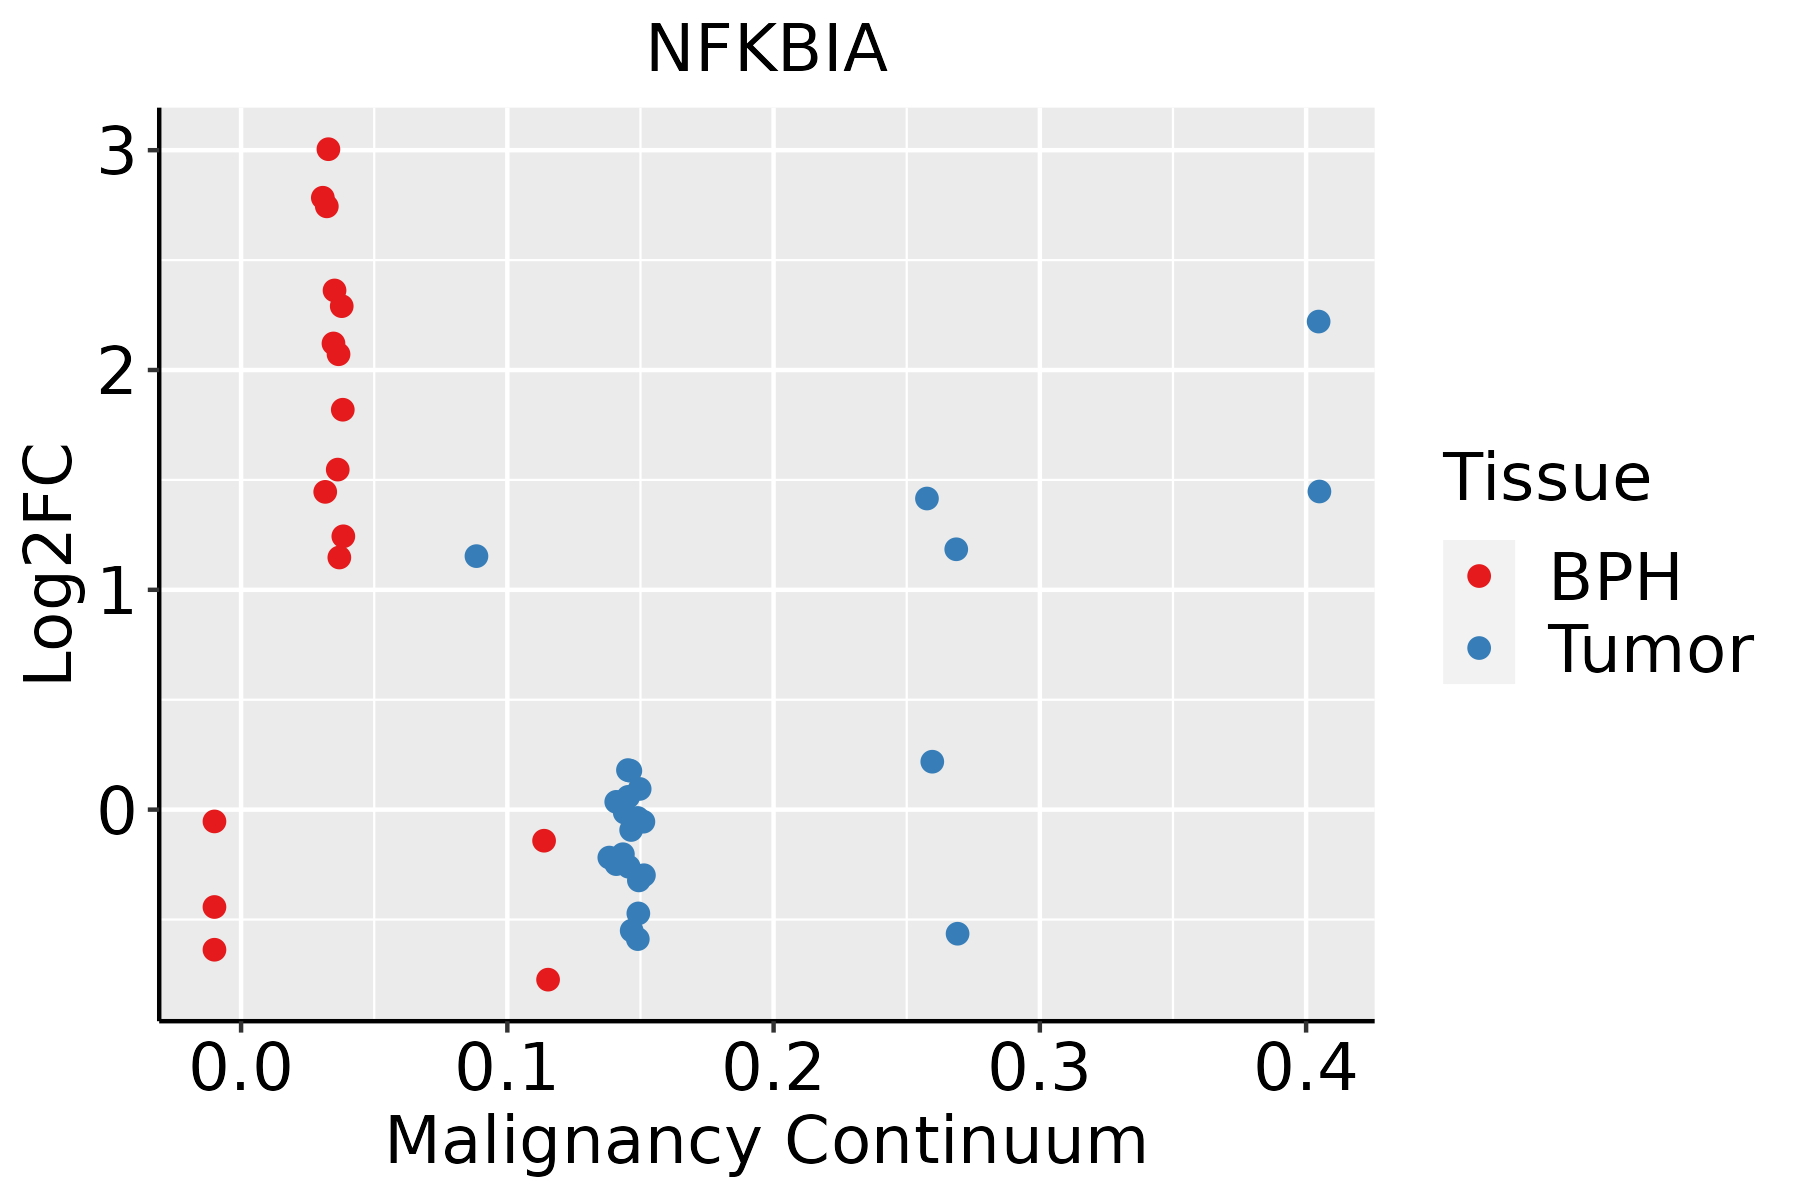 | BPH: Benign Prostatic Hyperplasia |
| Skin | 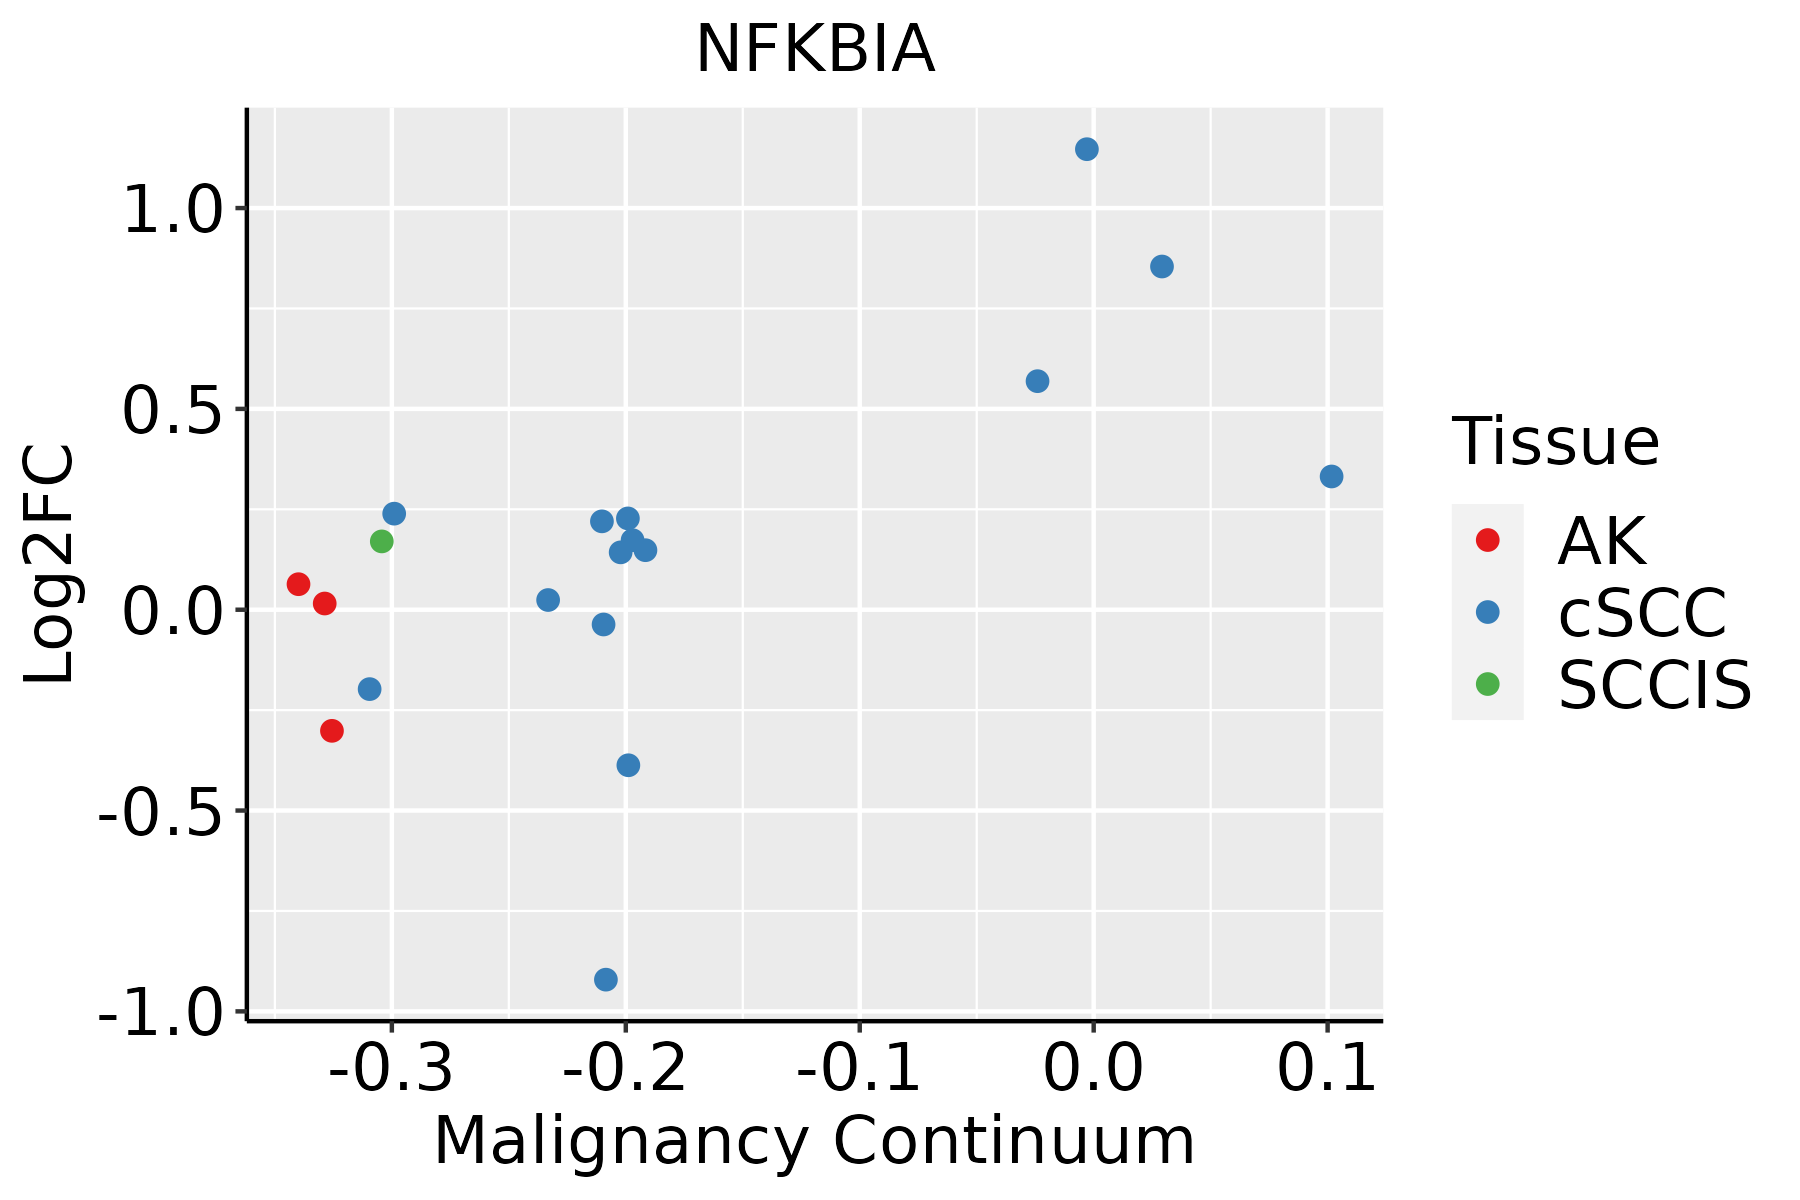 | AK: Actinic keratosis |
| cSCC: Cutaneous squamous cell carcinoma | ||
| SCCIS:squamous cell carcinoma in situ | ||
| Thyroid |  | ATC: Anaplastic thyroid cancer |
| HT: Hashimoto's thyroiditis | ||
| PTC: Papillary thyroid cancer |
| ∗log2FC in expression of this searched gene in stem-like cells from each diseased tissue sample relative to stem-like cells in normal samples in each tissue plotted against the malignancy continuum. Samples are colored based on if they are from different disease stage. |
Top |
Malignant transformation related pathway analysis |
| Find out the enriched GO biological processes and KEGG pathways involved in transition from healthy to precancer to cancer |
| Tissue | Disease Stage | Enriched GO biological Processes |
| Colorectum | AD |  |
| Colorectum | SER |  |
| Colorectum | MSS |  |
| Colorectum | MSI-H |  |
| Colorectum | FAP |  |
| ∗Top 15 enriched GO BP terms are showed in the bar plot of each disease state in each tissue. Each row represents a significant GO biological process which is colored according to the -log10(p.adjust). |
| Page: 1 2 3 4 5 6 7 8 9 |
| GO ID | Tissue | Disease Stage | Description | Gene Ratio | Bg Ratio | pvalue | p.adjust | Count |
| GO:00511019 | Breast | Precancer | regulation of DNA binding | 22/1080 | 118/18723 | 9.28e-07 | 3.71e-05 | 22 |
| GO:00451859 | Breast | Precancer | maintenance of protein location | 19/1080 | 94/18723 | 1.43e-06 | 5.35e-05 | 19 |
| GO:00510989 | Breast | Precancer | regulation of binding | 44/1080 | 363/18723 | 2.59e-06 | 8.65e-05 | 44 |
| GO:00092667 | Breast | Precancer | response to temperature stimulus | 27/1080 | 178/18723 | 3.85e-06 | 1.21e-04 | 27 |
| GO:00300999 | Breast | Precancer | myeloid cell differentiation | 45/1080 | 381/18723 | 4.00e-06 | 1.25e-04 | 45 |
| GO:00512358 | Breast | Precancer | maintenance of location | 40/1080 | 327/18723 | 5.85e-06 | 1.71e-04 | 40 |
| GO:00022378 | Breast | Precancer | response to molecule of bacterial origin | 43/1080 | 363/18723 | 6.05e-06 | 1.72e-04 | 43 |
| GO:00507293 | Breast | Precancer | positive regulation of inflammatory response | 23/1080 | 142/18723 | 6.51e-06 | 1.81e-04 | 23 |
| GO:00324968 | Breast | Precancer | response to lipopolysaccharide | 41/1080 | 343/18723 | 7.94e-06 | 2.17e-04 | 41 |
| GO:0050727 | Breast | Precancer | regulation of inflammatory response | 44/1080 | 386/18723 | 1.26e-05 | 3.22e-04 | 44 |
| GO:00456379 | Breast | Precancer | regulation of myeloid cell differentiation | 28/1080 | 210/18723 | 3.05e-05 | 6.72e-04 | 28 |
| GO:00321034 | Breast | Precancer | positive regulation of response to external stimulus | 46/1080 | 427/18723 | 3.41e-05 | 7.40e-04 | 46 |
| GO:19037069 | Breast | Precancer | regulation of hemopoiesis | 41/1080 | 367/18723 | 3.95e-05 | 8.52e-04 | 41 |
| GO:00313493 | Breast | Precancer | positive regulation of defense response | 33/1080 | 278/18723 | 6.79e-05 | 1.36e-03 | 33 |
| GO:00713568 | Breast | Precancer | cellular response to tumor necrosis factor | 28/1080 | 229/18723 | 1.42e-04 | 2.45e-03 | 28 |
| GO:00346128 | Breast | Precancer | response to tumor necrosis factor | 29/1080 | 253/18723 | 3.32e-04 | 4.70e-03 | 29 |
| GO:00712227 | Breast | Precancer | cellular response to lipopolysaccharide | 25/1080 | 209/18723 | 4.41e-04 | 5.85e-03 | 25 |
| GO:00712167 | Breast | Precancer | cellular response to biotic stimulus | 28/1080 | 246/18723 | 4.67e-04 | 6.14e-03 | 28 |
| GO:00725948 | Breast | Precancer | establishment of protein localization to organelle | 41/1080 | 422/18723 | 7.75e-04 | 9.20e-03 | 41 |
| GO:00712197 | Breast | Precancer | cellular response to molecule of bacterial origin | 25/1080 | 221/18723 | 1.00e-03 | 1.12e-02 | 25 |
| Page: 1 2 3 4 5 6 7 8 9 10 11 12 13 14 15 16 17 18 19 20 21 22 23 24 25 26 27 28 29 30 31 32 33 34 35 36 37 38 39 40 41 42 43 44 45 46 47 48 49 50 51 52 53 54 55 |
| Pathway ID | Tissue | Disease Stage | Description | Gene Ratio | Bg Ratio | pvalue | p.adjust | qvalue | Count |
| hsa0517118 | Breast | Precancer | Coronavirus disease - COVID-19 | 81/684 | 232/8465 | 3.74e-32 | 2.36e-30 | 1.81e-30 | 81 |
| hsa0520818 | Breast | Precancer | Chemical carcinogenesis - reactive oxygen species | 68/684 | 223/8465 | 3.61e-23 | 1.14e-21 | 8.73e-22 | 68 |
| hsa0513218 | Breast | Precancer | Salmonella infection | 49/684 | 249/8465 | 2.92e-09 | 6.15e-08 | 4.71e-08 | 49 |
| hsa0513414 | Breast | Precancer | Legionellosis | 19/684 | 57/8465 | 4.62e-08 | 9.12e-07 | 6.98e-07 | 19 |
| hsa0513018 | Breast | Precancer | Pathogenic Escherichia coli infection | 38/684 | 197/8465 | 3.12e-07 | 5.81e-06 | 4.45e-06 | 38 |
| hsa0513118 | Breast | Precancer | Shigellosis | 44/684 | 247/8465 | 3.91e-07 | 6.86e-06 | 5.26e-06 | 44 |
| hsa0516718 | Breast | Precancer | Kaposi sarcoma-associated herpesvirus infection | 36/684 | 194/8465 | 1.68e-06 | 2.53e-05 | 1.94e-05 | 36 |
| hsa0541718 | Breast | Precancer | Lipid and atherosclerosis | 37/684 | 215/8465 | 7.64e-06 | 9.29e-05 | 7.12e-05 | 37 |
| hsa0516918 | Breast | Precancer | Epstein-Barr virus infection | 35/684 | 202/8465 | 1.15e-05 | 1.26e-04 | 9.64e-05 | 35 |
| hsa0465716 | Breast | Precancer | IL-17 signaling pathway | 20/684 | 94/8465 | 4.74e-05 | 4.54e-04 | 3.48e-04 | 20 |
| hsa042108 | Breast | Precancer | Apoptosis | 25/684 | 136/8465 | 7.61e-05 | 6.87e-04 | 5.26e-04 | 25 |
| hsa0516618 | Breast | Precancer | Human T-cell leukemia virus 1 infection | 33/684 | 222/8465 | 4.29e-04 | 3.31e-03 | 2.53e-03 | 33 |
| hsa0516316 | Breast | Precancer | Human cytomegalovirus infection | 32/684 | 225/8465 | 1.13e-03 | 7.57e-03 | 5.80e-03 | 32 |
| hsa051206 | Breast | Precancer | Epithelial cell signaling in Helicobacter pylori infection | 14/684 | 70/8465 | 1.21e-03 | 7.99e-03 | 6.12e-03 | 14 |
| hsa052036 | Breast | Precancer | Viral carcinogenesis | 27/684 | 204/8465 | 7.19e-03 | 4.06e-02 | 3.11e-02 | 27 |
| hsa0517119 | Breast | Precancer | Coronavirus disease - COVID-19 | 81/684 | 232/8465 | 3.74e-32 | 2.36e-30 | 1.81e-30 | 81 |
| hsa0520819 | Breast | Precancer | Chemical carcinogenesis - reactive oxygen species | 68/684 | 223/8465 | 3.61e-23 | 1.14e-21 | 8.73e-22 | 68 |
| hsa0513219 | Breast | Precancer | Salmonella infection | 49/684 | 249/8465 | 2.92e-09 | 6.15e-08 | 4.71e-08 | 49 |
| hsa0513415 | Breast | Precancer | Legionellosis | 19/684 | 57/8465 | 4.62e-08 | 9.12e-07 | 6.98e-07 | 19 |
| hsa0513019 | Breast | Precancer | Pathogenic Escherichia coli infection | 38/684 | 197/8465 | 3.12e-07 | 5.81e-06 | 4.45e-06 | 38 |
| Page: 1 2 3 4 5 6 7 8 9 10 11 12 13 14 15 16 17 18 19 20 21 22 23 24 25 26 27 28 29 30 31 32 33 34 35 36 37 38 39 40 41 42 43 44 45 46 47 48 49 50 51 52 53 54 55 56 57 58 59 60 61 62 63 64 |
Top |
Cell-cell communication analysis |
| Identification of potential cell-cell interactions between two cell types and their ligand-receptor pairs for different disease states |
| Ligand | Receptor | LRpair | Pathway | Tissue | Disease Stage |
| Page: 1 |
Top |
Single-cell gene regulatory network inference analysis |
| Find out the significant the regulons (TFs) and the target genes of each regulon across cell types for different disease states |
| TF | Cell Type | Tissue | Disease Stage | Target Gene | RSS | Regulon Activity |
| ∗The dot plots of a searched regulon are shown for all cell subpopulations in each disease state of each tissue based on the regulon specific score inferred using pySCENIC and by calculating the average expression. |
| Page: 1 |
Top |
Somatic mutation of malignant transformation related genes |
| Annotation of somatic variants for genes involved in malignant transformation |
| Hugo Symbol | Variant Class | Variant Classification | dbSNP RS | HGVSc | HGVSp | HGVSp Short | SWISSPROT | BIOTYPE | SIFT | PolyPhen | Tumor Sample Barcode | Tissue | Histology | Sex | Age | Stage | Therapy Types | Drugs | Outcome |
| NFKBIA | SNV | Missense_Mutation | novel | c.338N>G | p.Thr113Ser | p.T113S | P25963 | protein_coding | tolerated(0.12) | probably_damaging(0.996) | TCGA-BH-A0BA-01 | Breast | breast invasive carcinoma | Female | <65 | III/IV | Chemotherapy | cytoxan | SD |
| NFKBIA | SNV | Missense_Mutation | c.91N>A | p.Asp31Asn | p.D31N | P25963 | protein_coding | deleterious(0) | probably_damaging(0.996) | TCGA-E2-A159-01 | Breast | breast invasive carcinoma | Female | <65 | I/II | Chemotherapy | cyclophosphamide | SD | |
| NFKBIA | insertion | Frame_Shift_Ins | novel | c.337-1_337insTGCCTATTGGATGCCTTTATAA | p.Thr113CysfsTer23 | p.T113Cfs*23 | P25963 | protein_coding | TCGA-BH-A0BA-01 | Breast | breast invasive carcinoma | Female | <65 | III/IV | Chemotherapy | cytoxan | SD | ||
| NFKBIA | SNV | Missense_Mutation | novel | c.457N>A | p.Glu153Lys | p.E153K | P25963 | protein_coding | tolerated(0.76) | benign(0.025) | TCGA-C5-A2LZ-01 | Cervix | cervical & endocervical cancer | Female | >=65 | III/IV | Unknown | Unknown | PD |
| NFKBIA | SNV | Missense_Mutation | c.412N>C | p.Glu138Gln | p.E138Q | P25963 | protein_coding | tolerated(0.11) | benign(0.353) | TCGA-EX-A69L-01 | Cervix | cervical & endocervical cancer | Female | <65 | I/II | Unknown | Unknown | SD | |
| NFKBIA | SNV | Missense_Mutation | c.904G>C | p.Glu302Gln | p.E302Q | P25963 | protein_coding | tolerated(0.1) | probably_damaging(0.97) | TCGA-VS-A958-01 | Cervix | cervical & endocervical cancer | Female | <65 | I/II | Chemotherapy | cisplatin | CR | |
| NFKBIA | insertion | Frame_Shift_Ins | novel | c.297_298insA | p.Asp100ArgfsTer29 | p.D100Rfs*29 | P25963 | protein_coding | TCGA-ZJ-A8QO-01 | Cervix | cervical & endocervical cancer | Female | >=65 | I/II | Unknown | Unknown | SD | ||
| NFKBIA | SNV | Missense_Mutation | c.652C>T | p.Arg218Trp | p.R218W | P25963 | protein_coding | deleterious(0) | probably_damaging(1) | TCGA-A6-6653-01 | Colorectum | colon adenocarcinoma | Male | >=65 | I/II | Unknown | Unknown | SD | |
| NFKBIA | SNV | Missense_Mutation | novel | c.520N>C | p.Ser174Pro | p.S174P | P25963 | protein_coding | tolerated(0.25) | benign(0.207) | TCGA-AZ-6598-01 | Colorectum | colon adenocarcinoma | Female | >=65 | I/II | Unknown | Unknown | SD |
| NFKBIA | SNV | Missense_Mutation | novel | c.125N>G | p.Tyr42Cys | p.Y42C | P25963 | protein_coding | deleterious(0) | probably_damaging(0.997) | TCGA-G4-6304-01 | Colorectum | colon adenocarcinoma | Female | >=65 | I/II | Chemotherapy | fluorouracil | PD |
| Page: 1 2 3 |
Top |
Related drugs of malignant transformation related genes |
| Identification of chemicals and drugs interact with genes involved in malignant transfromation |
| (DGIdb 4.0) |
| Entrez ID | Symbol | Category | Interaction Types | Drug Claim Name | Drug Name | PMIDs |
| 4792 | NFKBIA | CLINICALLY ACTIONABLE, TRANSCRIPTION FACTOR BINDING, DRUGGABLE GENOME | 6-METHOXYCOMAPARVIN | CHEMBL401565 | 18088098 | |
| 4792 | NFKBIA | CLINICALLY ACTIONABLE, TRANSCRIPTION FACTOR BINDING, DRUGGABLE GENOME | 6-METHOXYCOMAPARVIN 5-METHYL ETHER | CHEMBL256967 | 18088098 | |
| 4792 | NFKBIA | CLINICALLY ACTIONABLE, TRANSCRIPTION FACTOR BINDING, DRUGGABLE GENOME | DEMETHYLWEDELOLACTONE | DEMETHYLWEDELOLACTONE | 22926226 | |
| 4792 | NFKBIA | CLINICALLY ACTIONABLE, TRANSCRIPTION FACTOR BINDING, DRUGGABLE GENOME | GAMBOGIC ACID | GAMBOGIC ACID | 22472167 | |
| 4792 | NFKBIA | CLINICALLY ACTIONABLE, TRANSCRIPTION FACTOR BINDING, DRUGGABLE GENOME | gefitinib | GEFITINIB | 31664190 | |
| 4792 | NFKBIA | CLINICALLY ACTIONABLE, TRANSCRIPTION FACTOR BINDING, DRUGGABLE GENOME | (+)-TUBERIFERIN | CHEMBL1940084 | 22153345 | |
| 4792 | NFKBIA | CLINICALLY ACTIONABLE, TRANSCRIPTION FACTOR BINDING, DRUGGABLE GENOME | WEDELOLACTONE | WEDELOLACTONE | 22926226 | |
| 4792 | NFKBIA | CLINICALLY ACTIONABLE, TRANSCRIPTION FACTOR BINDING, DRUGGABLE GENOME | DIOSCIN | DIOSCIN | 23621869 | |
| 4792 | NFKBIA | CLINICALLY ACTIONABLE, TRANSCRIPTION FACTOR BINDING, DRUGGABLE GENOME | PEPEROMIN E | PEPEROMIN E | 19559609 |
| Page: 1 |

Copyright 2023-Present -The University of Texas Health Science Center at Houston |