| Tissue | Expression Dynamics | Abbreviation |
| Colorectum (GSE201348) |  | FAP: Familial adenomatous polyposis |
| CRC: Colorectal cancer |
| Colorectum (HTA11) |  | AD: Adenomas |
| SER: Sessile serrated lesions |
| MSI-H: Microsatellite-high colorectal cancer |
| MSS: Microsatellite stable colorectal cancer |
| Endometrium | 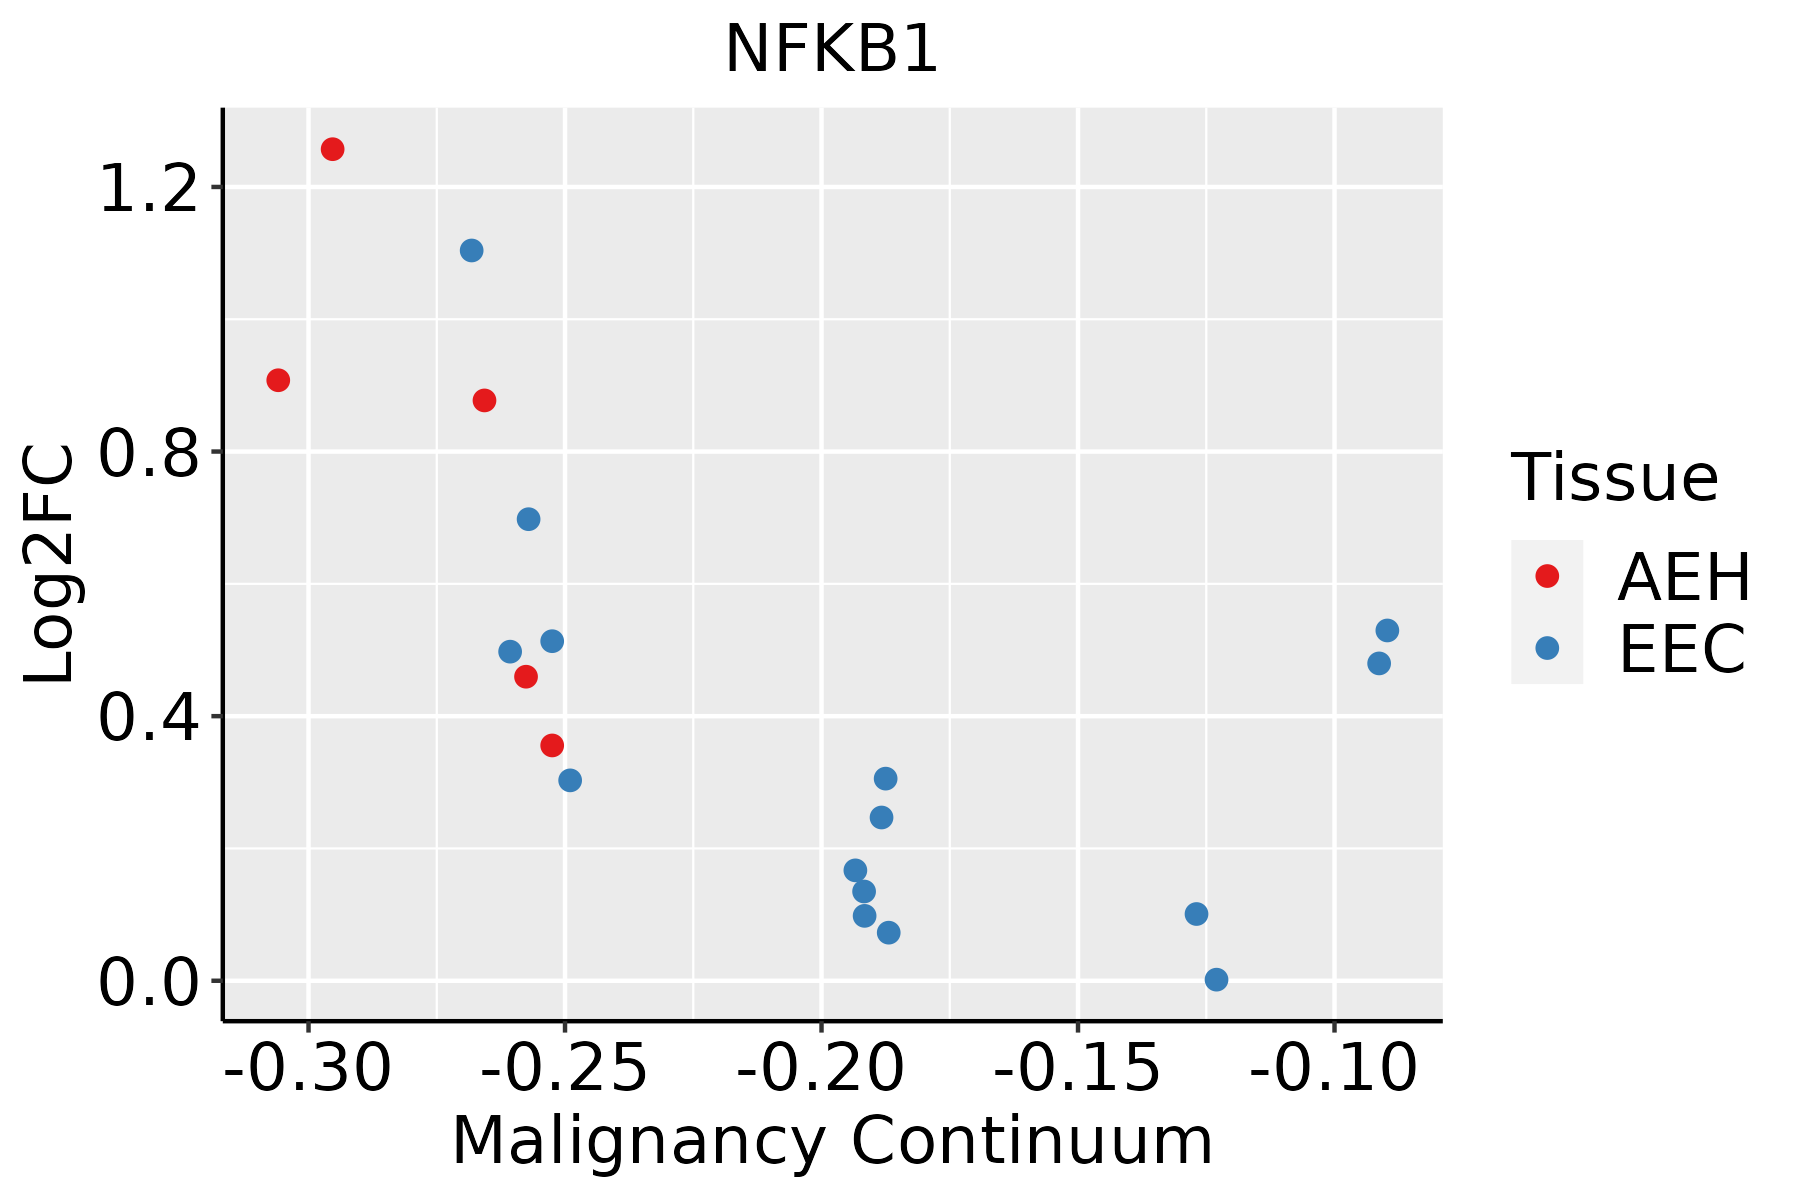 | AEH: Atypical endometrial hyperplasia |
| EEC: Endometrioid Cancer |
| Esophagus | 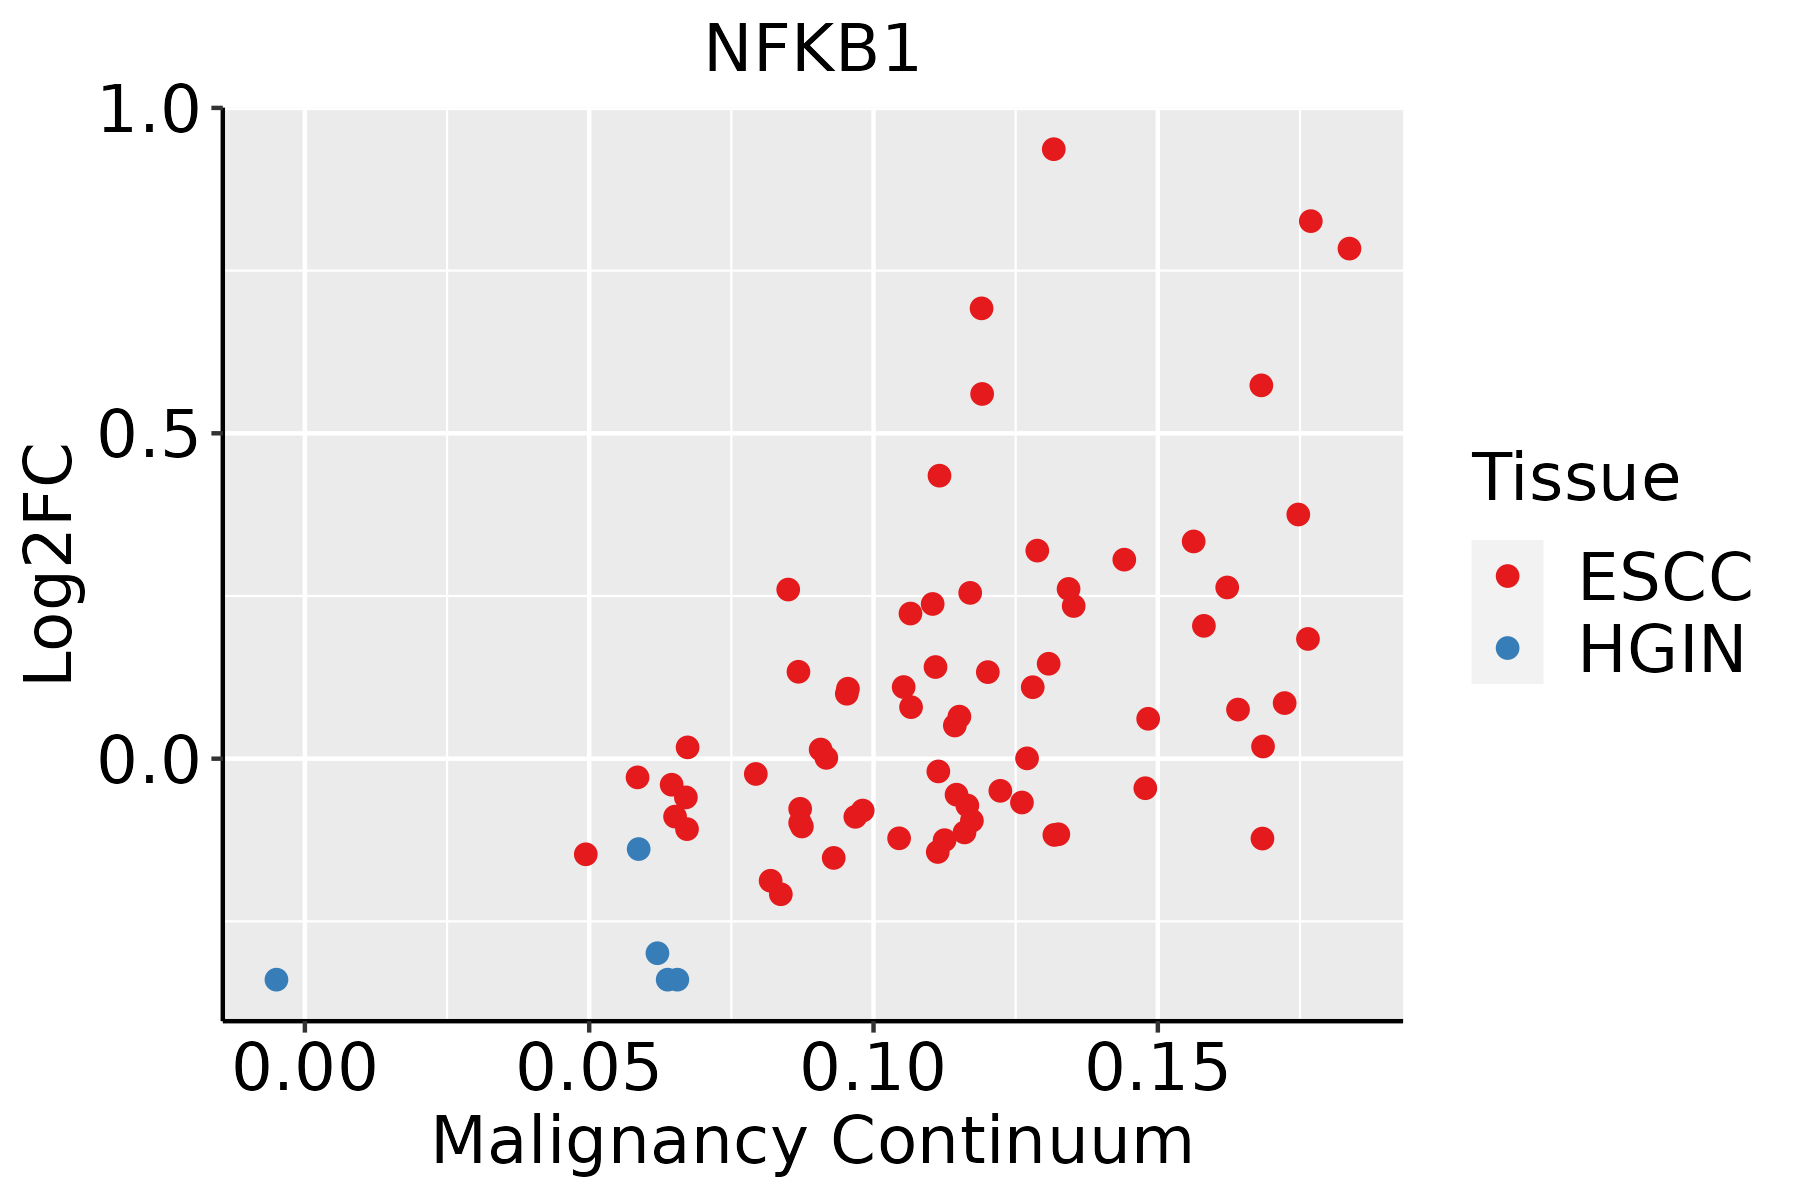 | ESCC: Esophageal squamous cell carcinoma |
| HGIN: High-grade intraepithelial neoplasias |
| LGIN: Low-grade intraepithelial neoplasias |
| Liver | 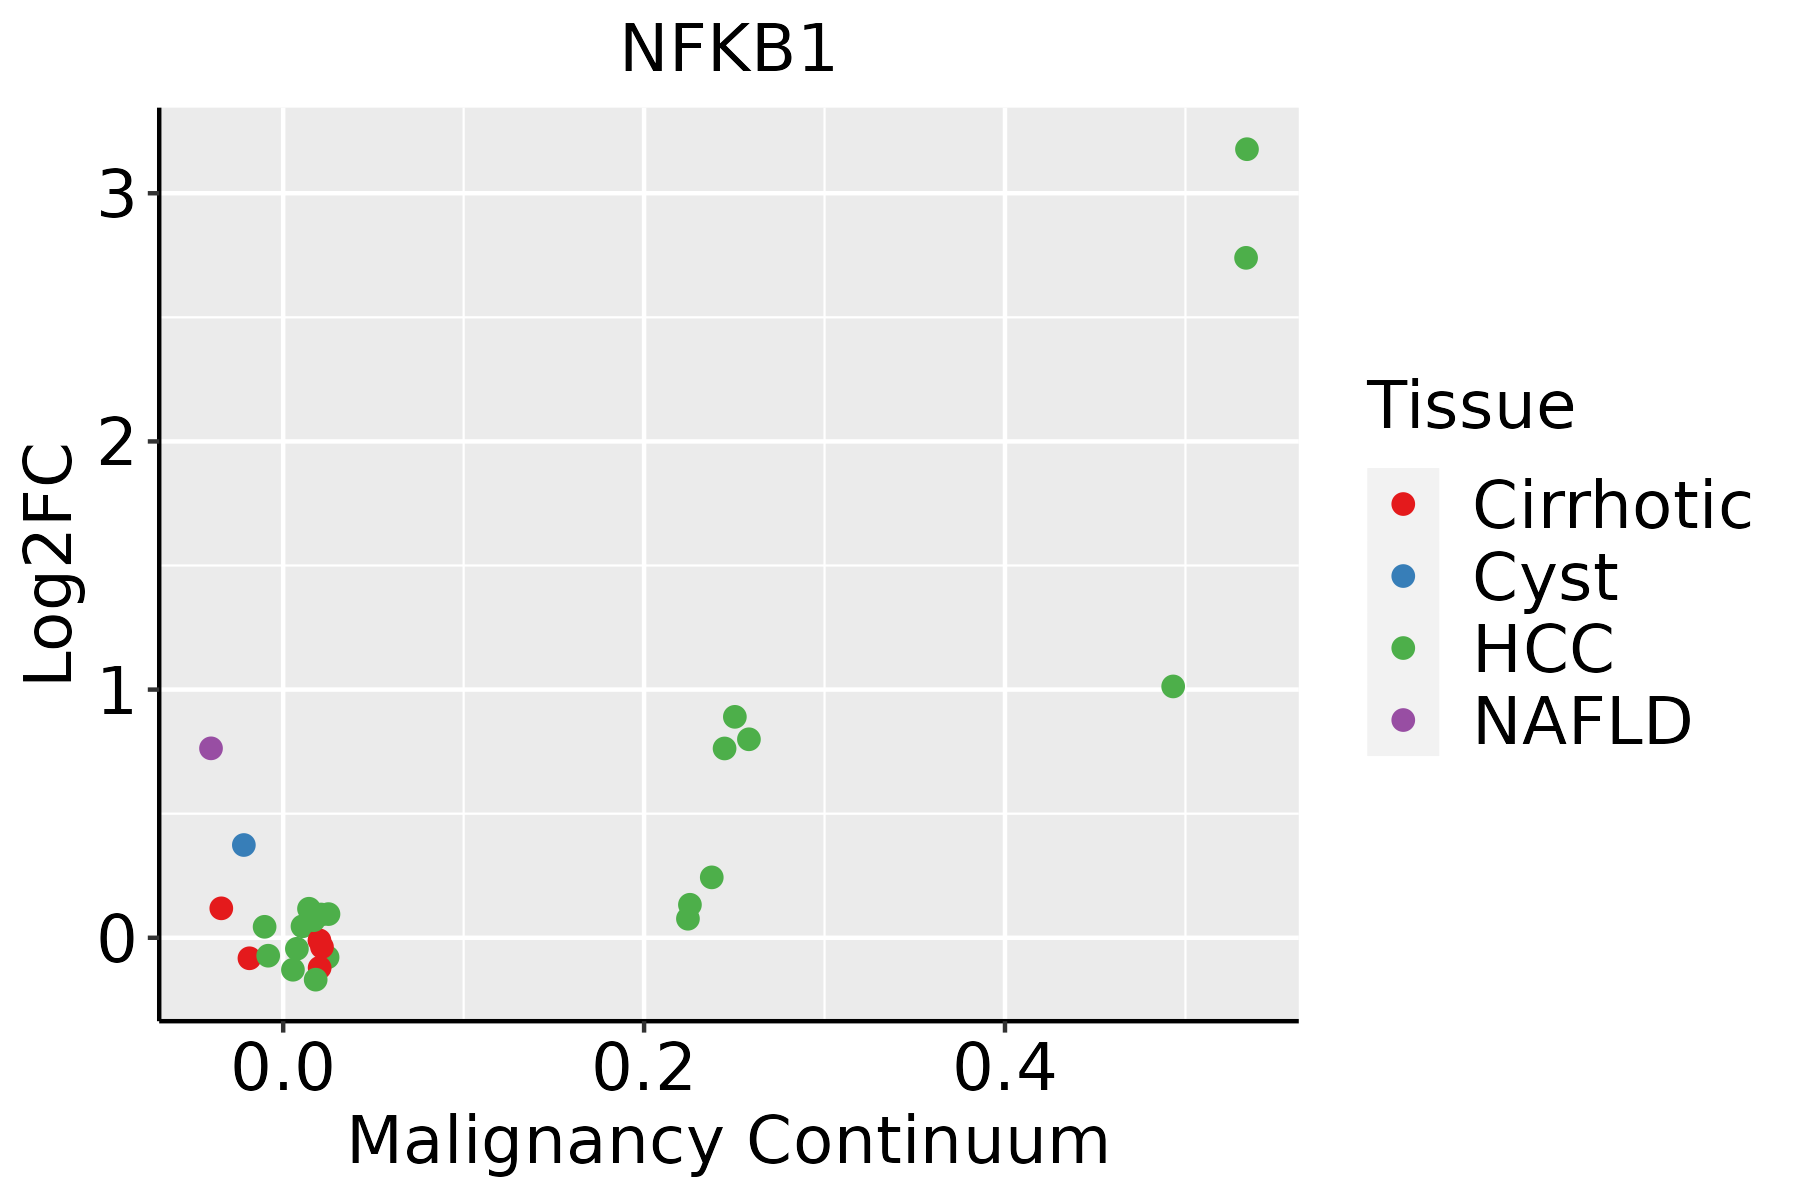 | HCC: Hepatocellular carcinoma |
| NAFLD: Non-alcoholic fatty liver disease |
| Lung |  | AAH: Atypical adenomatous hyperplasia |
| AIS: Adenocarcinoma in situ |
| IAC: Invasive lung adenocarcinoma |
| MIA: Minimally invasive adenocarcinoma |
| Oral Cavity | 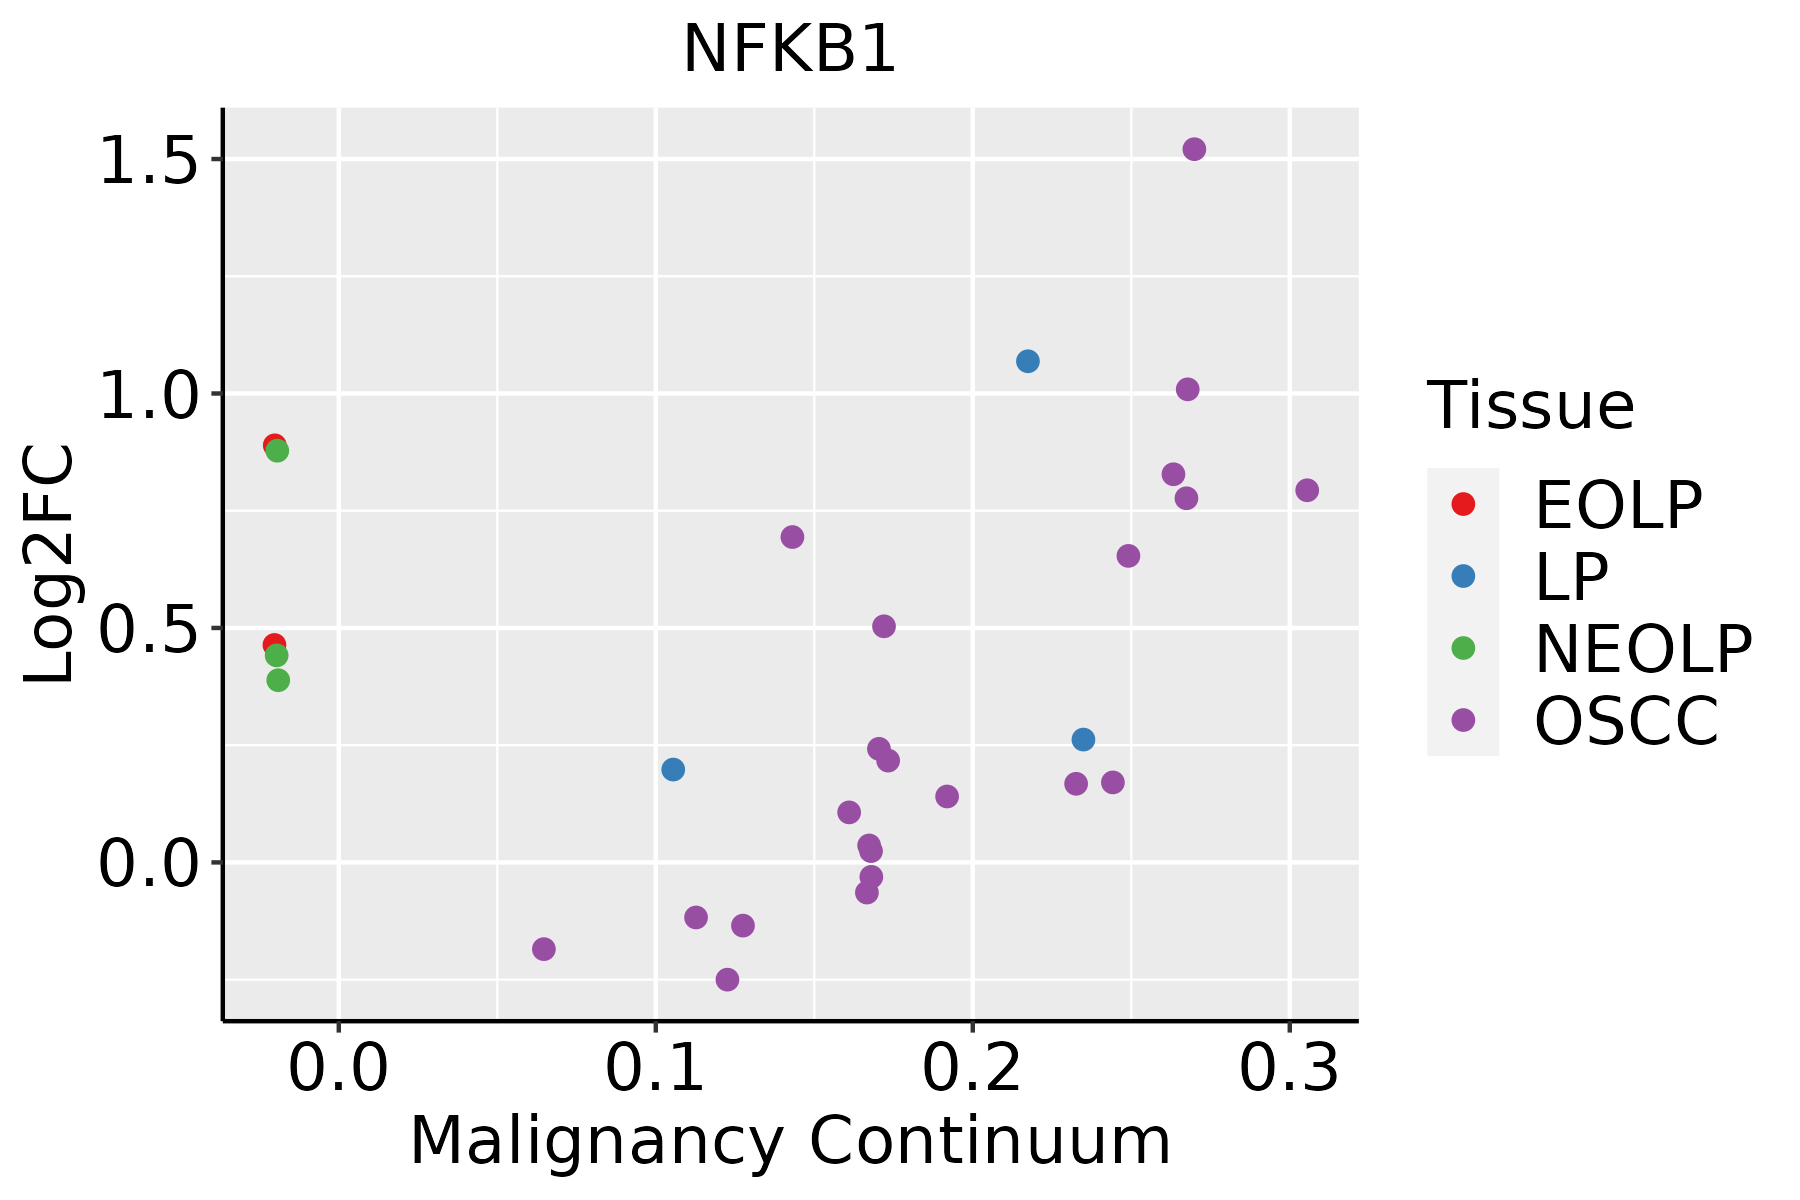 | EOLP: Erosive Oral lichen planus |
| LP: leukoplakia |
| NEOLP: Non-erosive oral lichen planus |
| OSCC: Oral squamous cell carcinoma |
| Prostate | 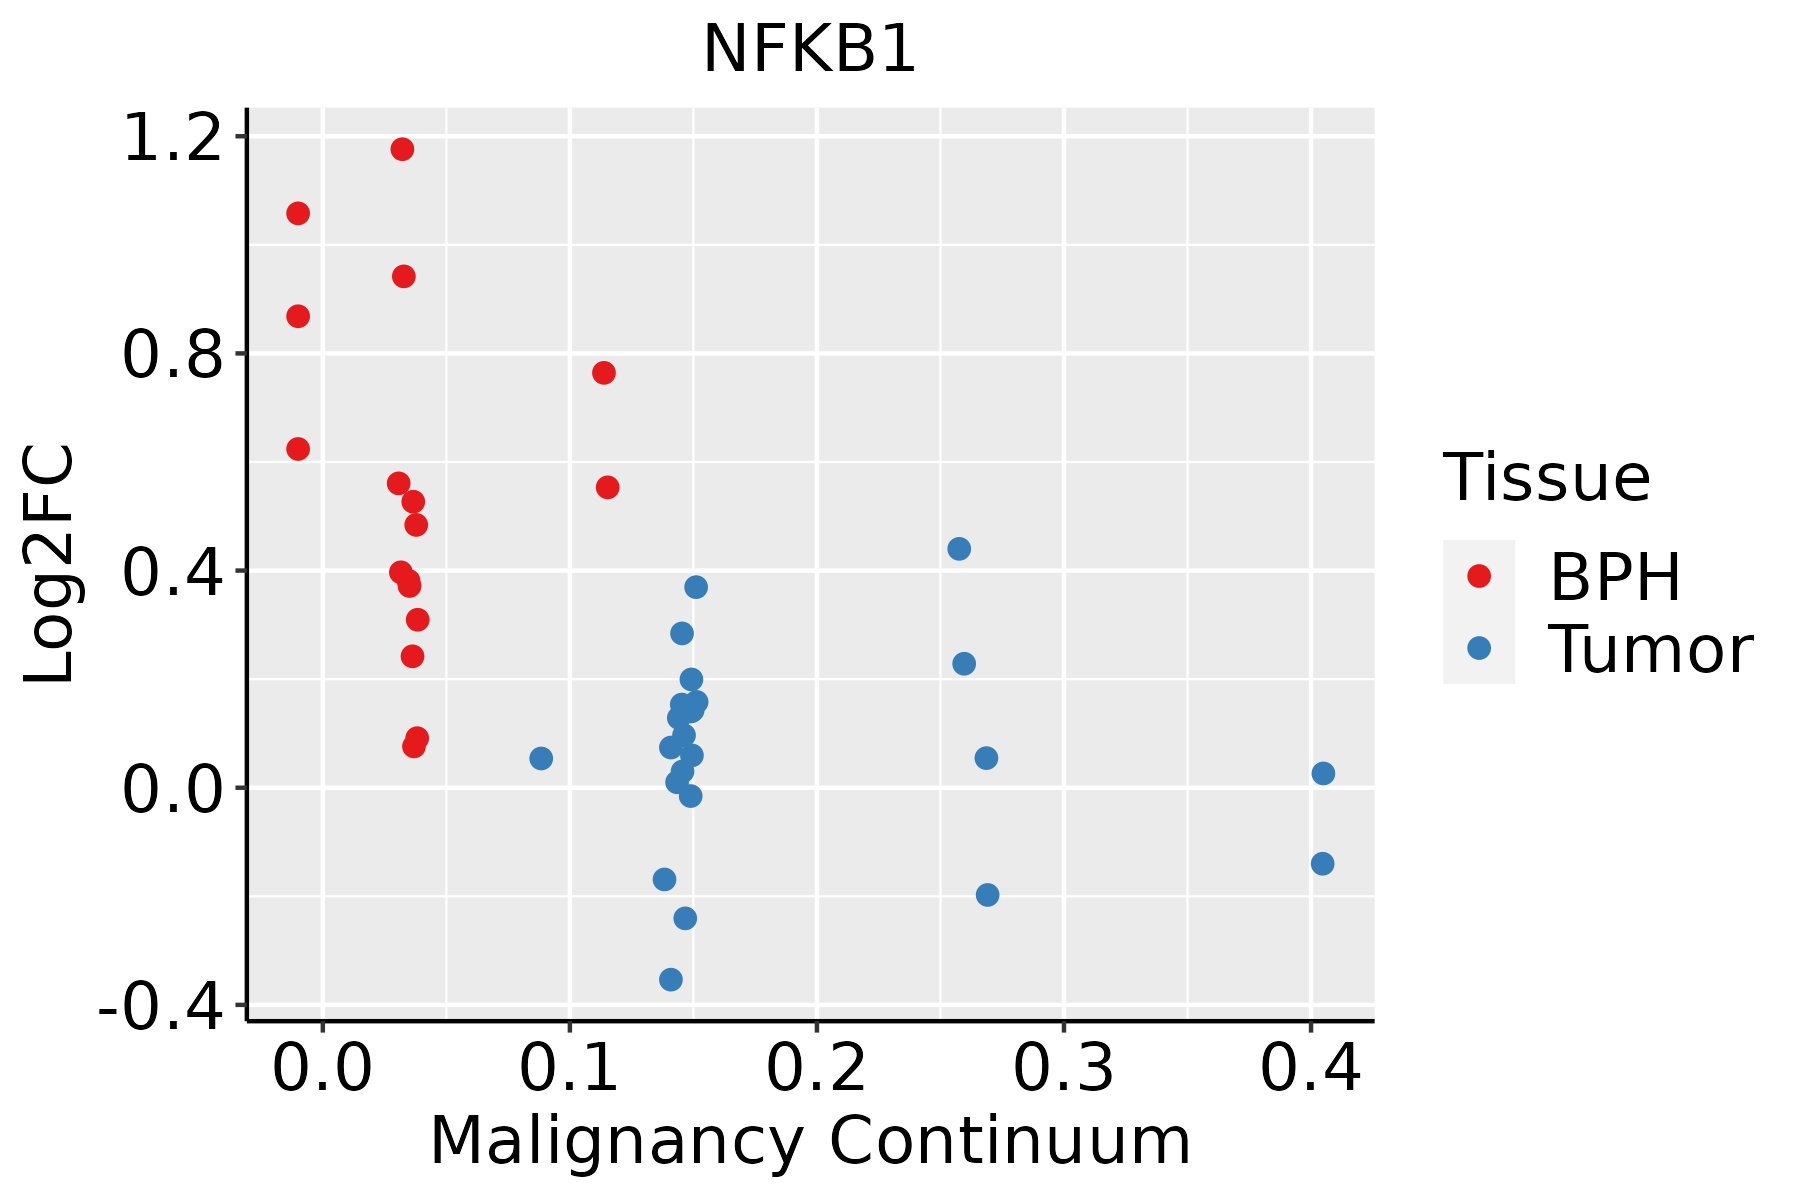 | BPH: Benign Prostatic Hyperplasia |
| Skin | 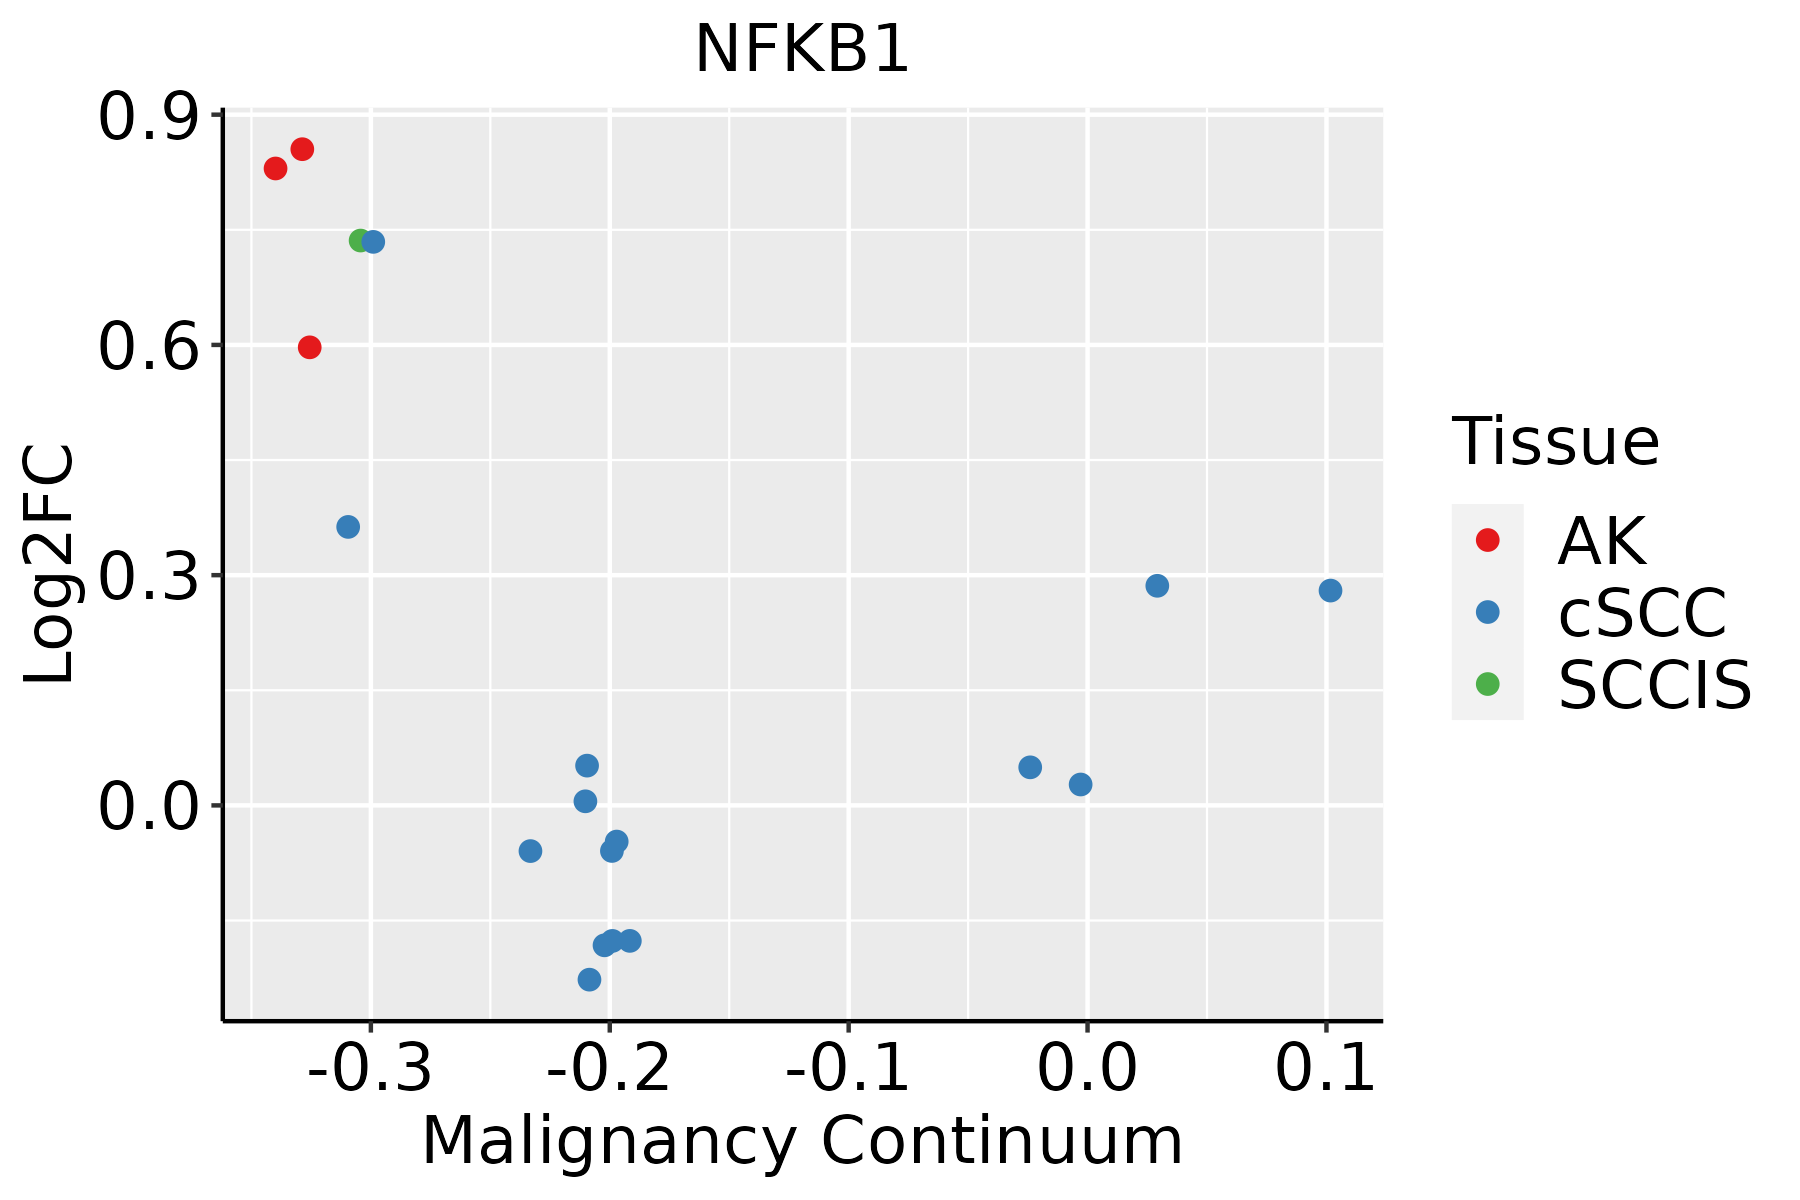 | AK: Actinic keratosis |
| cSCC: Cutaneous squamous cell carcinoma |
| SCCIS:squamous cell carcinoma in situ |
| Thyroid |  | ATC: Anaplastic thyroid cancer |
| HT: Hashimoto's thyroiditis |
| PTC: Papillary thyroid cancer |
| GO ID | Tissue | Disease Stage | Description | Gene Ratio | Bg Ratio | pvalue | p.adjust | Count |
| GO:1901653 | Colorectum | AD | cellular response to peptide | 114/3918 | 359/18723 | 8.32e-07 | 2.88e-05 | 114 |
| GO:0071375 | Colorectum | AD | cellular response to peptide hormone stimulus | 95/3918 | 290/18723 | 1.50e-06 | 4.66e-05 | 95 |
| GO:0043434 | Colorectum | AD | response to peptide hormone | 126/3918 | 414/18723 | 2.70e-06 | 7.86e-05 | 126 |
| GO:0030111 | Colorectum | AD | regulation of Wnt signaling pathway | 102/3918 | 328/18723 | 8.51e-06 | 2.03e-04 | 102 |
| GO:0016055 | Colorectum | AD | Wnt signaling pathway | 130/3918 | 444/18723 | 1.60e-05 | 3.37e-04 | 130 |
| GO:0198738 | Colorectum | AD | cell-cell signaling by wnt | 130/3918 | 446/18723 | 2.02e-05 | 4.10e-04 | 130 |
| GO:0006066 | Colorectum | AD | alcohol metabolic process | 106/3918 | 353/18723 | 3.02e-05 | 5.57e-04 | 106 |
| GO:0060070 | Colorectum | AD | canonical Wnt signaling pathway | 90/3918 | 303/18723 | 1.76e-04 | 2.38e-03 | 90 |
| GO:0071496 | Colorectum | AD | cellular response to external stimulus | 94/3918 | 320/18723 | 1.98e-04 | 2.64e-03 | 94 |
| GO:0060828 | Colorectum | AD | regulation of canonical Wnt signaling pathway | 77/3918 | 253/18723 | 2.19e-04 | 2.87e-03 | 77 |
| GO:0051403 | Colorectum | AD | stress-activated MAPK cascade | 72/3918 | 239/18723 | 4.77e-04 | 5.25e-03 | 72 |
| GO:0031098 | Colorectum | AD | stress-activated protein kinase signaling cascade | 74/3918 | 247/18723 | 4.80e-04 | 5.27e-03 | 74 |
| GO:0006109 | Colorectum | AD | regulation of carbohydrate metabolic process | 55/3918 | 178/18723 | 1.10e-03 | 1.01e-02 | 55 |
| GO:0030177 | Colorectum | AD | positive regulation of Wnt signaling pathway | 45/3918 | 140/18723 | 1.23e-03 | 1.09e-02 | 45 |
| GO:0062012 | Colorectum | AD | regulation of small molecule metabolic process | 93/3918 | 334/18723 | 1.46e-03 | 1.24e-02 | 93 |
| GO:0010876 | Colorectum | AD | lipid localization | 120/3918 | 448/18723 | 1.59e-03 | 1.33e-02 | 120 |
| GO:0006869 | Colorectum | AD | lipid transport | 108/3918 | 398/18723 | 1.67e-03 | 1.39e-02 | 108 |
| GO:0008202 | Colorectum | AD | steroid metabolic process | 85/3918 | 319/18723 | 8.07e-03 | 4.75e-02 | 85 |
| GO:00301112 | Colorectum | MSS | regulation of Wnt signaling pathway | 98/3467 | 328/18723 | 3.37e-07 | 1.36e-05 | 98 |
| GO:00160552 | Colorectum | MSS | Wnt signaling pathway | 124/3467 | 444/18723 | 6.06e-07 | 2.26e-05 | 124 |
| Pathway ID | Tissue | Disease Stage | Description | Gene Ratio | Bg Ratio | pvalue | p.adjust | qvalue | Count |
| hsa05208 | Colorectum | AD | Chemical carcinogenesis - reactive oxygen species | 126/2092 | 223/8465 | 1.01e-24 | 1.68e-22 | 1.07e-22 | 126 |
| hsa05415 | Colorectum | AD | Diabetic cardiomyopathy | 114/2092 | 203/8465 | 3.65e-22 | 3.06e-20 | 1.95e-20 | 114 |
| hsa05010 | Colorectum | AD | Alzheimer disease | 174/2092 | 384/8465 | 1.82e-19 | 9.26e-18 | 5.91e-18 | 174 |
| hsa04932 | Colorectum | AD | Non-alcoholic fatty liver disease | 90/2092 | 155/8465 | 4.83e-19 | 1.80e-17 | 1.15e-17 | 90 |
| hsa05022 | Colorectum | AD | Pathways of neurodegeneration - multiple diseases | 201/2092 | 476/8465 | 4.54e-18 | 1.27e-16 | 8.09e-17 | 201 |
| hsa05171 | Colorectum | AD | Coronavirus disease - COVID-19 | 113/2092 | 232/8465 | 9.90e-16 | 2.55e-14 | 1.63e-14 | 113 |
| hsa05131 | Colorectum | AD | Shigellosis | 109/2092 | 247/8465 | 1.09e-11 | 2.44e-10 | 1.55e-10 | 109 |
| hsa05132 | Colorectum | AD | Salmonella infection | 102/2092 | 249/8465 | 7.65e-09 | 1.28e-07 | 8.17e-08 | 102 |
| hsa05130 | Colorectum | AD | Pathogenic Escherichia coli infection | 79/2092 | 197/8465 | 1.05e-06 | 1.36e-05 | 8.65e-06 | 79 |
| hsa05135 | Colorectum | AD | Yersinia infection | 58/2092 | 137/8465 | 3.90e-06 | 4.35e-05 | 2.78e-05 | 58 |
| hsa04066 | Colorectum | AD | HIF-1 signaling pathway | 48/2092 | 109/8465 | 7.25e-06 | 7.84e-05 | 5.00e-05 | 48 |
| hsa04722 | Colorectum | AD | Neurotrophin signaling pathway | 50/2092 | 119/8465 | 2.28e-05 | 2.24e-04 | 1.43e-04 | 50 |
| hsa05418 | Colorectum | AD | Fluid shear stress and atherosclerosis | 54/2092 | 139/8465 | 1.41e-04 | 1.16e-03 | 7.37e-04 | 54 |
| hsa05417 | Colorectum | AD | Lipid and atherosclerosis | 73/2092 | 215/8465 | 1.31e-03 | 8.27e-03 | 5.27e-03 | 73 |
| hsa05170 | Colorectum | AD | Human immunodeficiency virus 1 infection | 72/2092 | 212/8465 | 1.40e-03 | 8.46e-03 | 5.39e-03 | 72 |
| hsa05220 | Colorectum | AD | Chronic myeloid leukemia | 31/2092 | 76/8465 | 1.41e-03 | 8.46e-03 | 5.39e-03 | 31 |
| hsa05163 | Colorectum | AD | Human cytomegalovirus infection | 75/2092 | 225/8465 | 2.00e-03 | 1.10e-02 | 7.01e-03 | 75 |
| hsa05160 | Colorectum | AD | Hepatitis C | 54/2092 | 157/8465 | 3.87e-03 | 1.96e-02 | 1.25e-02 | 54 |
| hsa04071 | Colorectum | AD | Sphingolipid signaling pathway | 43/2092 | 121/8465 | 4.83e-03 | 2.28e-02 | 1.45e-02 | 43 |
| hsa05166 | Colorectum | AD | Human T-cell leukemia virus 1 infection | 72/2092 | 222/8465 | 5.24e-03 | 2.44e-02 | 1.55e-02 | 72 |
| TF | Cell Type | Tissue | Disease Stage | Target Gene | RSS | Regulon Activity |
| NFKB1 | SMC | Cervix | Healthy | SOD2,CXCL2,NFKB2, etc. | 8.36e-01 |  |
| NFKB1 | IMENT | Colorectum | MSS | TNFRSF6B,IRF1,C8orf4, etc. | 4.29e-02 |  |
| NFKB1 | AT2 | Lung | IAC | DENND4A,BACH1,KYNU, etc. | 1.83e-01 |  |
| NFKB1 | LC | Lung | IAC | SIPA1L1,AL078604.4,KYNU, etc. | 2.62e-01 | |
| NFKB1 | M2MAC | Skin | Healthy | REL,ATP5F1E,SIPA1L1, etc. | 4.68e-01 |  |
| NFKB1 | M2MAC | Skin | SCCIS | REL,ATP5F1E,SIPA1L1, etc. | 2.92e-01 |  |
| Hugo Symbol | Variant Class | Variant Classification | dbSNP RS | HGVSc | HGVSp | HGVSp Short | SWISSPROT | BIOTYPE | SIFT | PolyPhen | Tumor Sample Barcode | Tissue | Histology | Sex | Age | Stage | Therapy Types | Drugs | Outcome |
| NFKB1 | SNV | Missense_Mutation | | c.1715C>T | p.Ser572Phe | p.S572F | P19838 | protein_coding | tolerated(0.64) | benign(0.201) | TCGA-A2-A0YH-01 | Breast | breast invasive carcinoma | Female | <65 | III/IV | Chemotherapy | adriamycin | SD |
| NFKB1 | SNV | Missense_Mutation | novel | c.2191N>A | p.Gly731Arg | p.G731R | P19838 | protein_coding | deleterious(0) | probably_damaging(0.984) | TCGA-AR-A0TY-01 | Breast | breast invasive carcinoma | Female | <65 | I/II | Unspecific | Paclitaxel | PD |
| NFKB1 | SNV | Missense_Mutation | novel | c.119C>G | p.Ala40Gly | p.A40G | P19838 | protein_coding | tolerated(0.07) | possibly_damaging(0.854) | TCGA-AR-A0U0-01 | Breast | breast invasive carcinoma | Female | >=65 | I/II | Unknown | Unknown | SD |
| NFKB1 | SNV | Missense_Mutation | novel | c.733N>A | p.Ala245Thr | p.A245T | P19838 | protein_coding | deleterious(0) | probably_damaging(0.942) | TCGA-AR-A24L-01 | Breast | breast invasive carcinoma | Female | <65 | I/II | Hormone Therapy | tamoxiphen | PD |
| NFKB1 | SNV | Missense_Mutation | rs865962183 | c.574N>T | p.Arg192Trp | p.R192W | P19838 | protein_coding | deleterious(0.01) | probably_damaging(0.972) | TCGA-AR-A256-01 | Breast | breast invasive carcinoma | Female | <65 | I/II | Chemotherapy | doxorubicin | PD |
| NFKB1 | SNV | Missense_Mutation | | c.221C>G | p.Ser74Cys | p.S74C | P19838 | protein_coding | deleterious(0) | probably_damaging(0.935) | TCGA-E2-A1LH-01 | Breast | breast invasive carcinoma | Female | <65 | I/II | Chemotherapy | adriamycin | SD |
| NFKB1 | SNV | Missense_Mutation | rs769204159 | c.1562N>T | p.Ala521Val | p.A521V | P19838 | protein_coding | tolerated(0.06) | probably_damaging(0.988) | TCGA-E2-A573-01 | Breast | breast invasive carcinoma | Female | <65 | I/II | Chemotherapy | taxotere | CR |
| NFKB1 | SNV | Missense_Mutation | novel | c.1308N>T | p.Met436Ile | p.M436I | P19838 | protein_coding | tolerated(0.25) | benign(0) | TCGA-HN-A2OB-01 | Breast | breast invasive carcinoma | Female | <65 | I/II | Chemotherapy | fluorouracil | PD |
| NFKB1 | insertion | Nonsense_Mutation | novel | c.2107_2108insTTCTAAATATCTACTAGGTATTTGATAAACGTGTGTTATTT | p.Gly703ValfsTer6 | p.G703Vfs*6 | P19838 | protein_coding | | | TCGA-A2-A04Q-01 | Breast | breast invasive carcinoma | Female | <65 | I/II | Chemotherapy | adriamycin | SD |
| NFKB1 | insertion | Frame_Shift_Ins | novel | c.1403_1404insGTTTTTTCCT | p.Asp469PhefsTer16 | p.D469Ffs*16 | P19838 | protein_coding | | | TCGA-AO-A03O-01 | Breast | breast invasive carcinoma | Female | >=65 | I/II | Chemotherapy | doxorubicin | SD |
| Entrez ID | Symbol | Category | Interaction Types | Drug Claim Name | Drug Name | PMIDs |
| 4790 | NFKB1 | KINASE, TRANSCRIPTION FACTOR, DRUGGABLE GENOME | | SJ000113257 | CHEMBL528694 | |
| 4790 | NFKB1 | KINASE, TRANSCRIPTION FACTOR, DRUGGABLE GENOME | | SANGUINARIUM | SANGUINARIUM | |
| 4790 | NFKB1 | KINASE, TRANSCRIPTION FACTOR, DRUGGABLE GENOME | | DYRENE | DYRENE | |
| 4790 | NFKB1 | KINASE, TRANSCRIPTION FACTOR, DRUGGABLE GENOME | | ISORHAMNETIN | ISORHAMNETIN | 25190466 |
| 4790 | NFKB1 | KINASE, TRANSCRIPTION FACTOR, DRUGGABLE GENOME | | MITOXANTRONE | MITOXANTRONE | |
| 4790 | NFKB1 | KINASE, TRANSCRIPTION FACTOR, DRUGGABLE GENOME | | PARTHENOLIDE | PARTHENOLIDE | 25190466 |
| 4790 | NFKB1 | KINASE, TRANSCRIPTION FACTOR, DRUGGABLE GENOME | | THALIDOMIDE | THALIDOMIDE | |
| 4790 | NFKB1 | KINASE, TRANSCRIPTION FACTOR, DRUGGABLE GENOME | | (S)-NOMIFENSINE | CHEMBL51697 | |
| 4790 | NFKB1 | KINASE, TRANSCRIPTION FACTOR, DRUGGABLE GENOME | | 6-CHLOROMELATONIN | CHEMBL34730 | |
| 4790 | NFKB1 | KINASE, TRANSCRIPTION FACTOR, DRUGGABLE GENOME | | TOSYL-L-LYSINE CHLOROMETHYL KETONE | CHEMBL466465 | |


