
|
|||||
|
 | |
| |
| |
| |
| |
| |
|
Gene: NFIC |
Gene summary for NFIC |
| Gene information | Species | Human | Gene symbol | NFIC | Gene ID | 4782 |
| Gene name | nuclear factor I C | |
| Gene Alias | CTF | |
| Cytomap | 19p13.3 | |
| Gene Type | protein-coding | GO ID | GO:0000122 | UniProtAcc | B7Z4T6 |
Top |
Malignant transformation analysis |
| Identification of the aberrant gene expression in precancerous and cancerous lesions by comparing the gene expression of stem-like cells in diseased tissues with normal stem cells |
| Entrez ID | Symbol | Replicates | Species | Organ | Tissue | Adj P-value | Log2FC | Malignancy |
| 4782 | NFIC | GSM4909296 | Human | Breast | IDC | 4.73e-10 | 2.08e-01 | 0.1524 |
| 4782 | NFIC | GSM4909297 | Human | Breast | IDC | 5.16e-10 | -1.60e-01 | 0.1517 |
| 4782 | NFIC | GSM4909298 | Human | Breast | IDC | 3.82e-05 | 2.92e-01 | 0.1551 |
| 4782 | NFIC | GSM4909302 | Human | Breast | IDC | 6.99e-04 | 2.85e-01 | 0.1545 |
| 4782 | NFIC | GSM4909303 | Human | Breast | IDC | 8.84e-04 | 4.91e-01 | 0.0438 |
| 4782 | NFIC | GSM4909306 | Human | Breast | IDC | 8.17e-03 | 2.67e-01 | 0.1564 |
| 4782 | NFIC | GSM4909308 | Human | Breast | IDC | 2.37e-04 | 3.24e-01 | 0.158 |
| 4782 | NFIC | GSM4909311 | Human | Breast | IDC | 1.11e-22 | -1.70e-01 | 0.1534 |
| 4782 | NFIC | GSM4909312 | Human | Breast | IDC | 6.91e-08 | 9.45e-02 | 0.1552 |
| 4782 | NFIC | GSM4909313 | Human | Breast | IDC | 6.42e-03 | 1.95e-01 | 0.0391 |
| 4782 | NFIC | GSM4909319 | Human | Breast | IDC | 1.16e-40 | -5.27e-02 | 0.1563 |
| 4782 | NFIC | GSM4909320 | Human | Breast | IDC | 8.32e-03 | -2.76e-01 | 0.1575 |
| 4782 | NFIC | GSM4909321 | Human | Breast | IDC | 1.03e-15 | 1.59e-02 | 0.1559 |
| 4782 | NFIC | brca3 | Human | Breast | Precancer | 9.68e-03 | 2.25e-01 | -0.0263 |
| 4782 | NFIC | M5 | Human | Breast | IDC | 3.58e-09 | 7.60e-01 | 0.1598 |
| 4782 | NFIC | NCCBC14 | Human | Breast | DCIS | 1.56e-07 | 1.03e-01 | 0.2021 |
| 4782 | NFIC | NCCBC3 | Human | Breast | DCIS | 1.36e-03 | 1.06e-01 | 0.1198 |
| 4782 | NFIC | NCCBC5 | Human | Breast | DCIS | 7.82e-08 | -4.52e-02 | 0.2046 |
| 4782 | NFIC | NCCBC6 | Human | Breast | DCIS | 8.80e-08 | 4.89e-01 | 0.2095 |
| 4782 | NFIC | P1 | Human | Breast | IDC | 1.90e-15 | 4.36e-02 | 0.1527 |
| Page: 1 2 3 4 5 6 7 8 9 10 11 |
| Tissue | Expression Dynamics | Abbreviation |
| Breast | 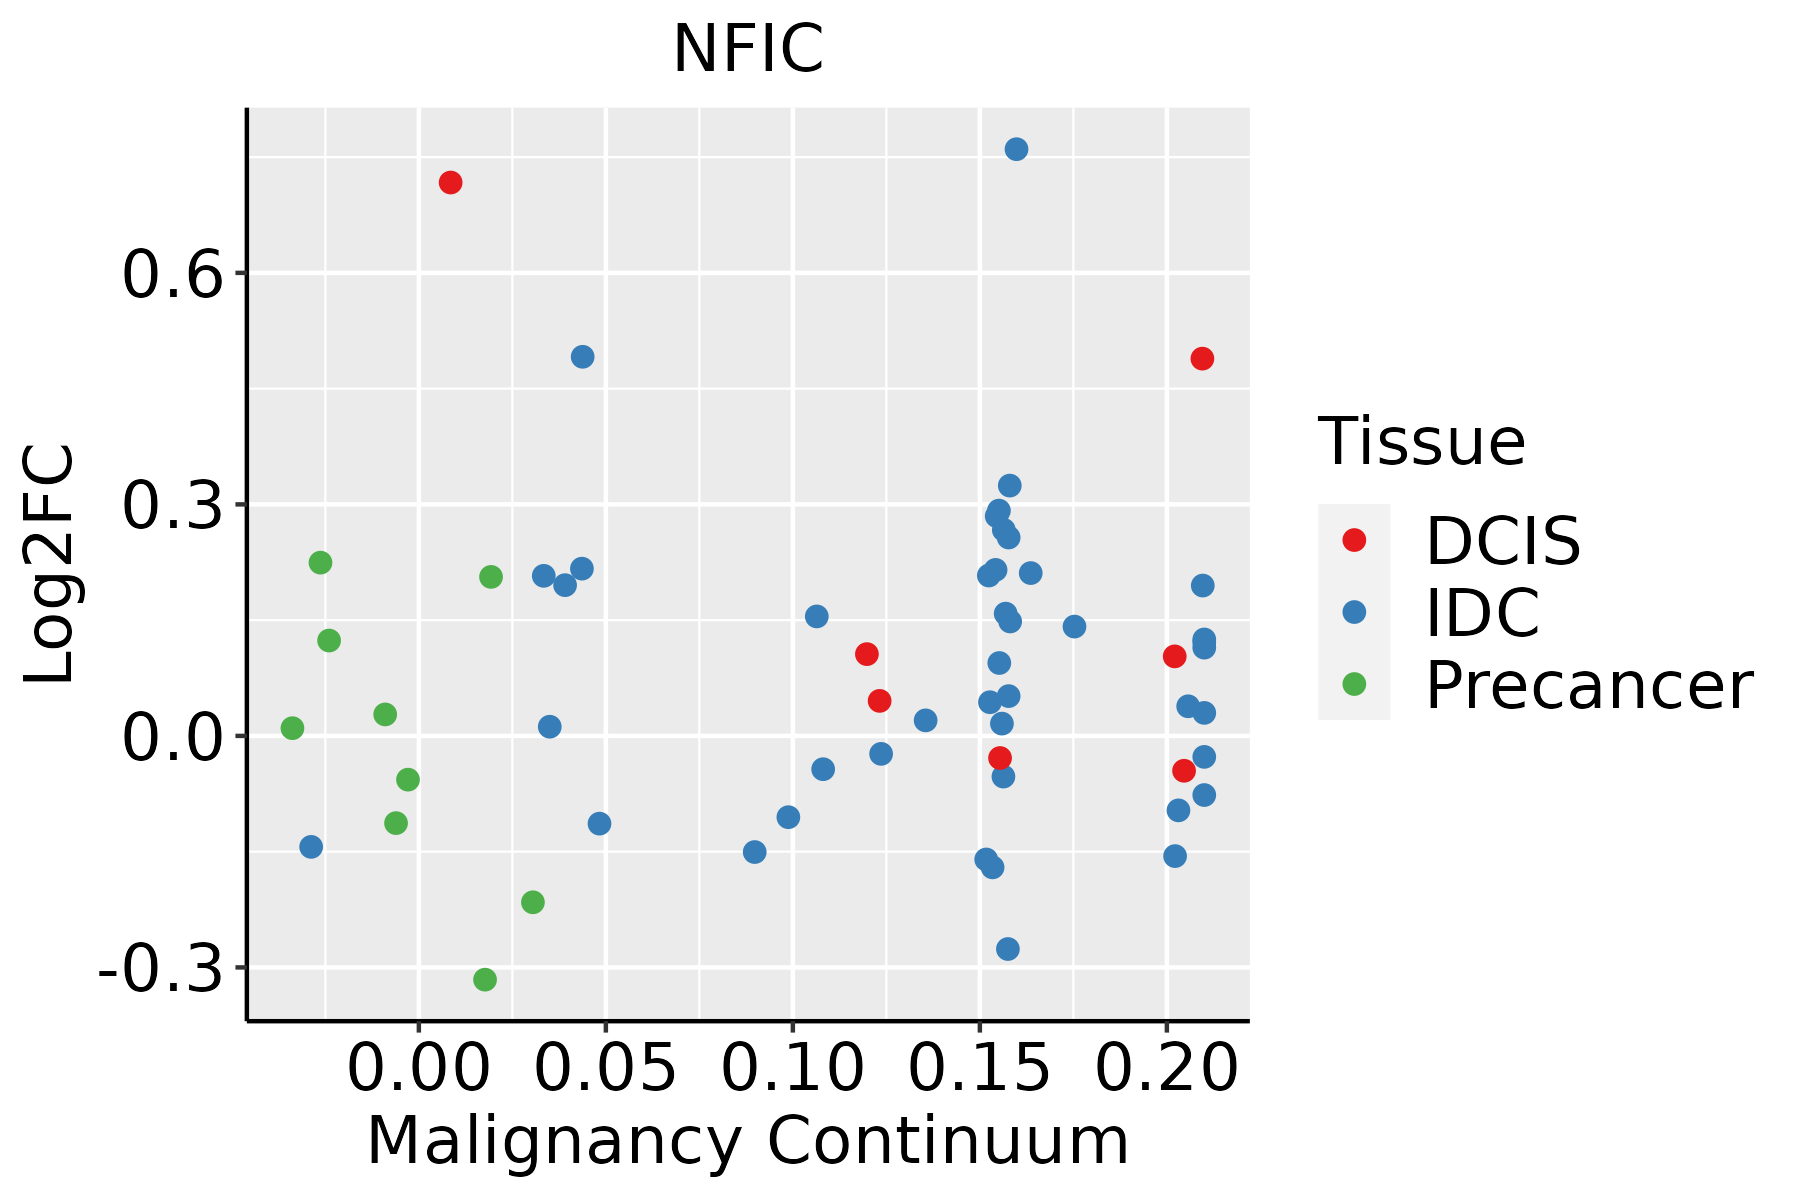 | IDC: Invasive ductal carcinoma |
| DCIS: Ductal carcinoma in situ | ||
| Precancer(BRCA1-mut): Precancerous lesion from BRCA1 mutation carriers | ||
| Colorectum (GSE201348) |  | FAP: Familial adenomatous polyposis |
| CRC: Colorectal cancer | ||
| Colorectum (HTA11) |  | AD: Adenomas |
| SER: Sessile serrated lesions | ||
| MSI-H: Microsatellite-high colorectal cancer | ||
| MSS: Microsatellite stable colorectal cancer | ||
| Endometrium | 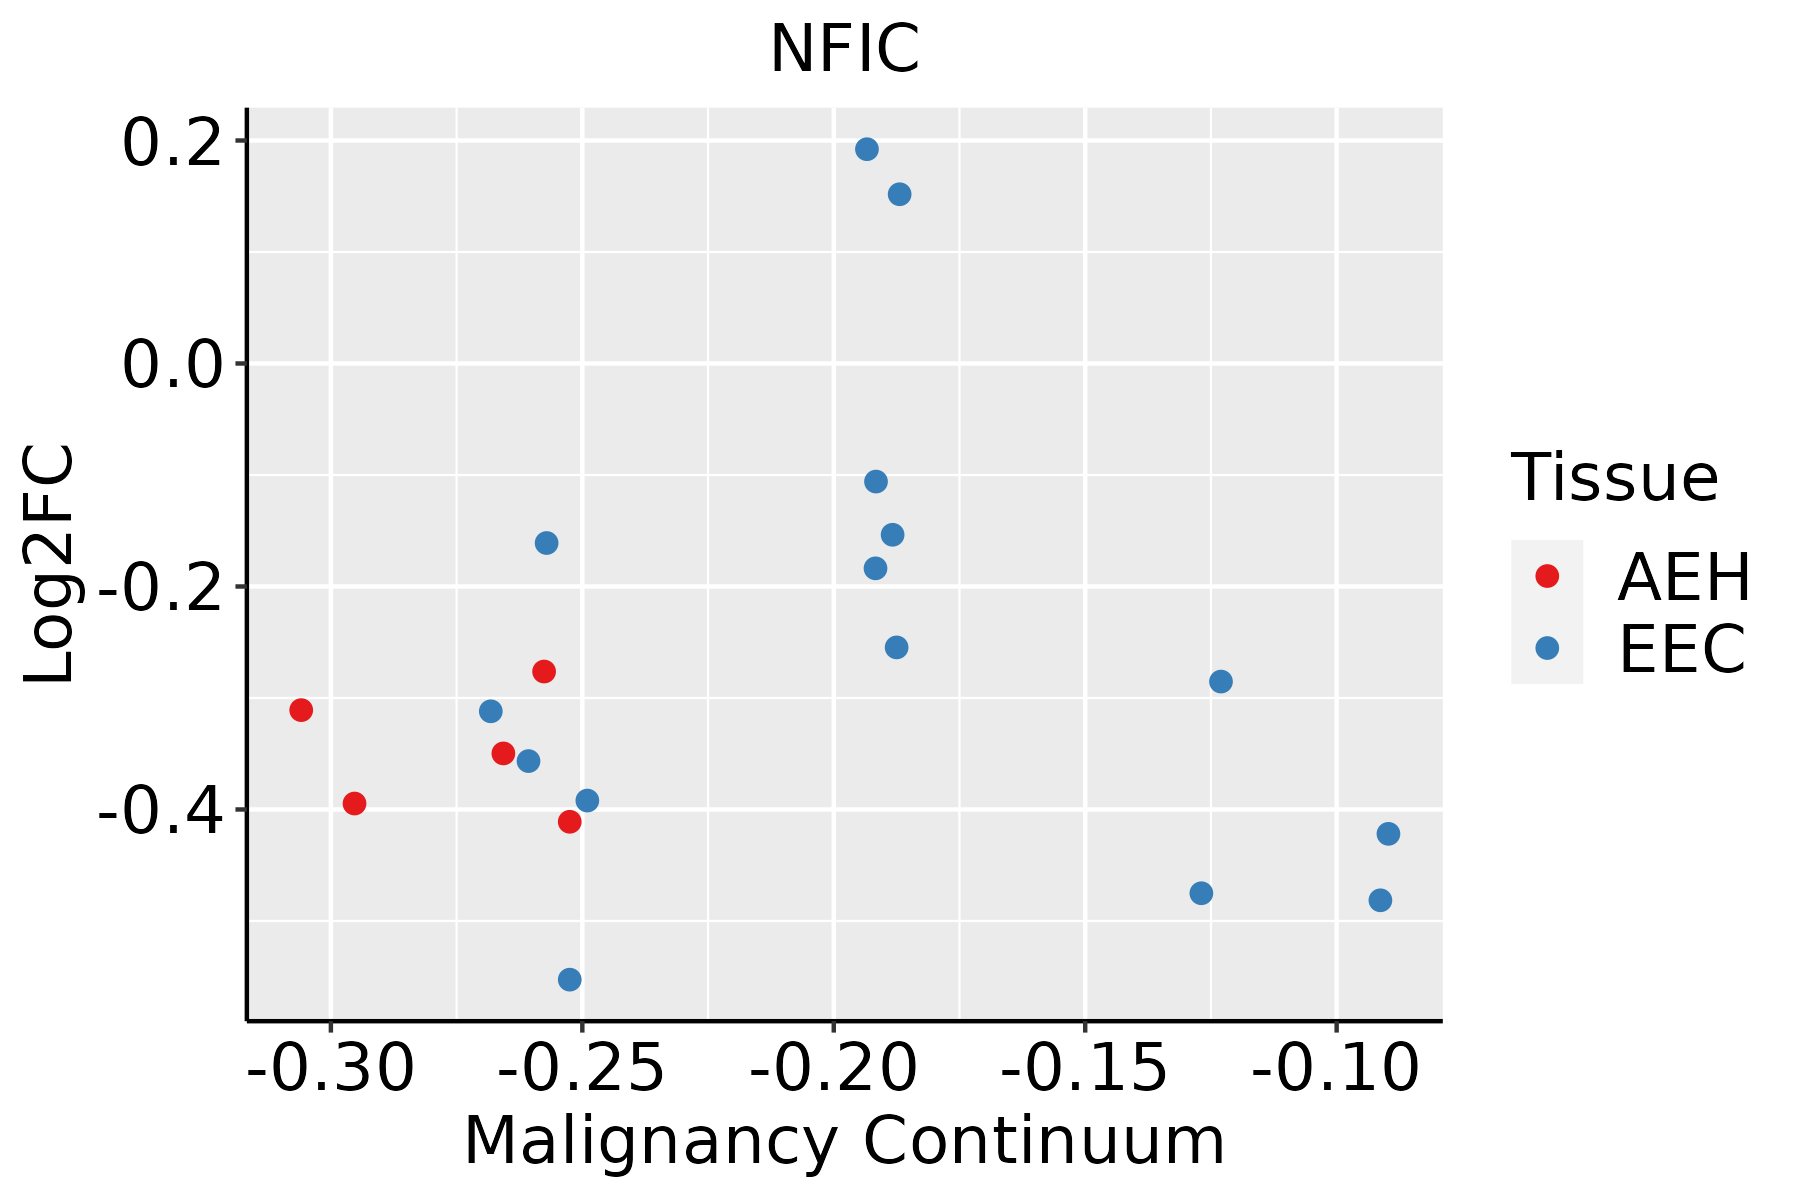 | AEH: Atypical endometrial hyperplasia |
| EEC: Endometrioid Cancer | ||
| Esophagus | 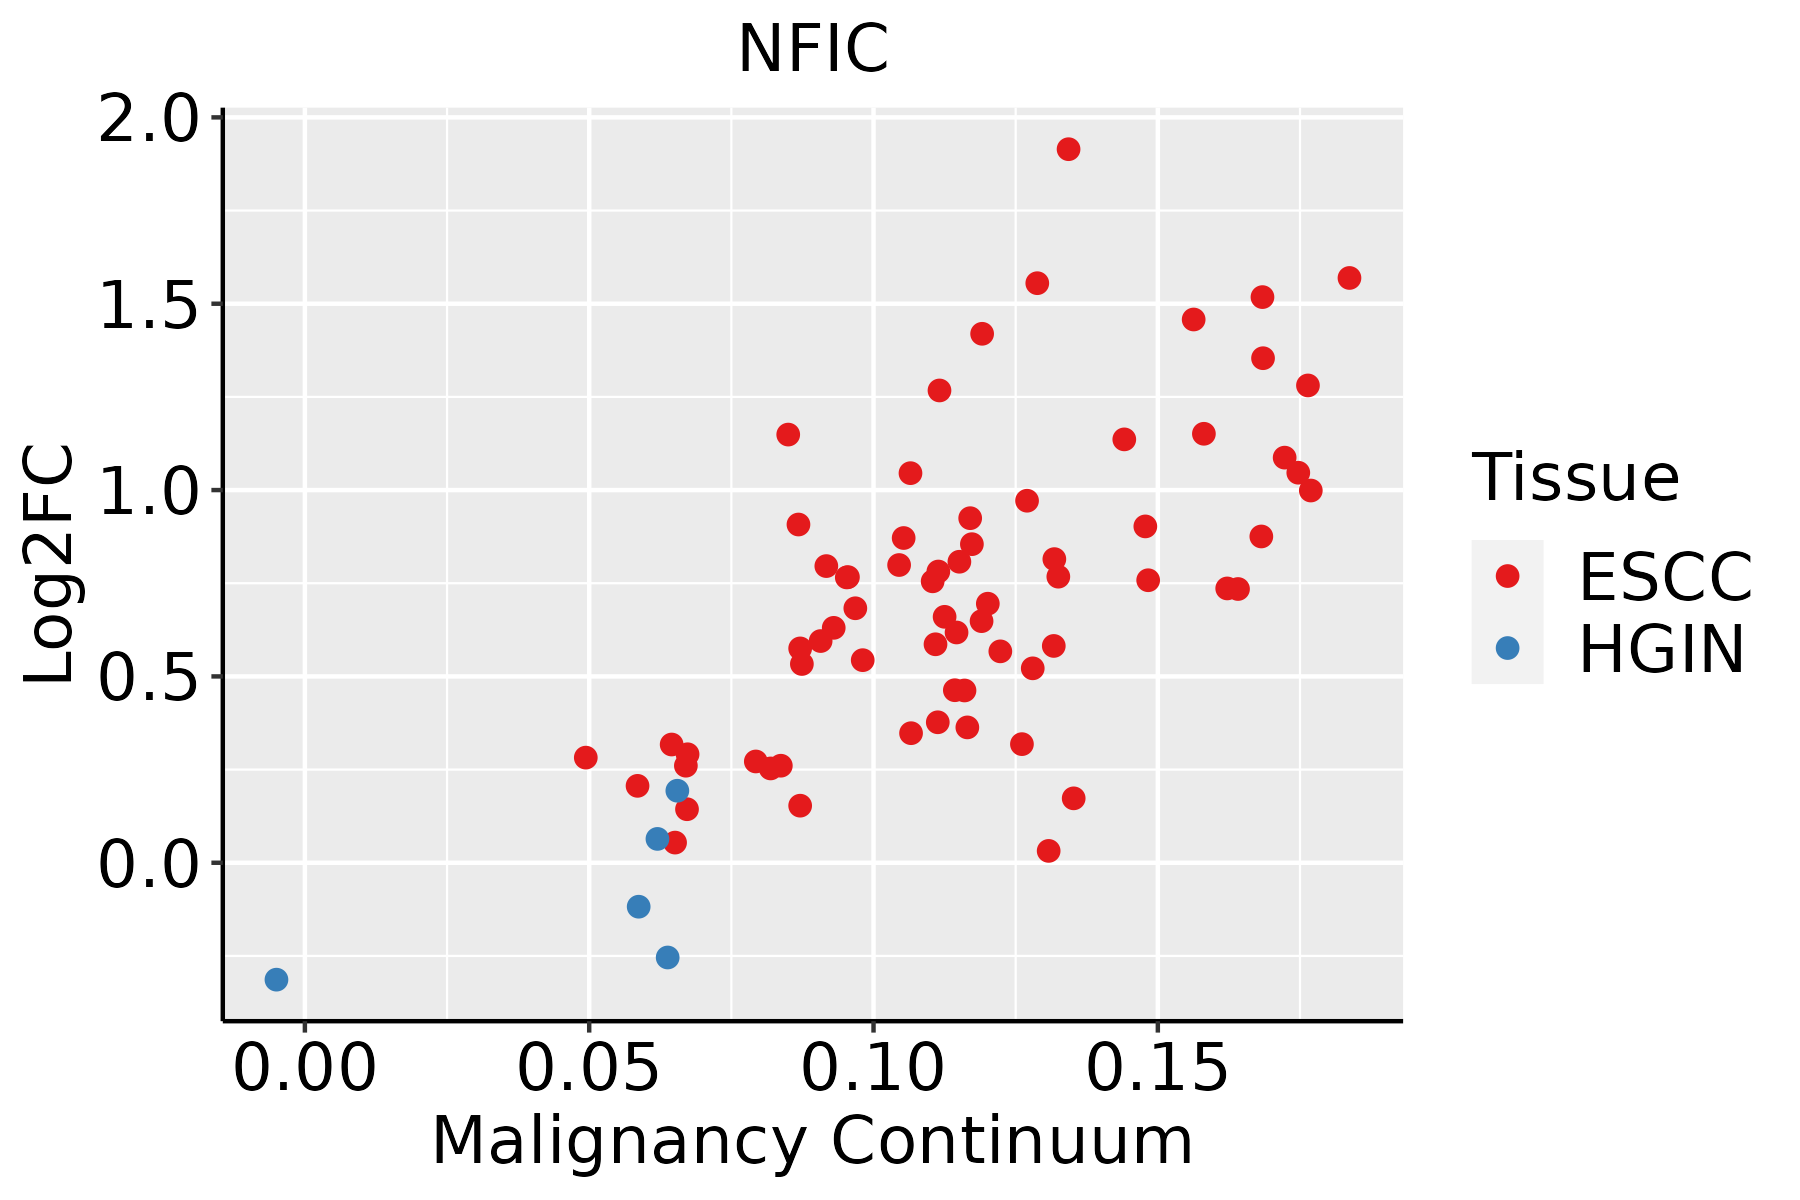 | ESCC: Esophageal squamous cell carcinoma |
| HGIN: High-grade intraepithelial neoplasias | ||
| LGIN: Low-grade intraepithelial neoplasias | ||
| Liver | 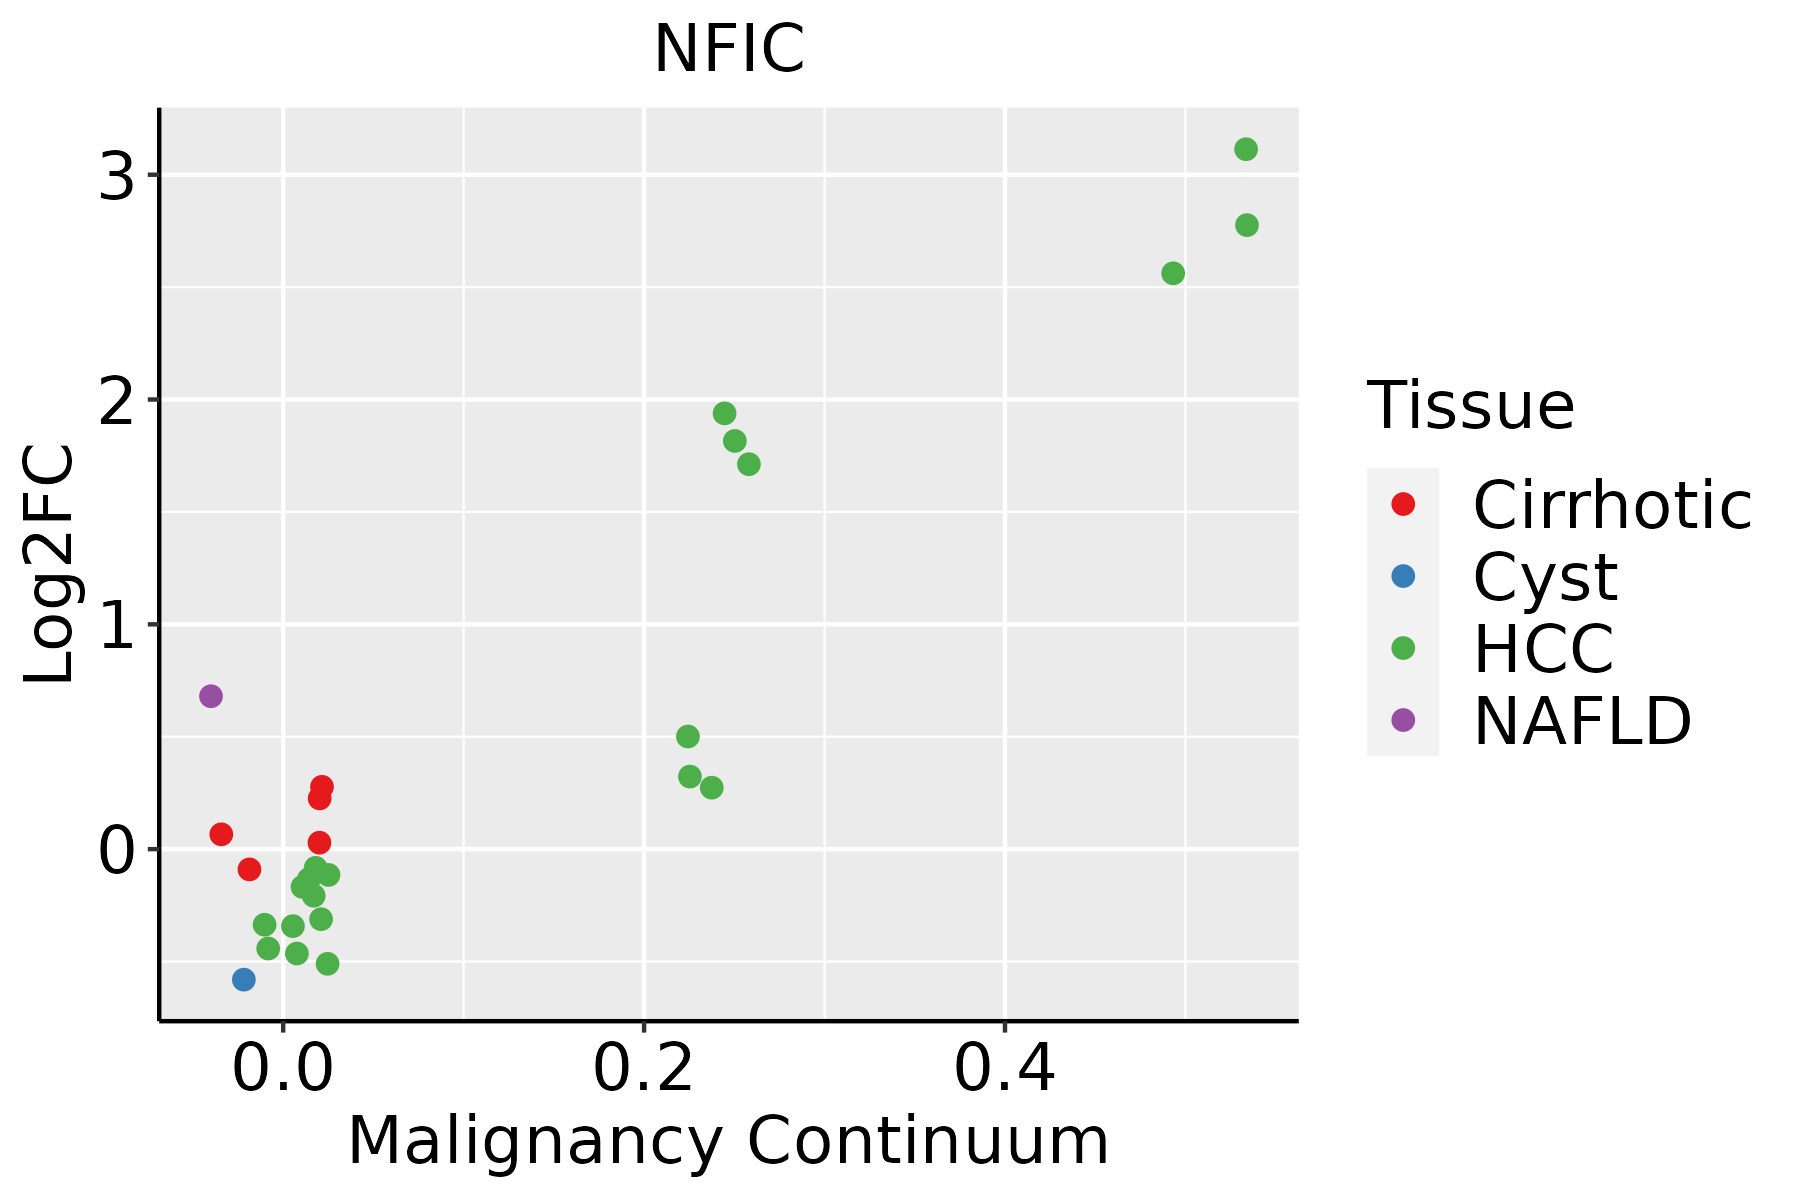 | HCC: Hepatocellular carcinoma |
| NAFLD: Non-alcoholic fatty liver disease | ||
| Oral Cavity |  | EOLP: Erosive Oral lichen planus |
| LP: leukoplakia | ||
| NEOLP: Non-erosive oral lichen planus | ||
| OSCC: Oral squamous cell carcinoma | ||
| Prostate | 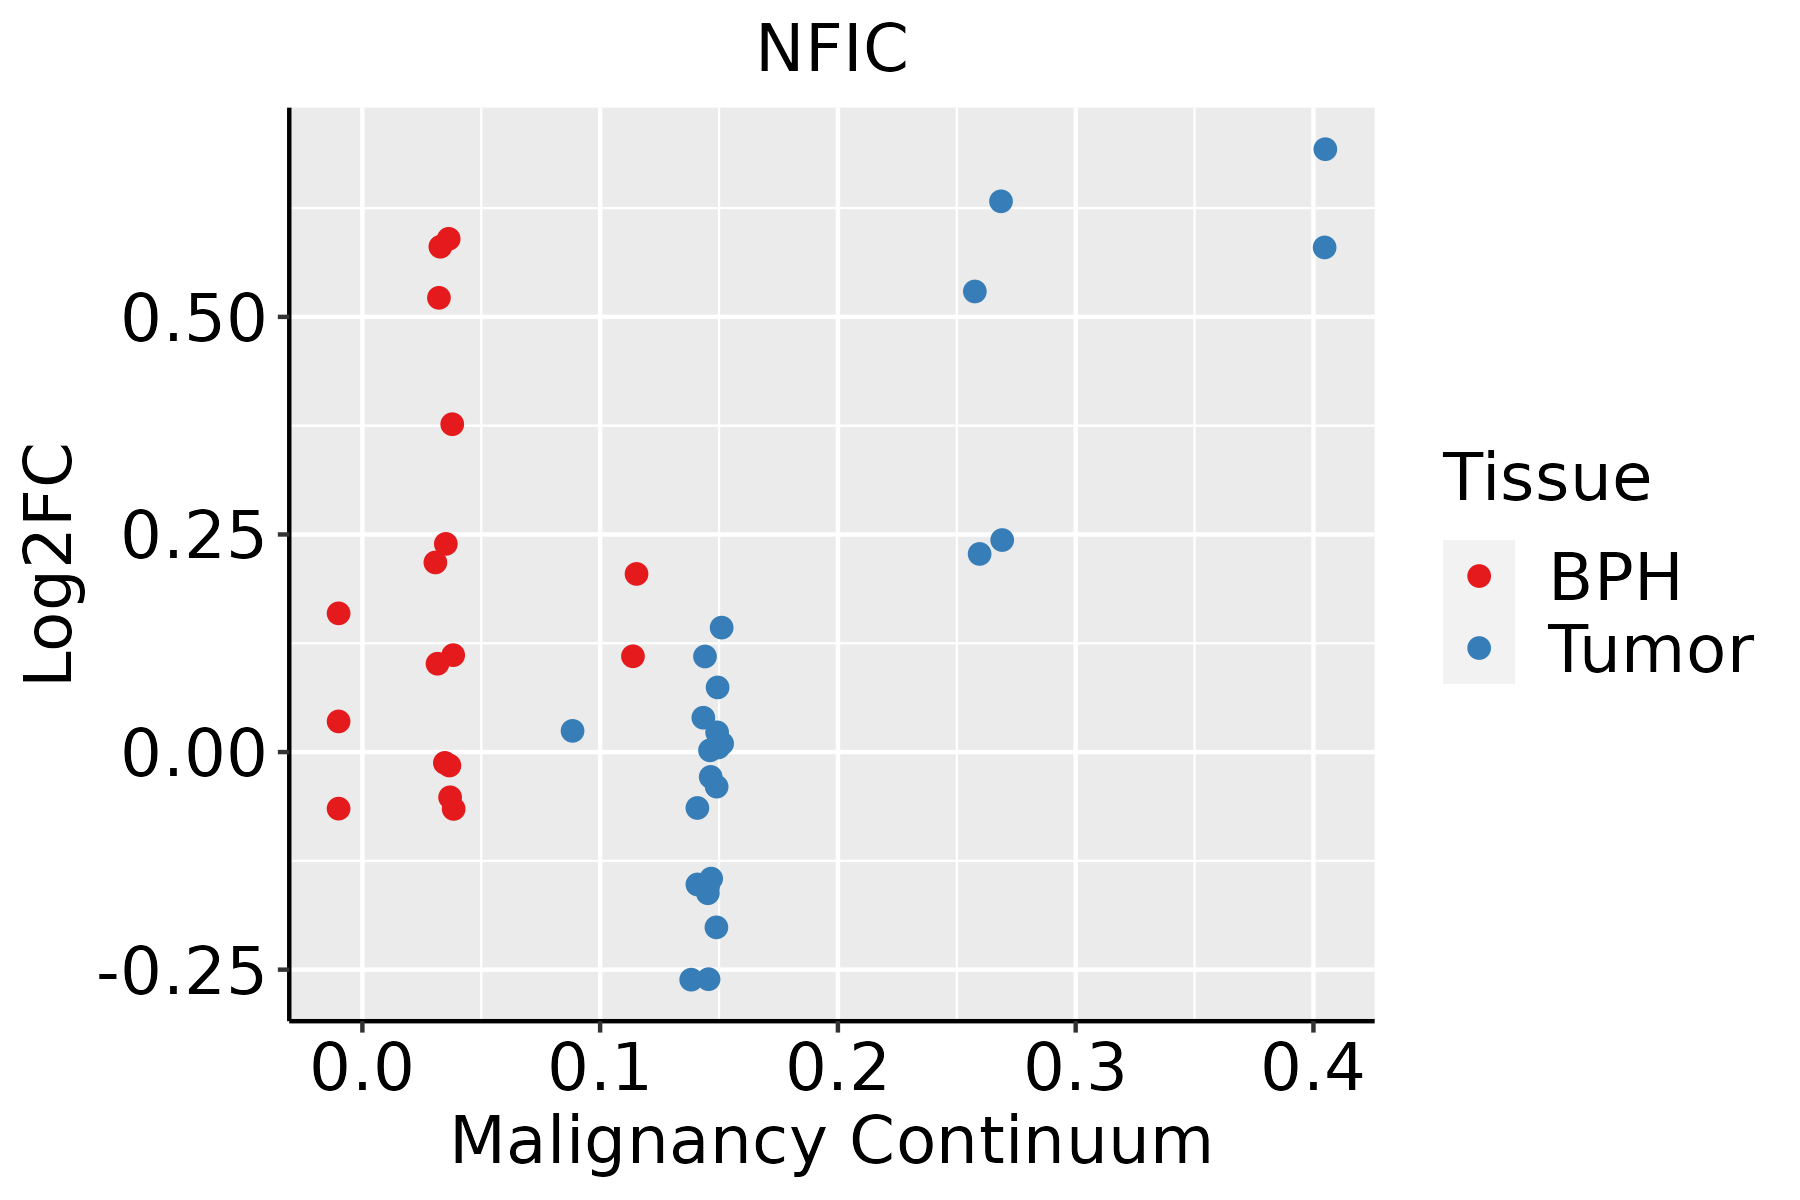 | BPH: Benign Prostatic Hyperplasia |
| Skin |  | AK: Actinic keratosis |
| cSCC: Cutaneous squamous cell carcinoma | ||
| SCCIS:squamous cell carcinoma in situ | ||
| Thyroid | 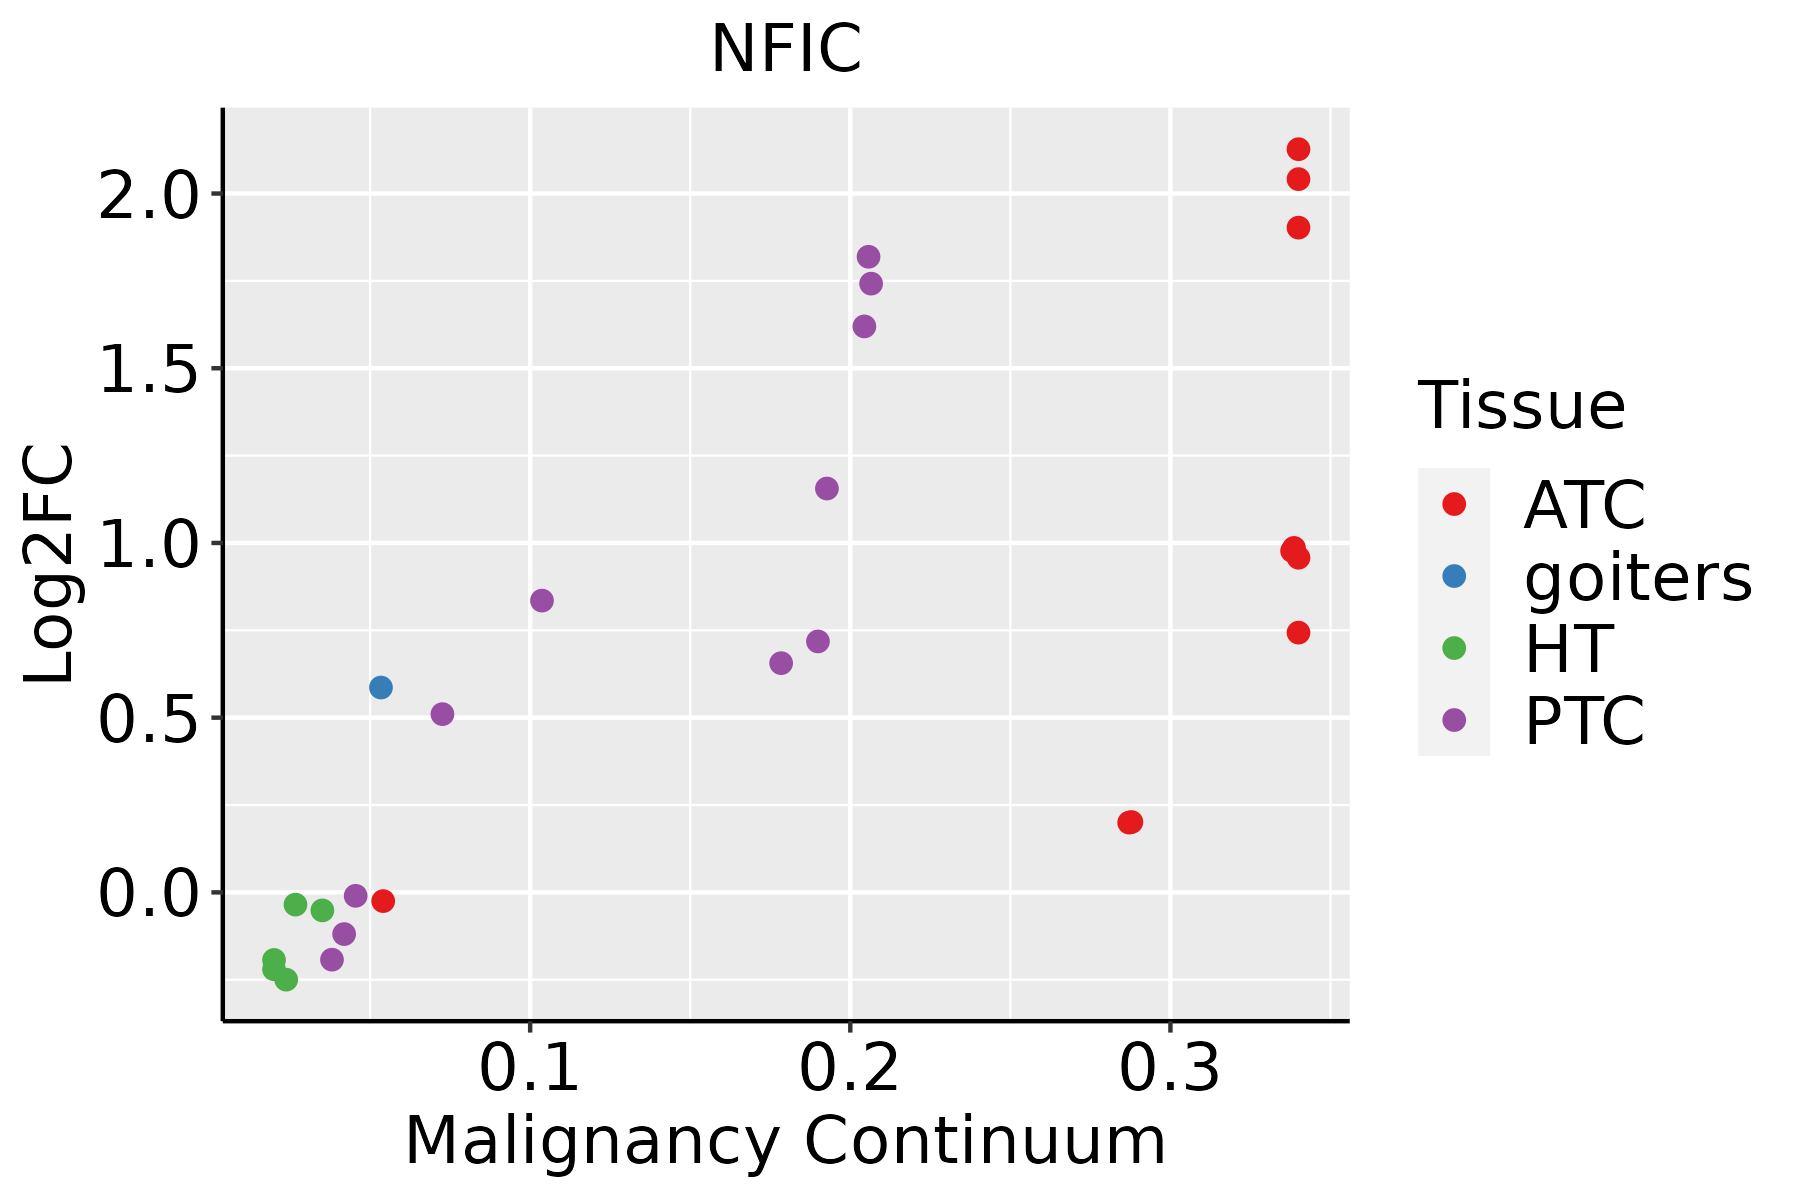 | ATC: Anaplastic thyroid cancer |
| HT: Hashimoto's thyroiditis | ||
| PTC: Papillary thyroid cancer |
| ∗log2FC in expression of this searched gene in stem-like cells from each diseased tissue sample relative to stem-like cells in normal samples in each tissue plotted against the malignancy continuum. Samples are colored based on if they are from different disease stage. |
Top |
Malignant transformation related pathway analysis |
| Find out the enriched GO biological processes and KEGG pathways involved in transition from healthy to precancer to cancer |
| Tissue | Disease Stage | Enriched GO biological Processes |
| Colorectum | AD |  |
| Colorectum | SER |  |
| Colorectum | MSS |  |
| Colorectum | MSI-H |  |
| Colorectum | FAP |  |
| ∗Top 15 enriched GO BP terms are showed in the bar plot of each disease state in each tissue. Each row represents a significant GO biological process which is colored according to the -log10(p.adjust). |
| Page: 1 2 3 4 5 6 7 8 9 |
| GO ID | Tissue | Disease Stage | Description | Gene Ratio | Bg Ratio | pvalue | p.adjust | Count |
| GO:0006260 | Colorectum | MSI-H | DNA replication | 31/1319 | 260/18723 | 2.83e-03 | 3.63e-02 | 31 |
| GO:00062604 | Esophagus | ESCC | DNA replication | 181/8552 | 260/18723 | 3.55e-15 | 2.05e-13 | 181 |
| GO:00062601 | Liver | HCC | DNA replication | 146/7958 | 260/18723 | 5.68e-06 | 7.02e-05 | 146 |
| GO:00062603 | Oral cavity | OSCC | DNA replication | 159/7305 | 260/18723 | 3.25e-13 | 1.59e-11 | 159 |
| GO:000626011 | Oral cavity | LP | DNA replication | 97/4623 | 260/18723 | 3.67e-06 | 7.75e-05 | 97 |
| GO:00062605 | Skin | AK | DNA replication | 40/1910 | 260/18723 | 5.49e-03 | 3.03e-02 | 40 |
| GO:000626012 | Skin | cSCC | DNA replication | 106/4864 | 260/18723 | 1.18e-07 | 2.77e-06 | 106 |
| GO:00062606 | Thyroid | PTC | DNA replication | 114/5968 | 260/18723 | 3.09e-05 | 2.95e-04 | 114 |
| GO:000626013 | Thyroid | ATC | DNA replication | 124/6293 | 260/18723 | 1.58e-06 | 1.93e-05 | 124 |
| Page: 1 |
| Pathway ID | Tissue | Disease Stage | Description | Gene Ratio | Bg Ratio | pvalue | p.adjust | qvalue | Count |
| Page: 1 |
Top |
Cell-cell communication analysis |
| Identification of potential cell-cell interactions between two cell types and their ligand-receptor pairs for different disease states |
| Ligand | Receptor | LRpair | Pathway | Tissue | Disease Stage |
| Page: 1 |
Top |
Single-cell gene regulatory network inference analysis |
| Find out the significant the regulons (TFs) and the target genes of each regulon across cell types for different disease states |
| TF | Cell Type | Tissue | Disease Stage | Target Gene | RSS | Regulon Activity |
| NFIC | MLUM | Breast | ADJ | TPT1,ZBTB16,NFIX, etc. | 2.98e-01 |  |
| NFIC | DC | Cervix | ADJ | NOTCH1,IGFBP6,EPHB2, etc. | 1.49e-01 |  |
| NFIC | TAC | Colorectum | ADJ | AC092683.1,ILF3,NUP210, etc. | 1.76e-01 |  |
| NFIC | ASC | Colorectum | ADJ | AC092683.1,ILF3,NUP210, etc. | 1.29e-01 | |
| NFIC | STM | Colorectum | ADJ | AC092683.1,ILF3,NUP210, etc. | 9.70e-02 | |
| NFIC | MAC | Colorectum | AD | TEX264,YIF1B,C1QB, etc. | 1.11e-01 |  |
| NFIC | MAC | Colorectum | FAP | TEX264,YIF1B,C1QB, etc. | 3.14e-01 |  |
| NFIC | MAC | Colorectum | SER | TEX264,YIF1B,C1QB, etc. | 1.26e-01 |  |
| NFIC | HEP | Liver | NAFLD | PRKCDBP,CXCL2,BUD13, etc. | 7.86e-01 |  |
| NFIC | STM | Lung | Healthy | MED24,DEK,ICAM1, etc. | 1.95e-01 |  |
| ∗The dot plots of a searched regulon are shown for all cell subpopulations in each disease state of each tissue based on the regulon specific score inferred using pySCENIC and by calculating the average expression. |
| Page: 1 2 3 |
Top |
Somatic mutation of malignant transformation related genes |
| Annotation of somatic variants for genes involved in malignant transformation |
| Hugo Symbol | Variant Class | Variant Classification | dbSNP RS | HGVSc | HGVSp | HGVSp Short | SWISSPROT | BIOTYPE | SIFT | PolyPhen | Tumor Sample Barcode | Tissue | Histology | Sex | Age | Stage | Therapy Types | Drugs | Outcome |
| NFIC | SNV | Missense_Mutation | c.1234N>G | p.Leu412Val | p.L412V | P08651 | protein_coding | deleterious(0.04) | probably_damaging(0.994) | TCGA-AR-A0U0-01 | Breast | breast invasive carcinoma | Female | >=65 | I/II | Unknown | Unknown | SD | |
| NFIC | SNV | Missense_Mutation | c.515N>T | p.Ala172Val | p.A172V | P08651 | protein_coding | tolerated(0.06) | benign(0.19) | TCGA-BH-A0B5-01 | Breast | breast invasive carcinoma | Female | <65 | III/IV | Chemotherapy | adriamycin | CR | |
| NFIC | SNV | Missense_Mutation | rs564835230 | c.1438N>A | p.Asp480Asn | p.D480N | P08651 | protein_coding | deleterious(0.01) | benign(0) | TCGA-BH-A1F8-01 | Breast | breast invasive carcinoma | Female | >=65 | III/IV | Unknown | Unknown | PD |
| NFIC | deletion | Frame_Shift_Del | novel | c.298delN | p.Lys100ArgfsTer141 | p.K100Rfs*141 | P08651 | protein_coding | TCGA-EW-A2FV-01 | Breast | breast invasive carcinoma | Female | <65 | III/IV | Chemotherapy | docetaxel | SD | ||
| NFIC | SNV | Missense_Mutation | c.44N>T | p.Pro15Leu | p.P15L | P08651 | protein_coding | deleterious(0) | probably_damaging(0.999) | TCGA-2W-A8YY-01 | Cervix | cervical & endocervical cancer | Female | <65 | I/II | Chemotherapy | cisplatin | CR | |
| NFIC | SNV | Missense_Mutation | novel | c.210N>C | p.Gln70His | p.Q70H | P08651 | protein_coding | deleterious(0.01) | probably_damaging(0.996) | TCGA-HM-A4S6-01 | Cervix | cervical & endocervical cancer | Female | <65 | III/IV | Chemotherapy | cisplatin | CR |
| NFIC | SNV | Missense_Mutation | novel | c.857N>T | p.Ser286Leu | p.S286L | P08651 | protein_coding | deleterious(0) | probably_damaging(0.994) | TCGA-VS-A8EL-01 | Cervix | cervical & endocervical cancer | Female | <65 | I/II | Chemotherapy | cisplatin | CR |
| NFIC | SNV | Missense_Mutation | novel | c.725G>A | p.Gly242Glu | p.G242E | P08651 | protein_coding | deleterious(0.01) | probably_damaging(0.934) | TCGA-ZJ-AAXB-01 | Cervix | cervical & endocervical cancer | Female | <65 | I/II | Unknown | Unknown | SD |
| NFIC | SNV | Missense_Mutation | c.919N>T | p.Thr307Ser | p.T307S | P08651 | protein_coding | tolerated(0.71) | benign(0.138) | TCGA-A6-4105-01 | Colorectum | colon adenocarcinoma | Male | >=65 | I/II | Unknown | Unknown | PD | |
| NFIC | SNV | Missense_Mutation | rs757507471 | c.706N>T | p.Arg236Trp | p.R236W | P08651 | protein_coding | deleterious(0) | possibly_damaging(0.745) | TCGA-AA-3492-01 | Colorectum | colon adenocarcinoma | Female | >=65 | I/II | Unknown | Unknown | SD |
| Page: 1 2 3 4 5 6 |
Top |
Related drugs of malignant transformation related genes |
| Identification of chemicals and drugs interact with genes involved in malignant transfromation |
| (DGIdb 4.0) |
| Entrez ID | Symbol | Category | Interaction Types | Drug Claim Name | Drug Name | PMIDs |
| Page: 1 |

Copyright 2023-Present -The University of Texas Health Science Center at Houston |