| Tissue | Expression Dynamics | Abbreviation |
| Breast | 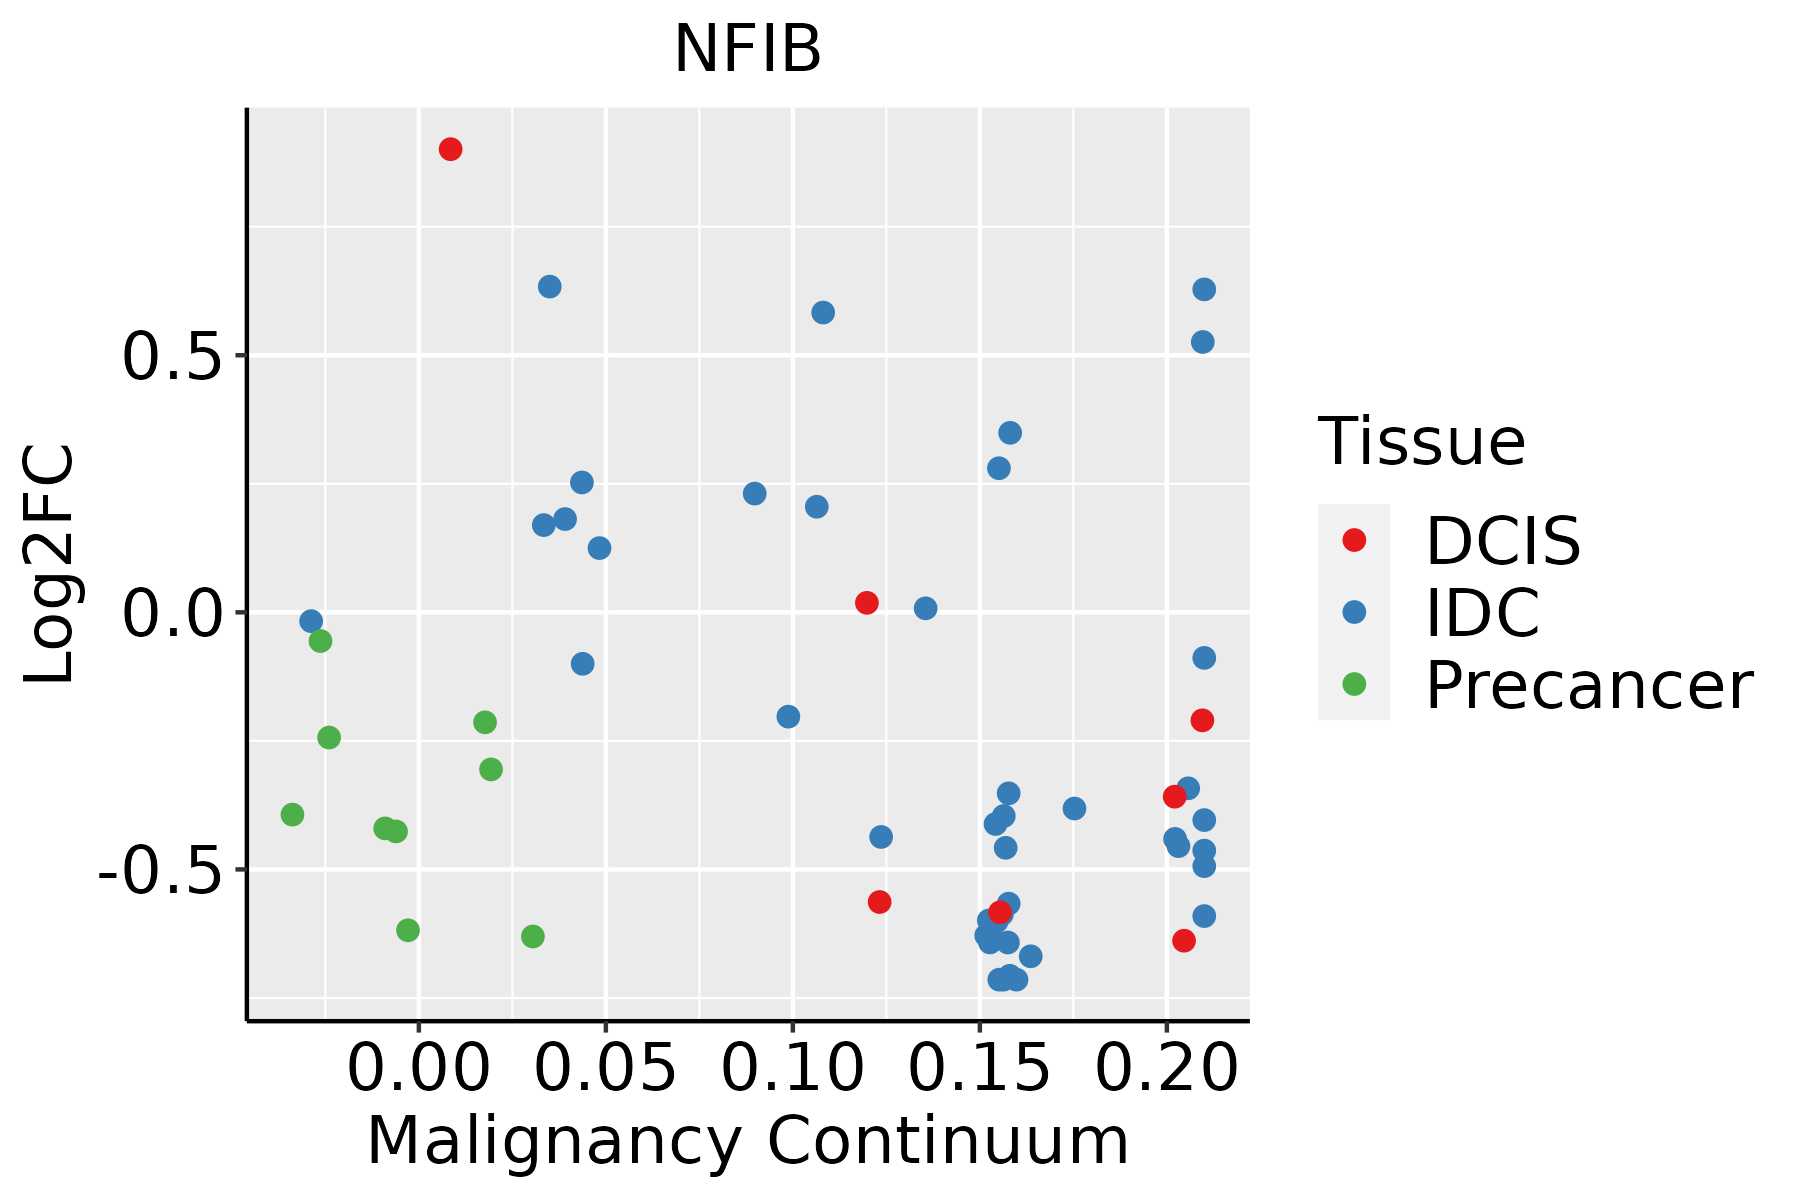 | IDC: Invasive ductal carcinoma |
| DCIS: Ductal carcinoma in situ |
| Precancer(BRCA1-mut): Precancerous lesion from BRCA1 mutation carriers |
| Cervix | 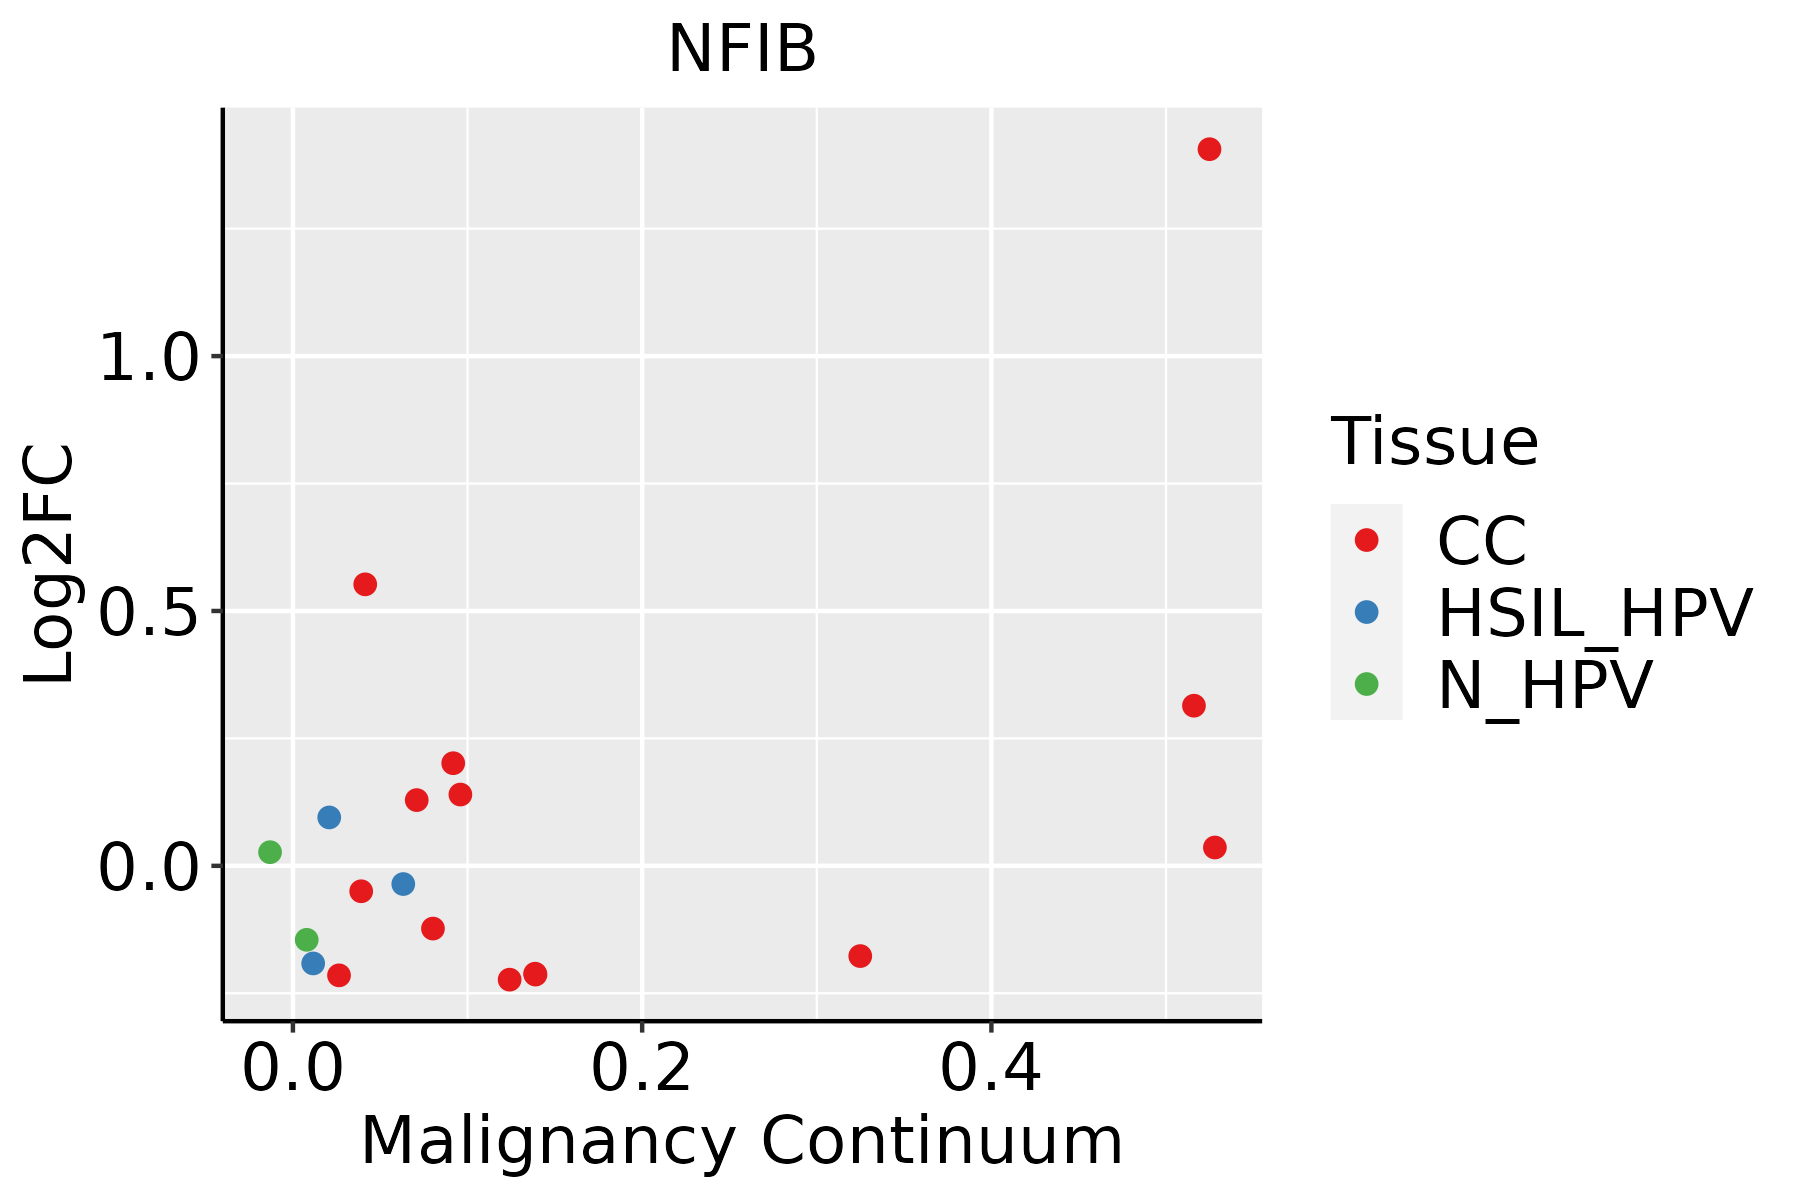 | CC: Cervix cancer |
| HSIL_HPV: HPV-infected high-grade squamous intraepithelial lesions |
| N_HPV: HPV-infected normal cervix |
| Colorectum (GSE201348) |  | FAP: Familial adenomatous polyposis |
| CRC: Colorectal cancer |
| Colorectum (HTA11) |  | AD: Adenomas |
| SER: Sessile serrated lesions |
| MSI-H: Microsatellite-high colorectal cancer |
| MSS: Microsatellite stable colorectal cancer |
| Endometrium | 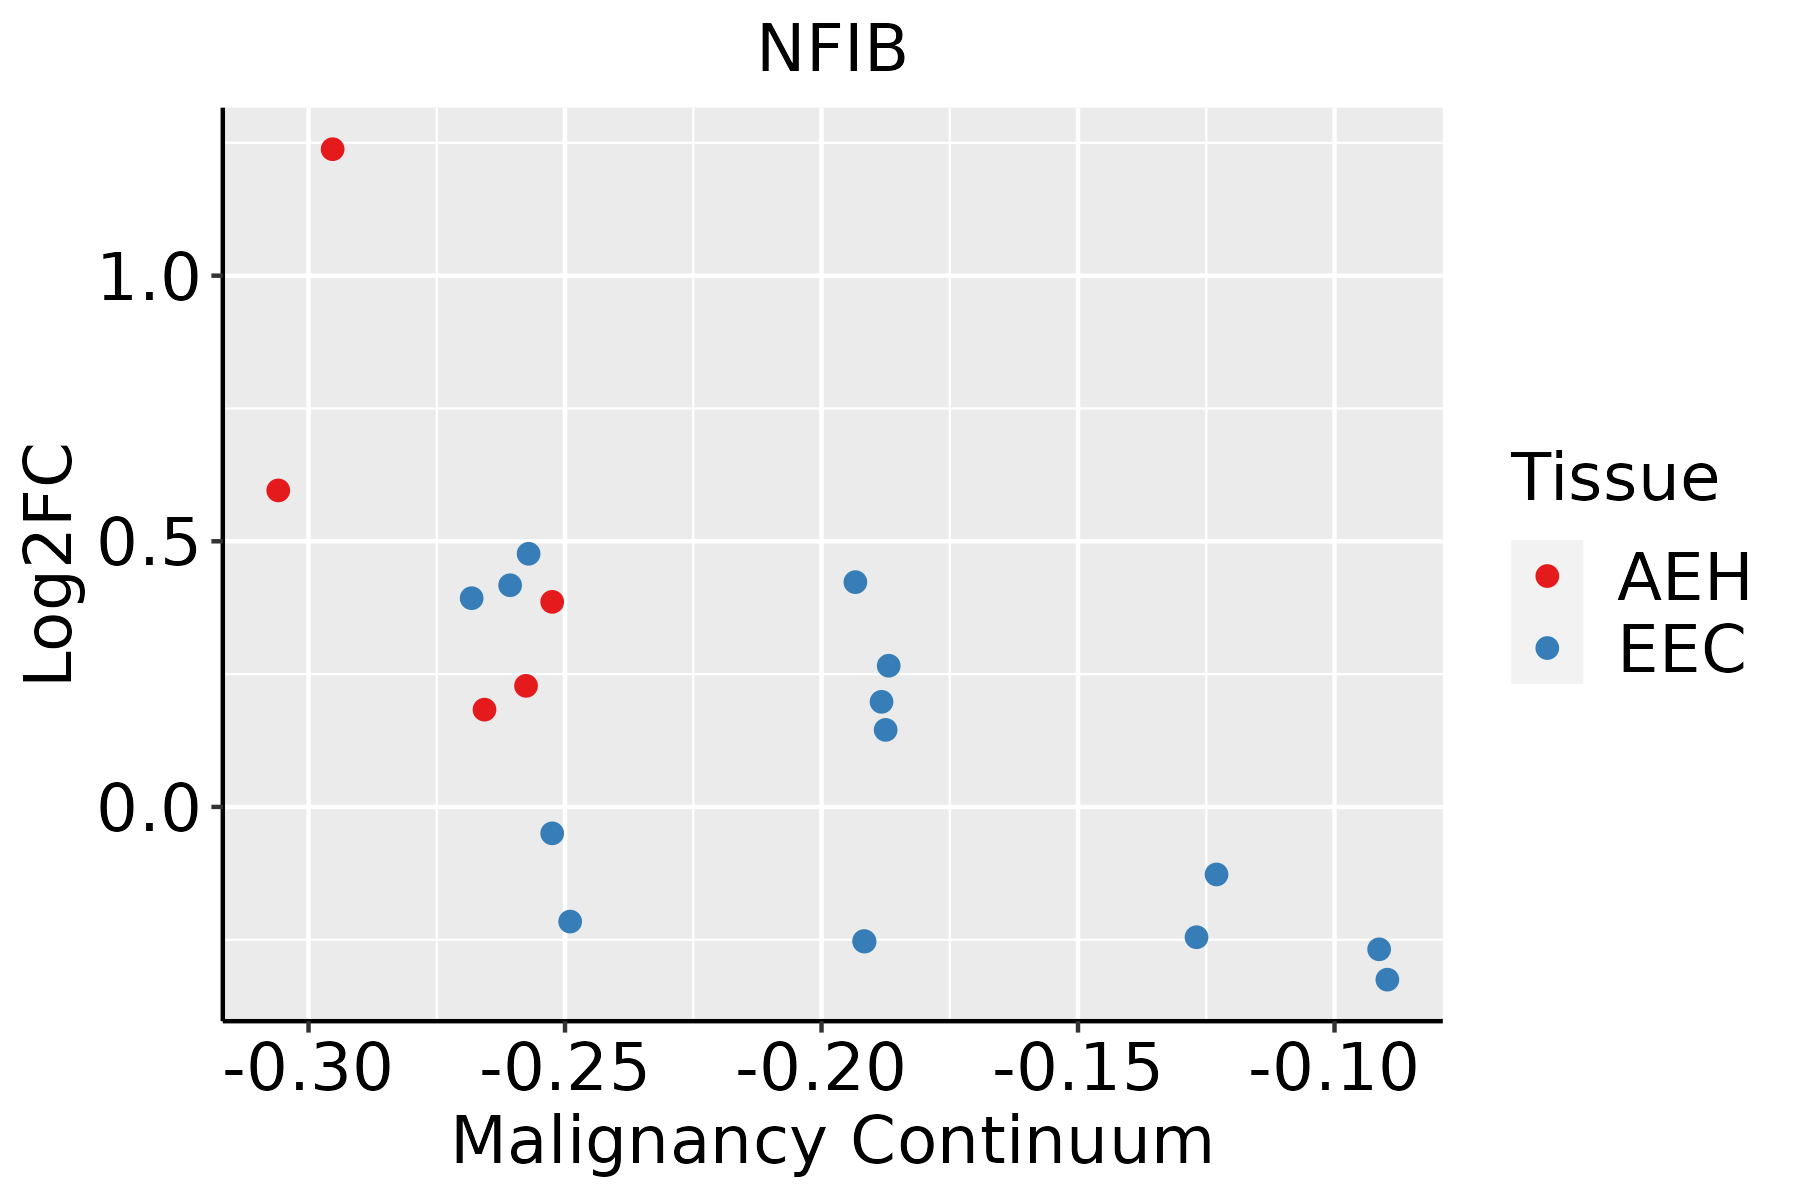 | AEH: Atypical endometrial hyperplasia |
| EEC: Endometrioid Cancer |
| Esophagus |  | ESCC: Esophageal squamous cell carcinoma |
| HGIN: High-grade intraepithelial neoplasias |
| LGIN: Low-grade intraepithelial neoplasias |
| GC | 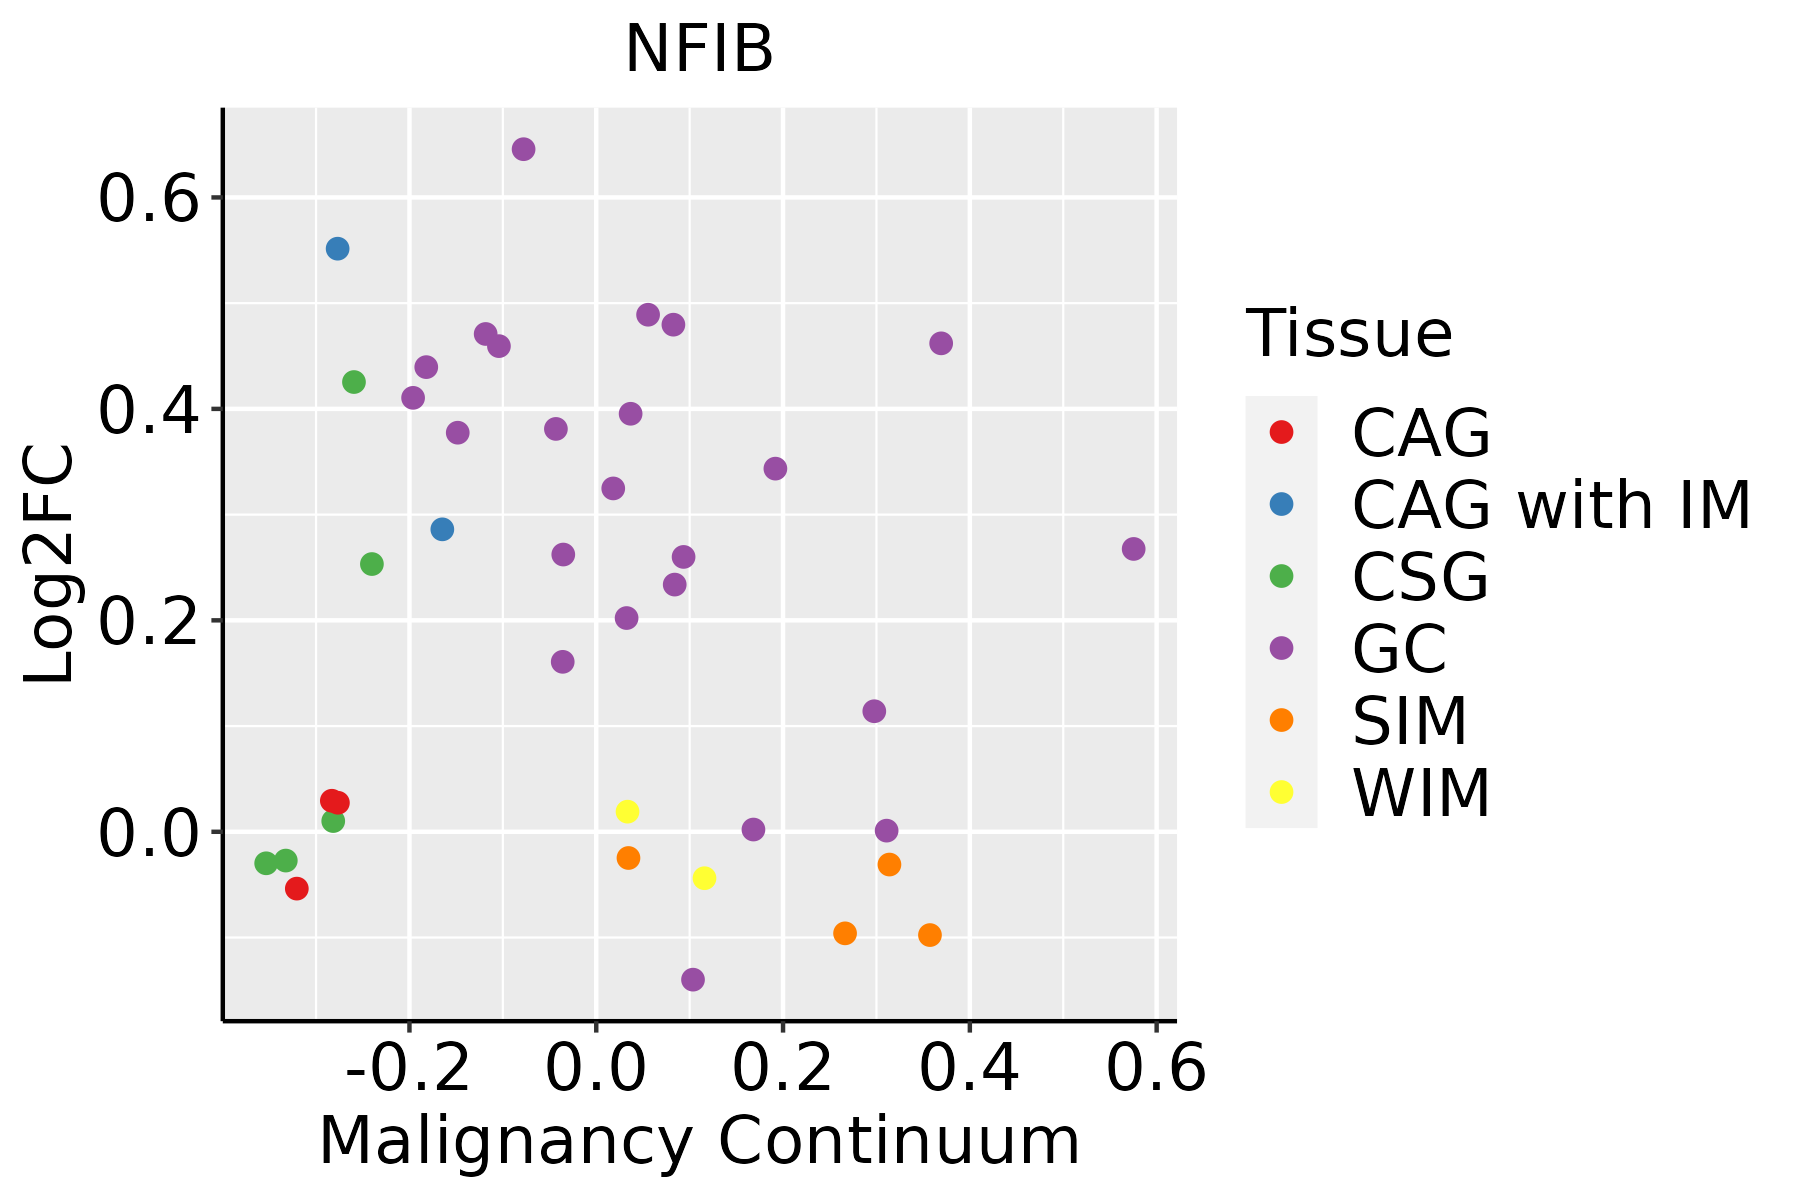 | CAG: Chronic atrophic gastritis |
| CAG with IM: Chronic atrophic gastritis with intestinal metaplasia |
| CSG: Chronic superficial gastritis |
| GC: Gastric cancer |
| SIM: Severe intestinal metaplasia |
| WIM: Wild intestinal metaplasia |
| Liver | 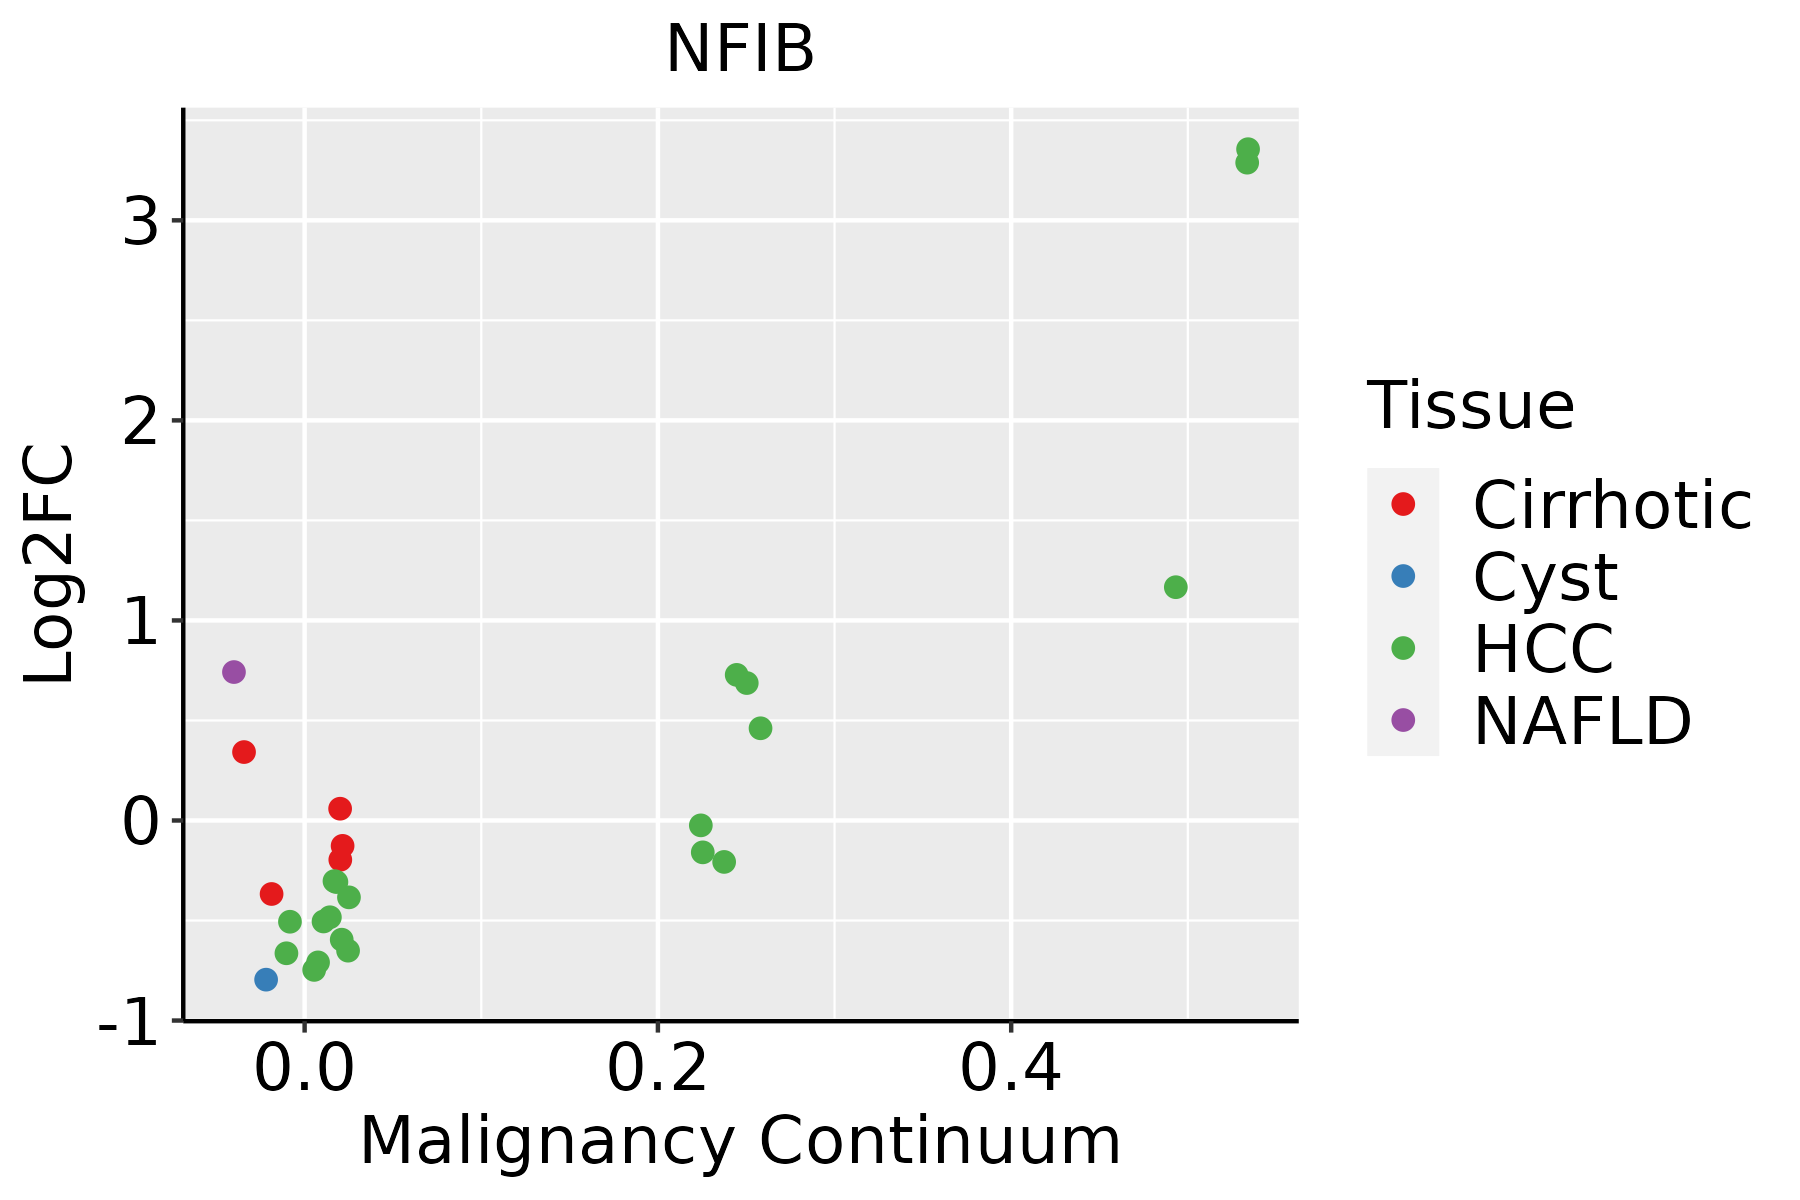 | HCC: Hepatocellular carcinoma |
| NAFLD: Non-alcoholic fatty liver disease |
| Lung |  | AAH: Atypical adenomatous hyperplasia |
| AIS: Adenocarcinoma in situ |
| IAC: Invasive lung adenocarcinoma |
| MIA: Minimally invasive adenocarcinoma |
| Oral Cavity | 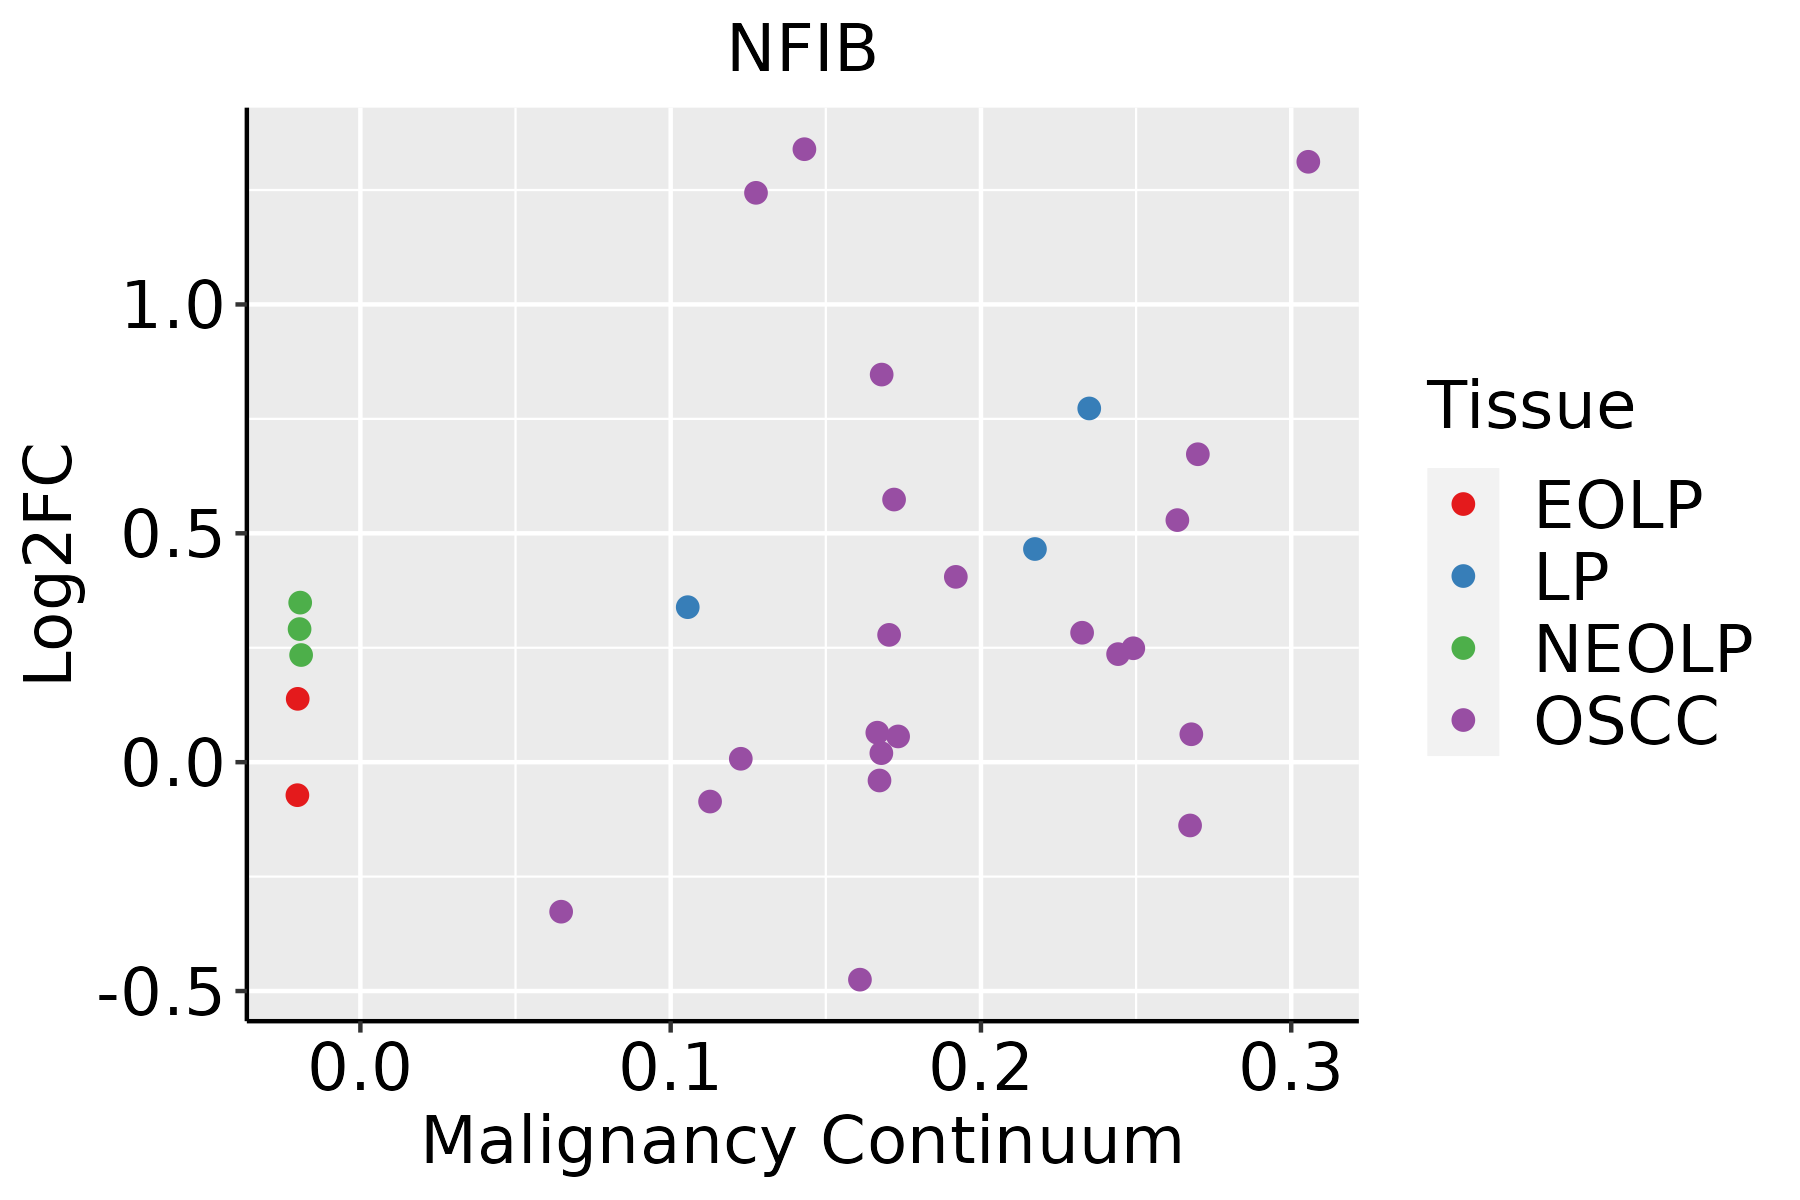 | EOLP: Erosive Oral lichen planus |
| LP: leukoplakia |
| NEOLP: Non-erosive oral lichen planus |
| OSCC: Oral squamous cell carcinoma |
| Prostate | 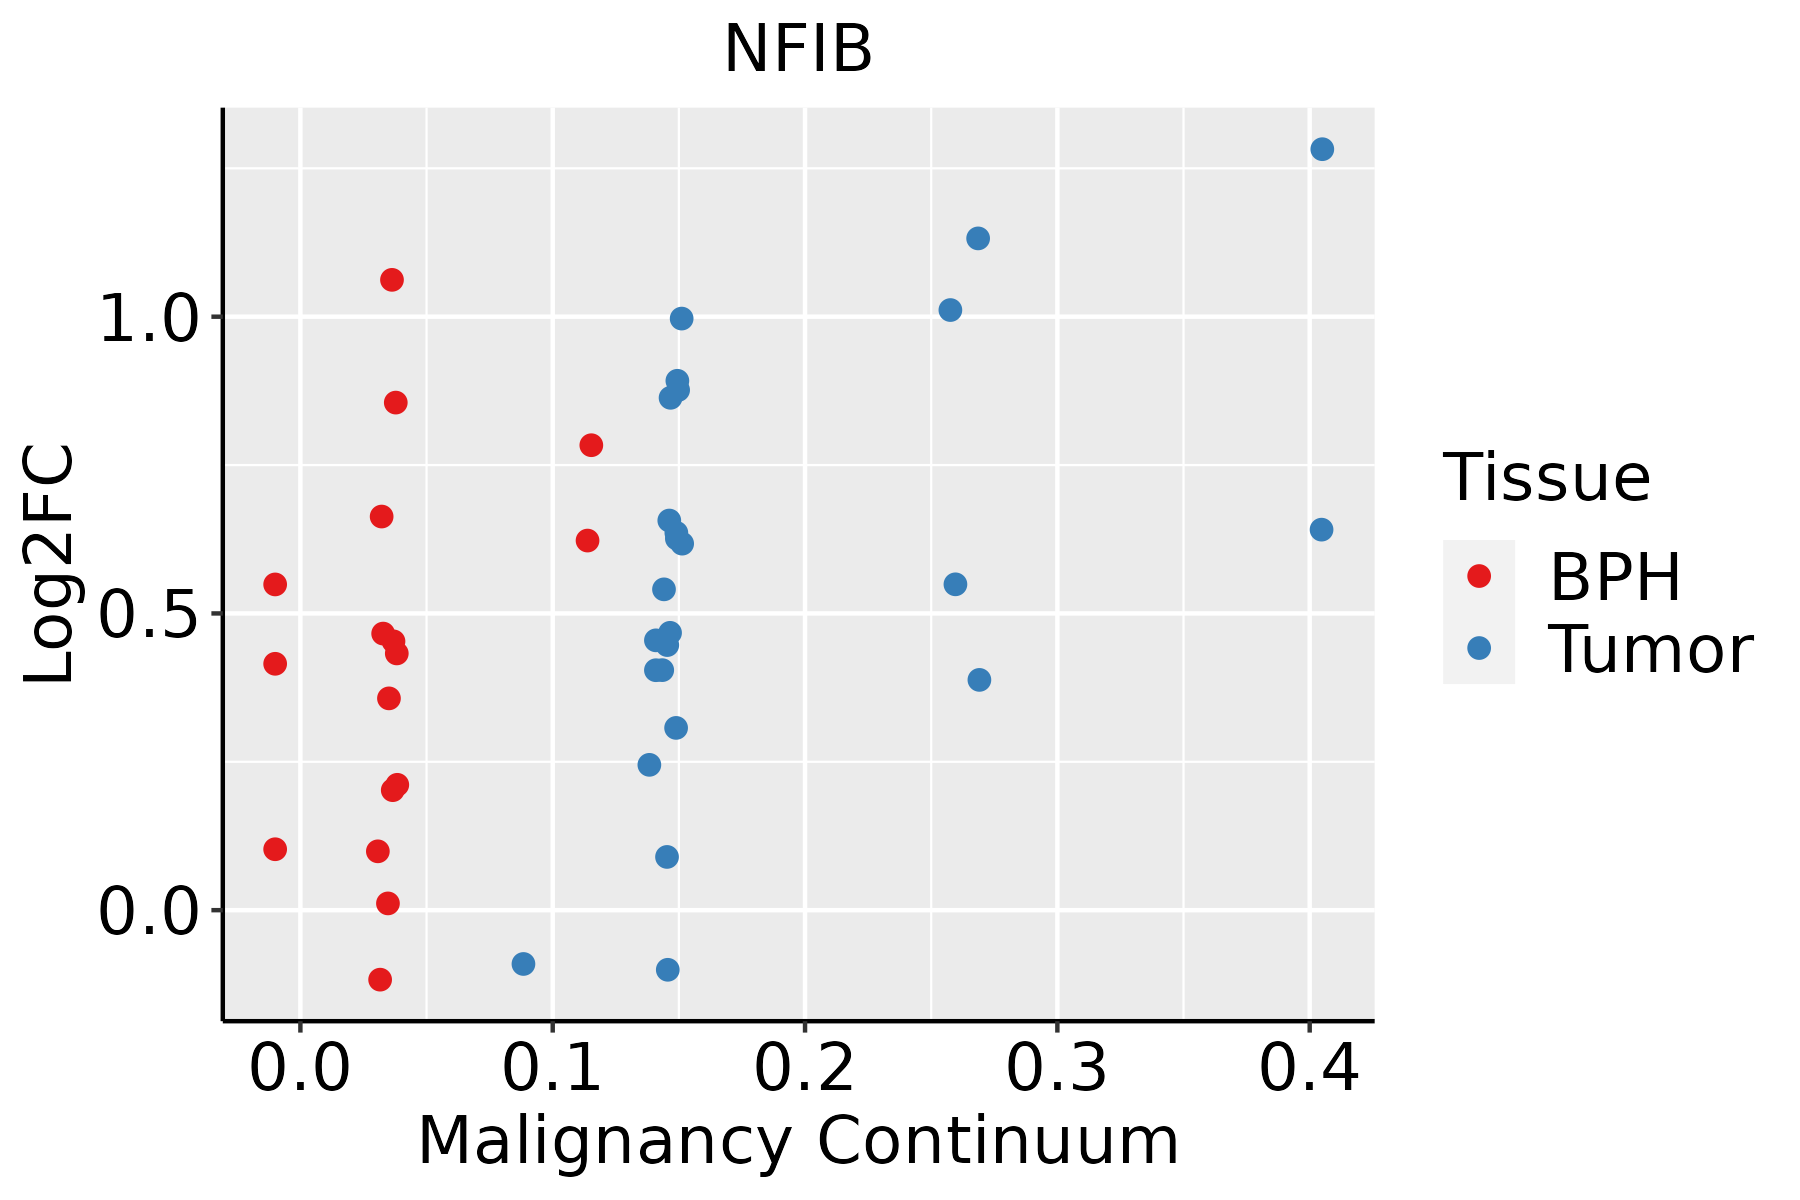 | BPH: Benign Prostatic Hyperplasia |
| Skin | 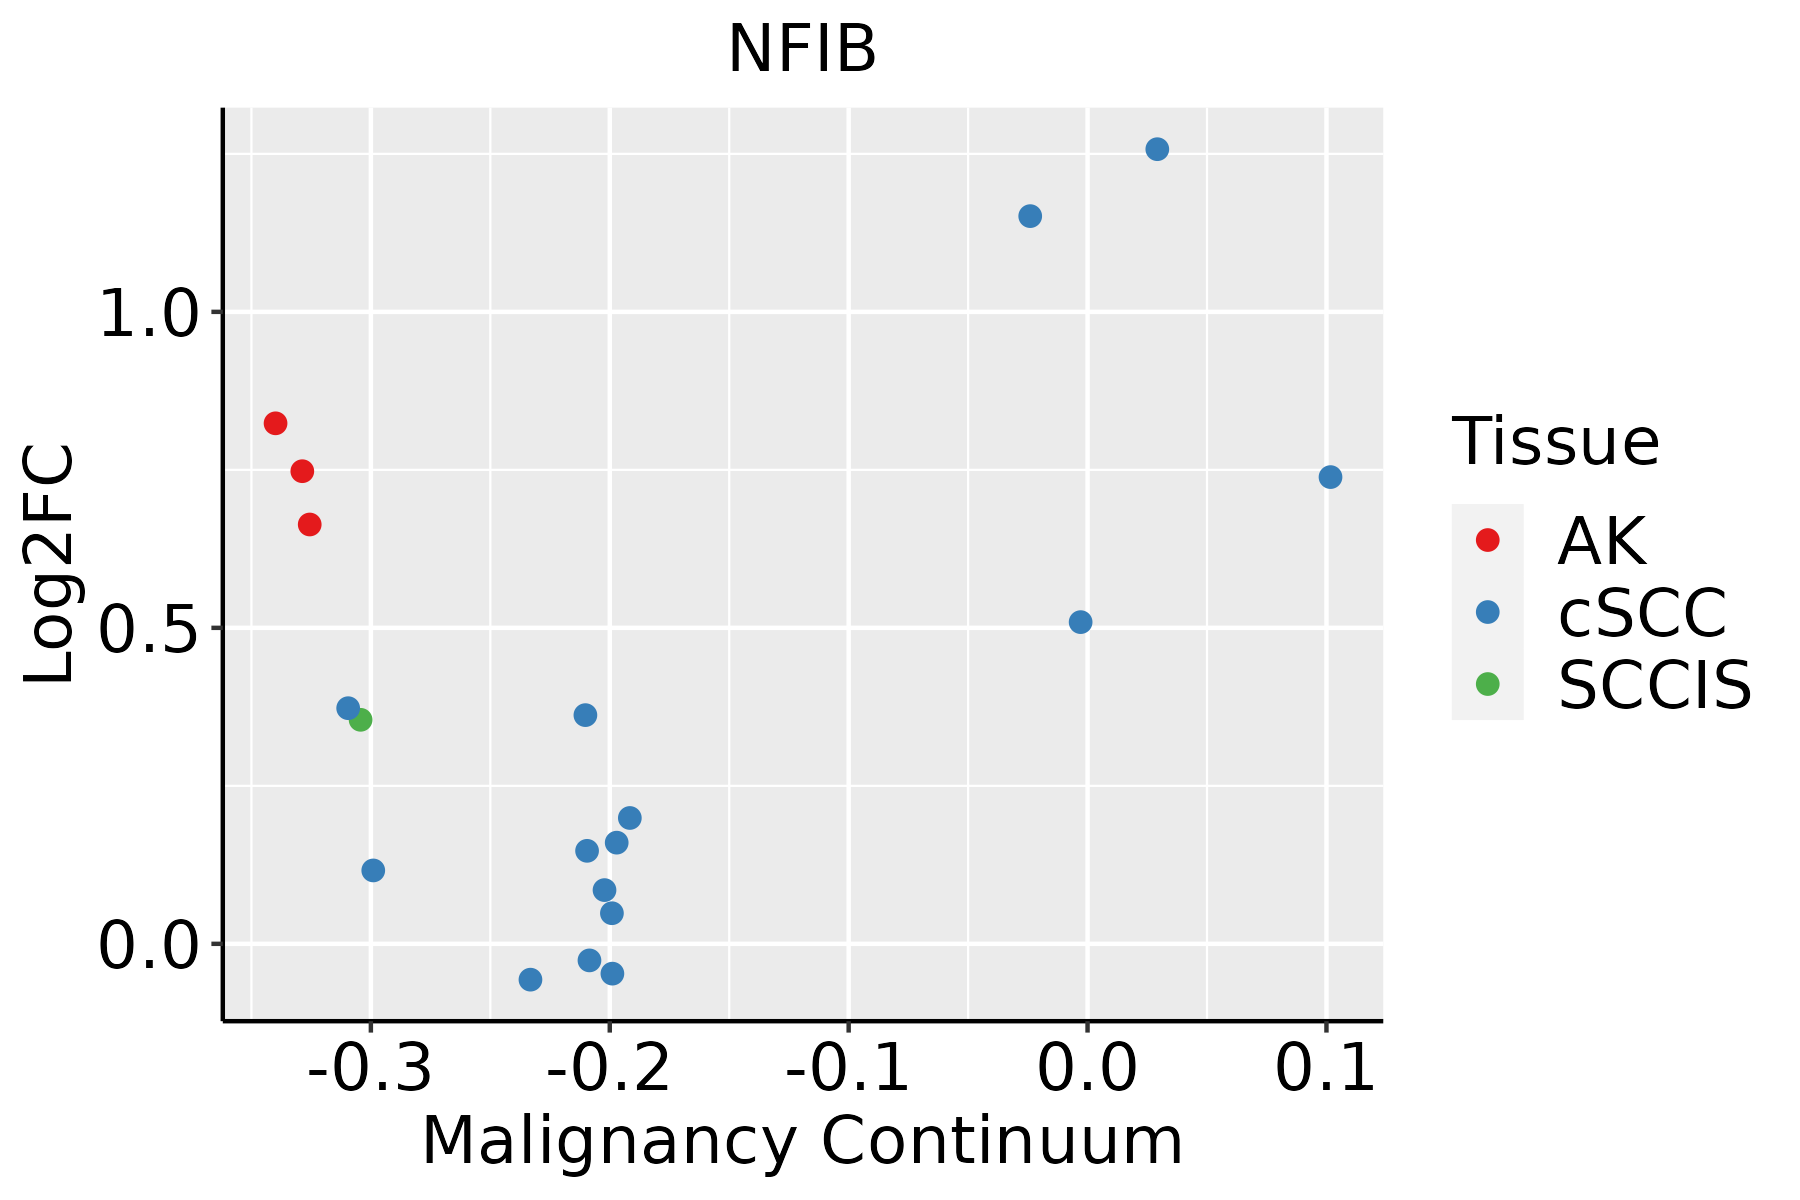 | AK: Actinic keratosis |
| cSCC: Cutaneous squamous cell carcinoma |
| SCCIS:squamous cell carcinoma in situ |
| Thyroid |  | ATC: Anaplastic thyroid cancer |
| HT: Hashimoto's thyroiditis |
| PTC: Papillary thyroid cancer |
| GO ID | Tissue | Disease Stage | Description | Gene Ratio | Bg Ratio | pvalue | p.adjust | Count |
| GO:00488578 | Breast | Precancer | neural nucleus development | 16/1080 | 64/18723 | 4.76e-07 | 2.11e-05 | 16 |
| GO:00487329 | Breast | Precancer | gland development | 49/1080 | 436/18723 | 6.11e-06 | 1.73e-04 | 49 |
| GO:00506736 | Breast | Precancer | epithelial cell proliferation | 46/1080 | 437/18723 | 6.02e-05 | 1.23e-03 | 46 |
| GO:00506786 | Breast | Precancer | regulation of epithelial cell proliferation | 40/1080 | 381/18723 | 1.88e-04 | 3.03e-03 | 40 |
| GO:00420633 | Breast | Precancer | gliogenesis | 33/1080 | 301/18723 | 3.06e-04 | 4.40e-03 | 33 |
| GO:00351486 | Breast | Precancer | tube formation | 19/1080 | 148/18723 | 8.79e-04 | 1.01e-02 | 19 |
| GO:00100013 | Breast | Precancer | glial cell differentiation | 25/1080 | 225/18723 | 1.29e-03 | 1.37e-02 | 25 |
| GO:00604792 | Breast | Precancer | lung cell differentiation | 6/1080 | 24/18723 | 1.99e-03 | 1.90e-02 | 6 |
| GO:004885713 | Breast | IDC | neural nucleus development | 21/1434 | 64/18723 | 5.35e-09 | 4.28e-07 | 21 |
| GO:004873214 | Breast | IDC | gland development | 64/1434 | 436/18723 | 3.47e-07 | 1.74e-05 | 64 |
| GO:005067313 | Breast | IDC | epithelial cell proliferation | 60/1434 | 437/18723 | 7.13e-06 | 2.15e-04 | 60 |
| GO:005067812 | Breast | IDC | regulation of epithelial cell proliferation | 54/1434 | 381/18723 | 8.07e-06 | 2.39e-04 | 54 |
| GO:00303244 | Breast | IDC | lung development | 28/1434 | 177/18723 | 1.90e-04 | 3.15e-03 | 28 |
| GO:00303234 | Breast | IDC | respiratory tube development | 28/1434 | 181/18723 | 2.78e-04 | 4.26e-03 | 28 |
| GO:00605412 | Breast | IDC | respiratory system development | 30/1434 | 203/18723 | 3.85e-04 | 5.40e-03 | 30 |
| GO:00226127 | Breast | IDC | gland morphogenesis | 20/1434 | 118/18723 | 6.13e-04 | 7.69e-03 | 20 |
| GO:004206311 | Breast | IDC | gliogenesis | 39/1434 | 301/18723 | 8.63e-04 | 1.00e-02 | 39 |
| GO:003514812 | Breast | IDC | tube formation | 23/1434 | 148/18723 | 8.79e-04 | 1.02e-02 | 23 |
| GO:00104644 | Breast | IDC | regulation of mesenchymal cell proliferation | 8/1434 | 28/18723 | 9.00e-04 | 1.04e-02 | 8 |
| GO:00100011 | Breast | IDC | glial cell differentiation | 31/1434 | 225/18723 | 1.04e-03 | 1.15e-02 | 31 |
| TF | Cell Type | Tissue | Disease Stage | Target Gene | RSS | Regulon Activity |
| NFIB | BMEM | Breast | ADJ | FABP4,KRT17,SPARCL1, etc. | 3.09e-01 |  |
| NFIB | NK | Breast | DCIS | FABP4,KRT17,SPARCL1, etc. | 1.26e-01 |  |
| NFIB | BMEM | Breast | Healthy | FABP4,KRT17,SPARCL1, etc. | 1.95e-01 |  |
| NFIB | NK | Breast | Healthy | FABP4,KRT17,SPARCL1, etc. | 1.29e-01 | |
| NFIB | NK | Breast | IDC | FABP4,KRT17,SPARCL1, etc. | 9.71e-02 |  |
| NFIB | BMEM | Breast | IDC | FABP4,KRT17,SPARCL1, etc. | 9.32e-02 | |
| NFIB | BMEM | Breast | Precancer | FABP4,KRT17,SPARCL1, etc. | 1.83e-01 |  |
| NFIB | DC | Cervix | CC | ADIRF,C12orf75,SSBP2, etc. | 1.08e-01 |  |
| NFIB | MAIT | Cervix | CC | ADIRF,C12orf75,SSBP2, etc. | 6.74e-02 | |
| NFIB | BMEM | Cervix | CC | ADIRF,C12orf75,SSBP2, etc. | 8.11e-02 | |
| Hugo Symbol | Variant Class | Variant Classification | dbSNP RS | HGVSc | HGVSp | HGVSp Short | SWISSPROT | BIOTYPE | SIFT | PolyPhen | Tumor Sample Barcode | Tissue | Histology | Sex | Age | Stage | Therapy Types | Drugs | Outcome |
| NFIB | SNV | Missense_Mutation | novel | c.580A>C | p.Ser194Arg | p.S194R | O00712 | protein_coding | tolerated(0.12) | probably_damaging(0.944) | TCGA-E2-A14V-01 | Breast | breast invasive carcinoma | Female | <65 | I/II | Chemotherapy | cyclophosphamide | SD |
| NFIB | SNV | Missense_Mutation | | c.862G>C | p.Asp288His | p.D288H | O00712 | protein_coding | deleterious(0.04) | probably_damaging(0.956) | TCGA-E2-A159-01 | Breast | breast invasive carcinoma | Female | <65 | I/II | Chemotherapy | cyclophosphamide | SD |
| NFIB | insertion | Nonsense_Mutation | novel | c.1112_1113insTTTTATATCATTGTATGACCTCTGAAATTTTAGATGCTTTAC | p.Gln371delinsHisPheIleSerLeuTyrAspLeuTerAsnPheArgCysPheThr | p.Q371delinsHFISLYDL*NFRCFT | O00712 | protein_coding | | | TCGA-A8-A07J-01 | Breast | breast invasive carcinoma | Female | <65 | I/II | Chemotherapy | 5-fluorouracil | CR |
| NFIB | insertion | Frame_Shift_Ins | novel | c.166_167insTTCATTA | p.Ala56ValfsTer7 | p.A56Vfs*7 | O00712 | protein_coding | | | TCGA-AO-A0J7-01 | Breast | breast invasive carcinoma | Female | >=65 | I/II | Chemotherapy | doxorubicin | SD |
| NFIB | insertion | Nonsense_Mutation | novel | c.165_166insCATAGGGTAGTCTAACAAATATA | p.Ala56HisfsTer5 | p.A56Hfs*5 | O00712 | protein_coding | | | TCGA-AO-A0J7-01 | Breast | breast invasive carcinoma | Female | >=65 | I/II | Chemotherapy | doxorubicin | SD |
| NFIB | insertion | Frame_Shift_Ins | novel | c.1105_1106insTTTGGGG | p.Pro369LeufsTer41 | p.P369Lfs*41 | O00712 | protein_coding | | | TCGA-AR-A0U0-01 | Breast | breast invasive carcinoma | Female | >=65 | I/II | Unknown | Unknown | SD |
| NFIB | deletion | Frame_Shift_Del | novel | c.1127delC | p.Pro376GlnfsTer18 | p.P376Qfs*18 | O00712 | protein_coding | | | TCGA-EW-A2FV-01 | Breast | breast invasive carcinoma | Female | <65 | III/IV | Chemotherapy | docetaxel | SD |
| NFIB | SNV | Missense_Mutation | novel | c.812N>A | p.Arg271Lys | p.R271K | O00712 | protein_coding | deleterious(0.01) | probably_damaging(0.92) | TCGA-2W-A8YY-01 | Cervix | cervical & endocervical cancer | Female | <65 | I/II | Chemotherapy | cisplatin | CR |
| NFIB | SNV | Missense_Mutation | novel | c.1270N>A | p.Gly424Arg | p.G424R | O00712 | protein_coding | deleterious_low_confidence(0.03) | probably_damaging(0.979) | TCGA-4J-AA1J-01 | Cervix | cervical & endocervical cancer | Female | <65 | I/II | Unknown | Unknown | SD |
| NFIB | SNV | Missense_Mutation | | c.305C>A | p.Pro102Gln | p.P102Q | O00712 | protein_coding | deleterious(0.02) | probably_damaging(0.982) | TCGA-C5-A901-01 | Cervix | cervical & endocervical cancer | Female | <65 | I/II | Unknown | Unknown | SD |


