
|
|||||
|
 | |
| |
| |
| |
| |
| |
|
Gene: NFIA |
Gene summary for NFIA |
| Gene information | Species | Human | Gene symbol | NFIA | Gene ID | 4774 |
| Gene name | nuclear factor I A | |
| Gene Alias | BRMUTD | |
| Cytomap | 1p31.3 | |
| Gene Type | protein-coding | GO ID | GO:0001655 | UniProtAcc | Q12857 |
Top |
Malignant transformation analysis |
| Identification of the aberrant gene expression in precancerous and cancerous lesions by comparing the gene expression of stem-like cells in diseased tissues with normal stem cells |
| Entrez ID | Symbol | Replicates | Species | Organ | Tissue | Adj P-value | Log2FC | Malignancy |
| 4774 | NFIA | GSM4909281 | Human | Breast | IDC | 1.35e-07 | -3.11e-01 | 0.21 |
| 4774 | NFIA | GSM4909282 | Human | Breast | IDC | 6.86e-03 | -2.94e-01 | -0.0288 |
| 4774 | NFIA | GSM4909286 | Human | Breast | IDC | 5.35e-08 | 2.12e-01 | 0.1081 |
| 4774 | NFIA | GSM4909293 | Human | Breast | IDC | 9.04e-19 | 4.33e-01 | 0.1581 |
| 4774 | NFIA | GSM4909296 | Human | Breast | IDC | 3.50e-03 | 3.07e-02 | 0.1524 |
| 4774 | NFIA | GSM4909298 | Human | Breast | IDC | 5.68e-25 | 5.37e-01 | 0.1551 |
| 4774 | NFIA | GSM4909299 | Human | Breast | IDC | 6.12e-04 | 2.32e-01 | 0.035 |
| 4774 | NFIA | GSM4909304 | Human | Breast | IDC | 9.31e-26 | 5.55e-01 | 0.1636 |
| 4774 | NFIA | GSM4909308 | Human | Breast | IDC | 3.13e-05 | 3.47e-01 | 0.158 |
| 4774 | NFIA | GSM4909311 | Human | Breast | IDC | 2.60e-11 | -1.57e-01 | 0.1534 |
| 4774 | NFIA | GSM4909312 | Human | Breast | IDC | 6.42e-06 | 2.74e-01 | 0.1552 |
| 4774 | NFIA | GSM4909319 | Human | Breast | IDC | 2.60e-15 | -2.19e-01 | 0.1563 |
| 4774 | NFIA | GSM4909321 | Human | Breast | IDC | 1.75e-03 | -1.45e-01 | 0.1559 |
| 4774 | NFIA | ctrl6 | Human | Breast | Precancer | 6.40e-05 | -3.21e-01 | -0.0061 |
| 4774 | NFIA | brca1 | Human | Breast | Precancer | 2.16e-02 | -2.69e-01 | -0.0338 |
| 4774 | NFIA | brca10 | Human | Breast | Precancer | 4.93e-13 | -3.27e-01 | -0.0029 |
| 4774 | NFIA | M5 | Human | Breast | IDC | 5.67e-06 | 8.00e-01 | 0.1598 |
| 4774 | NFIA | NCCBC5 | Human | Breast | DCIS | 1.06e-04 | -1.90e-01 | 0.2046 |
| 4774 | NFIA | P1 | Human | Breast | IDC | 1.33e-10 | -1.06e-01 | 0.1527 |
| 4774 | NFIA | DCIS2 | Human | Breast | DCIS | 9.04e-46 | 9.87e-02 | 0.0085 |
| Page: 1 2 3 4 5 6 7 8 9 10 11 12 13 14 |
| Tissue | Expression Dynamics | Abbreviation |
| Breast |  | IDC: Invasive ductal carcinoma |
| DCIS: Ductal carcinoma in situ | ||
| Precancer(BRCA1-mut): Precancerous lesion from BRCA1 mutation carriers | ||
| Cervix | 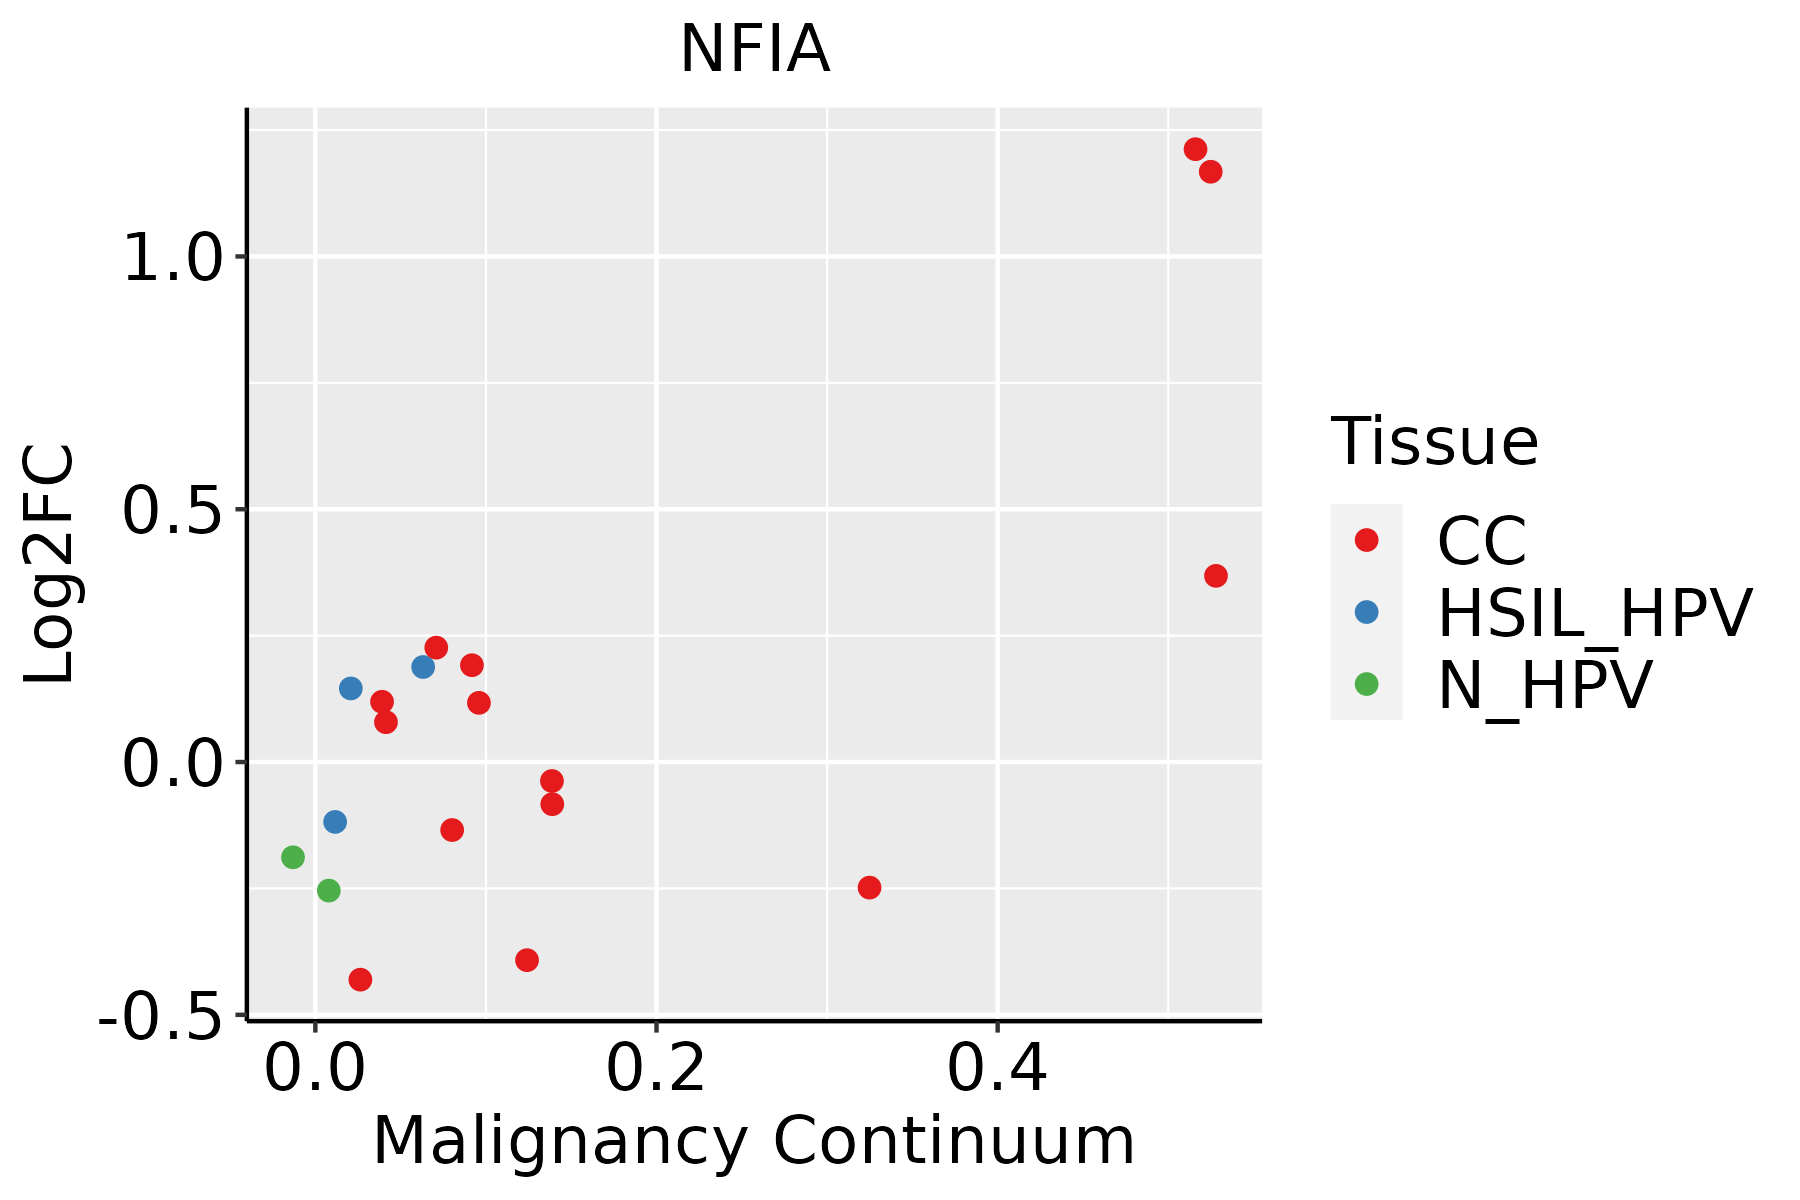 | CC: Cervix cancer |
| HSIL_HPV: HPV-infected high-grade squamous intraepithelial lesions | ||
| N_HPV: HPV-infected normal cervix | ||
| Colorectum (GSE201348) |  | FAP: Familial adenomatous polyposis |
| CRC: Colorectal cancer | ||
| Colorectum (HTA11) |  | AD: Adenomas |
| SER: Sessile serrated lesions | ||
| MSI-H: Microsatellite-high colorectal cancer | ||
| MSS: Microsatellite stable colorectal cancer | ||
| Endometrium |  | AEH: Atypical endometrial hyperplasia |
| EEC: Endometrioid Cancer | ||
| Esophagus |  | ESCC: Esophageal squamous cell carcinoma |
| HGIN: High-grade intraepithelial neoplasias | ||
| LGIN: Low-grade intraepithelial neoplasias | ||
| GC |  | CAG: Chronic atrophic gastritis |
| CAG with IM: Chronic atrophic gastritis with intestinal metaplasia | ||
| CSG: Chronic superficial gastritis | ||
| GC: Gastric cancer | ||
| SIM: Severe intestinal metaplasia | ||
| WIM: Wild intestinal metaplasia | ||
| Liver | 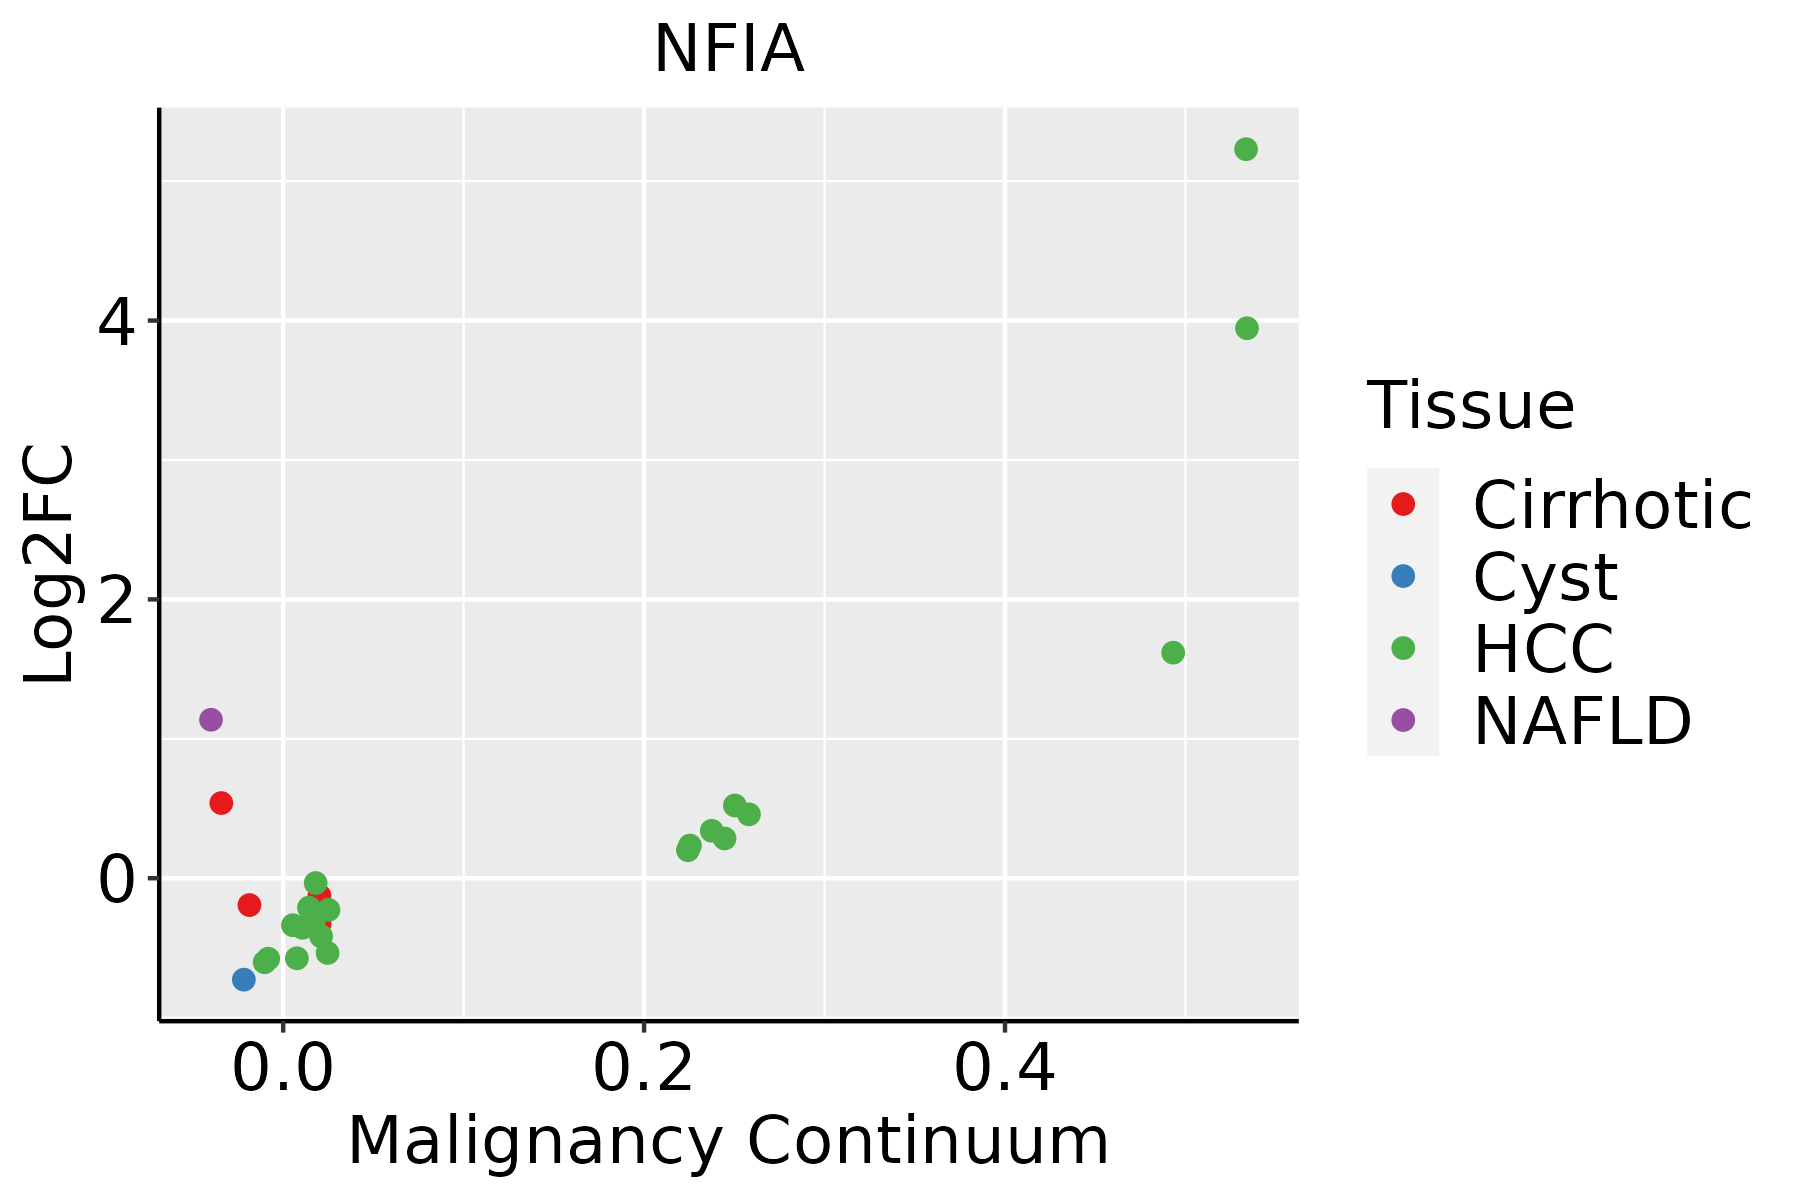 | HCC: Hepatocellular carcinoma |
| NAFLD: Non-alcoholic fatty liver disease | ||
| Lung | 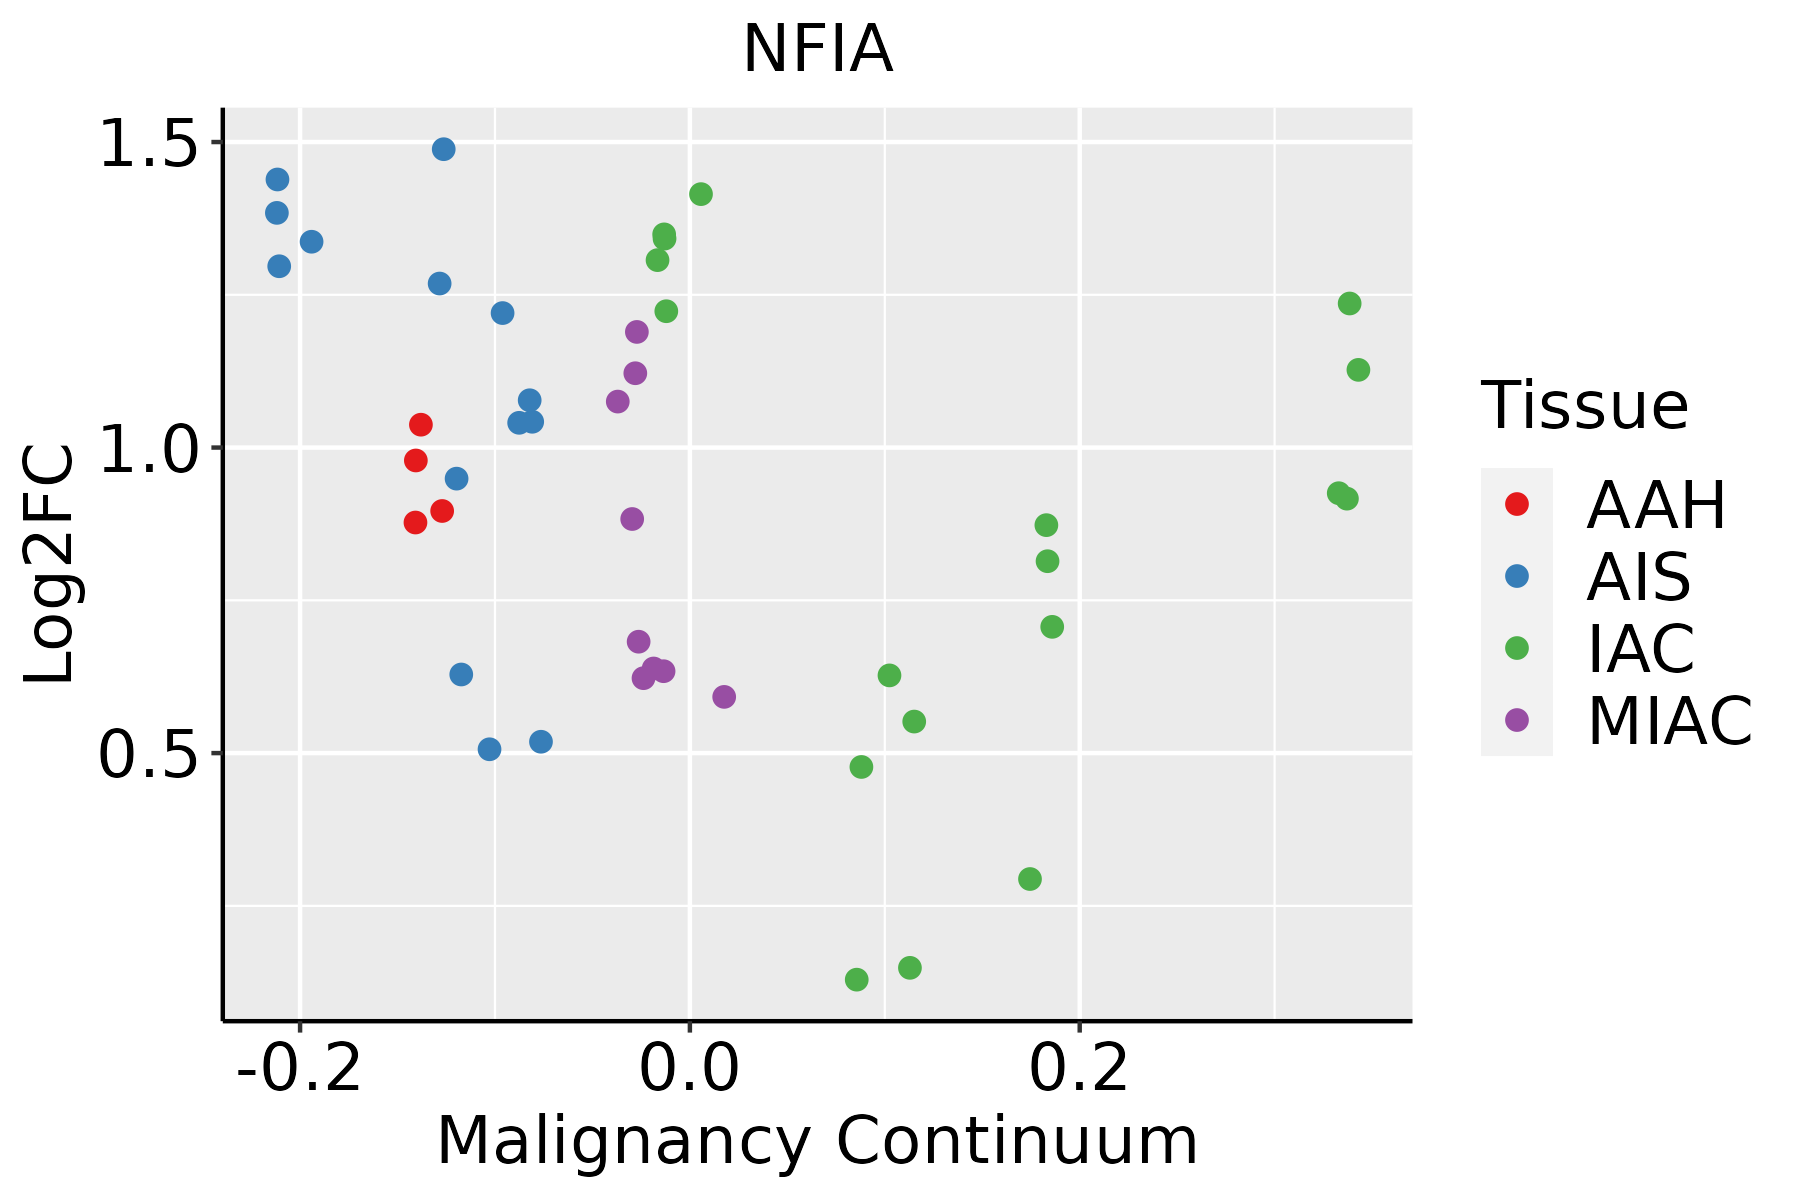 | AAH: Atypical adenomatous hyperplasia |
| AIS: Adenocarcinoma in situ | ||
| IAC: Invasive lung adenocarcinoma | ||
| MIA: Minimally invasive adenocarcinoma | ||
| Oral Cavity | 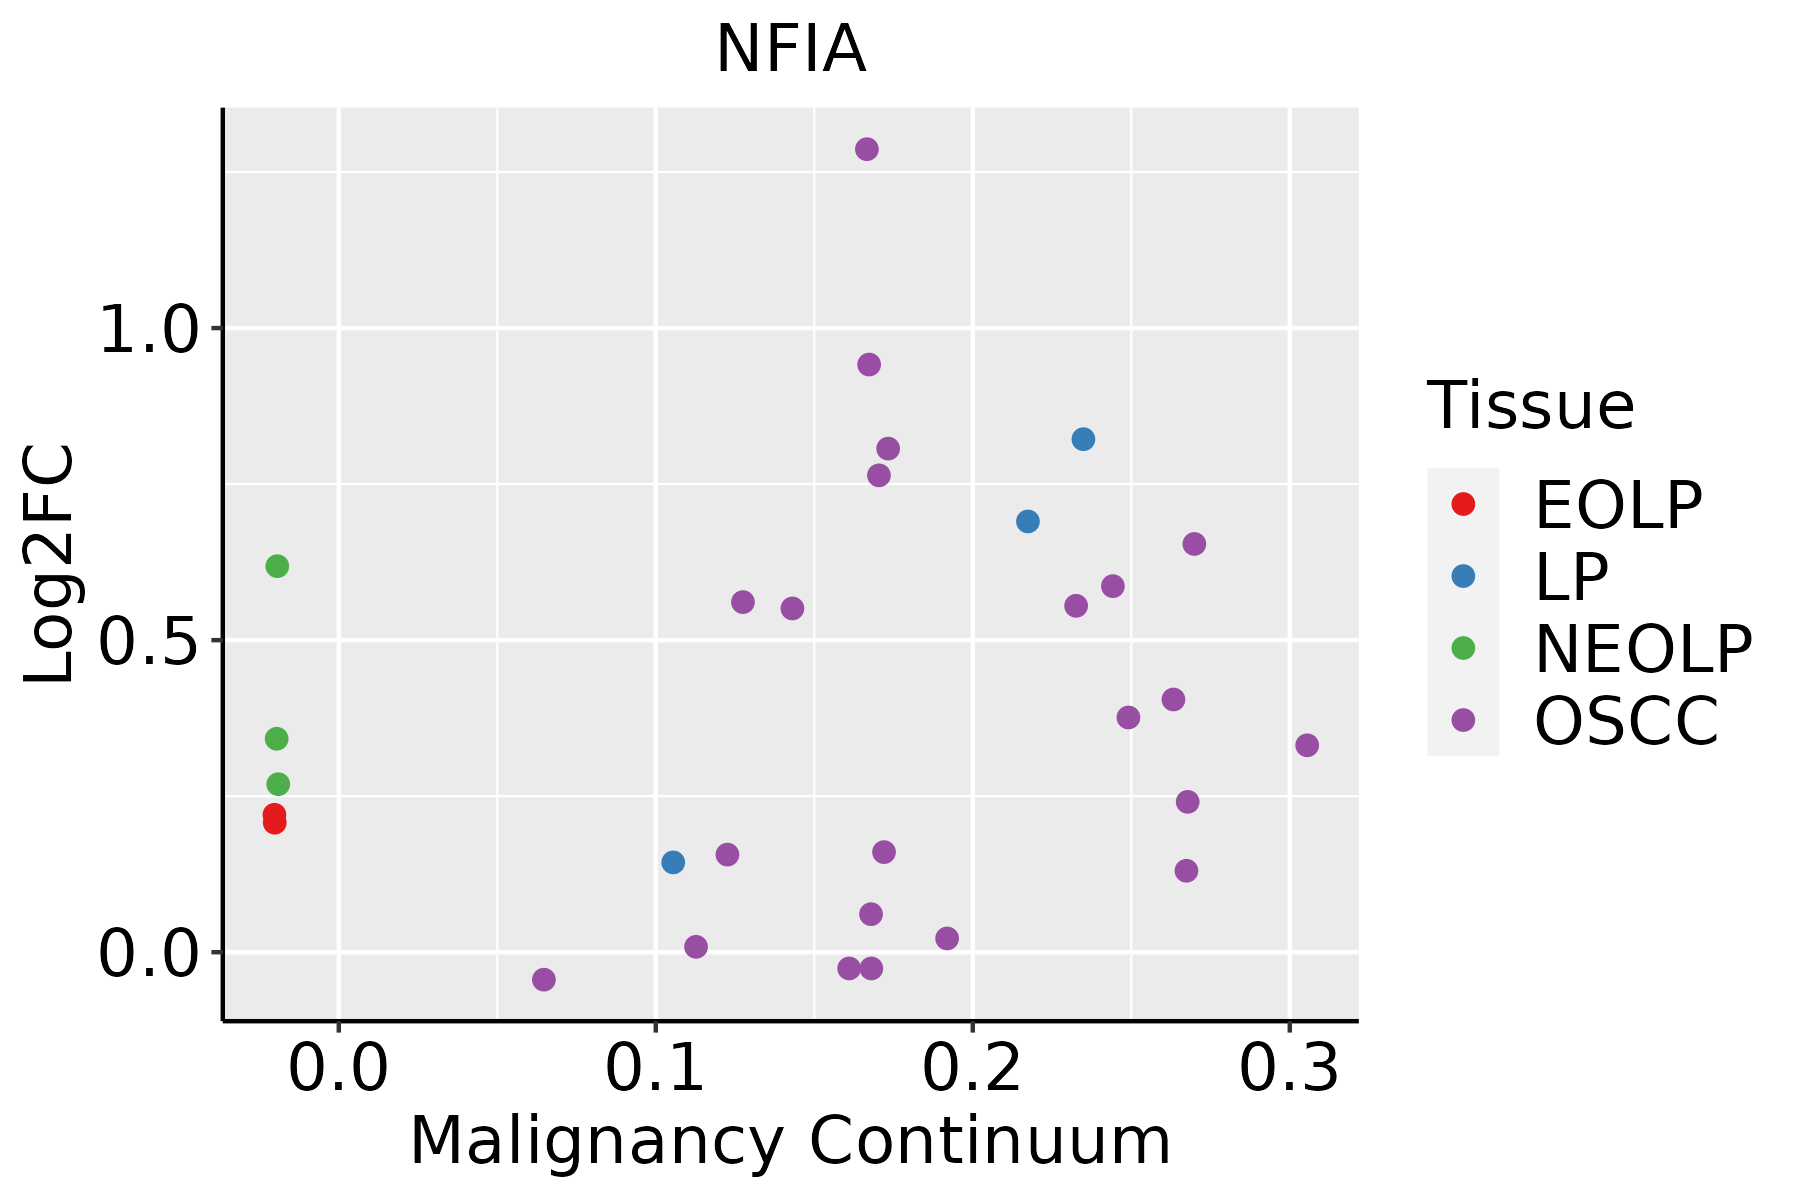 | EOLP: Erosive Oral lichen planus |
| LP: leukoplakia | ||
| NEOLP: Non-erosive oral lichen planus | ||
| OSCC: Oral squamous cell carcinoma | ||
| Prostate |  | BPH: Benign Prostatic Hyperplasia |
| Skin | 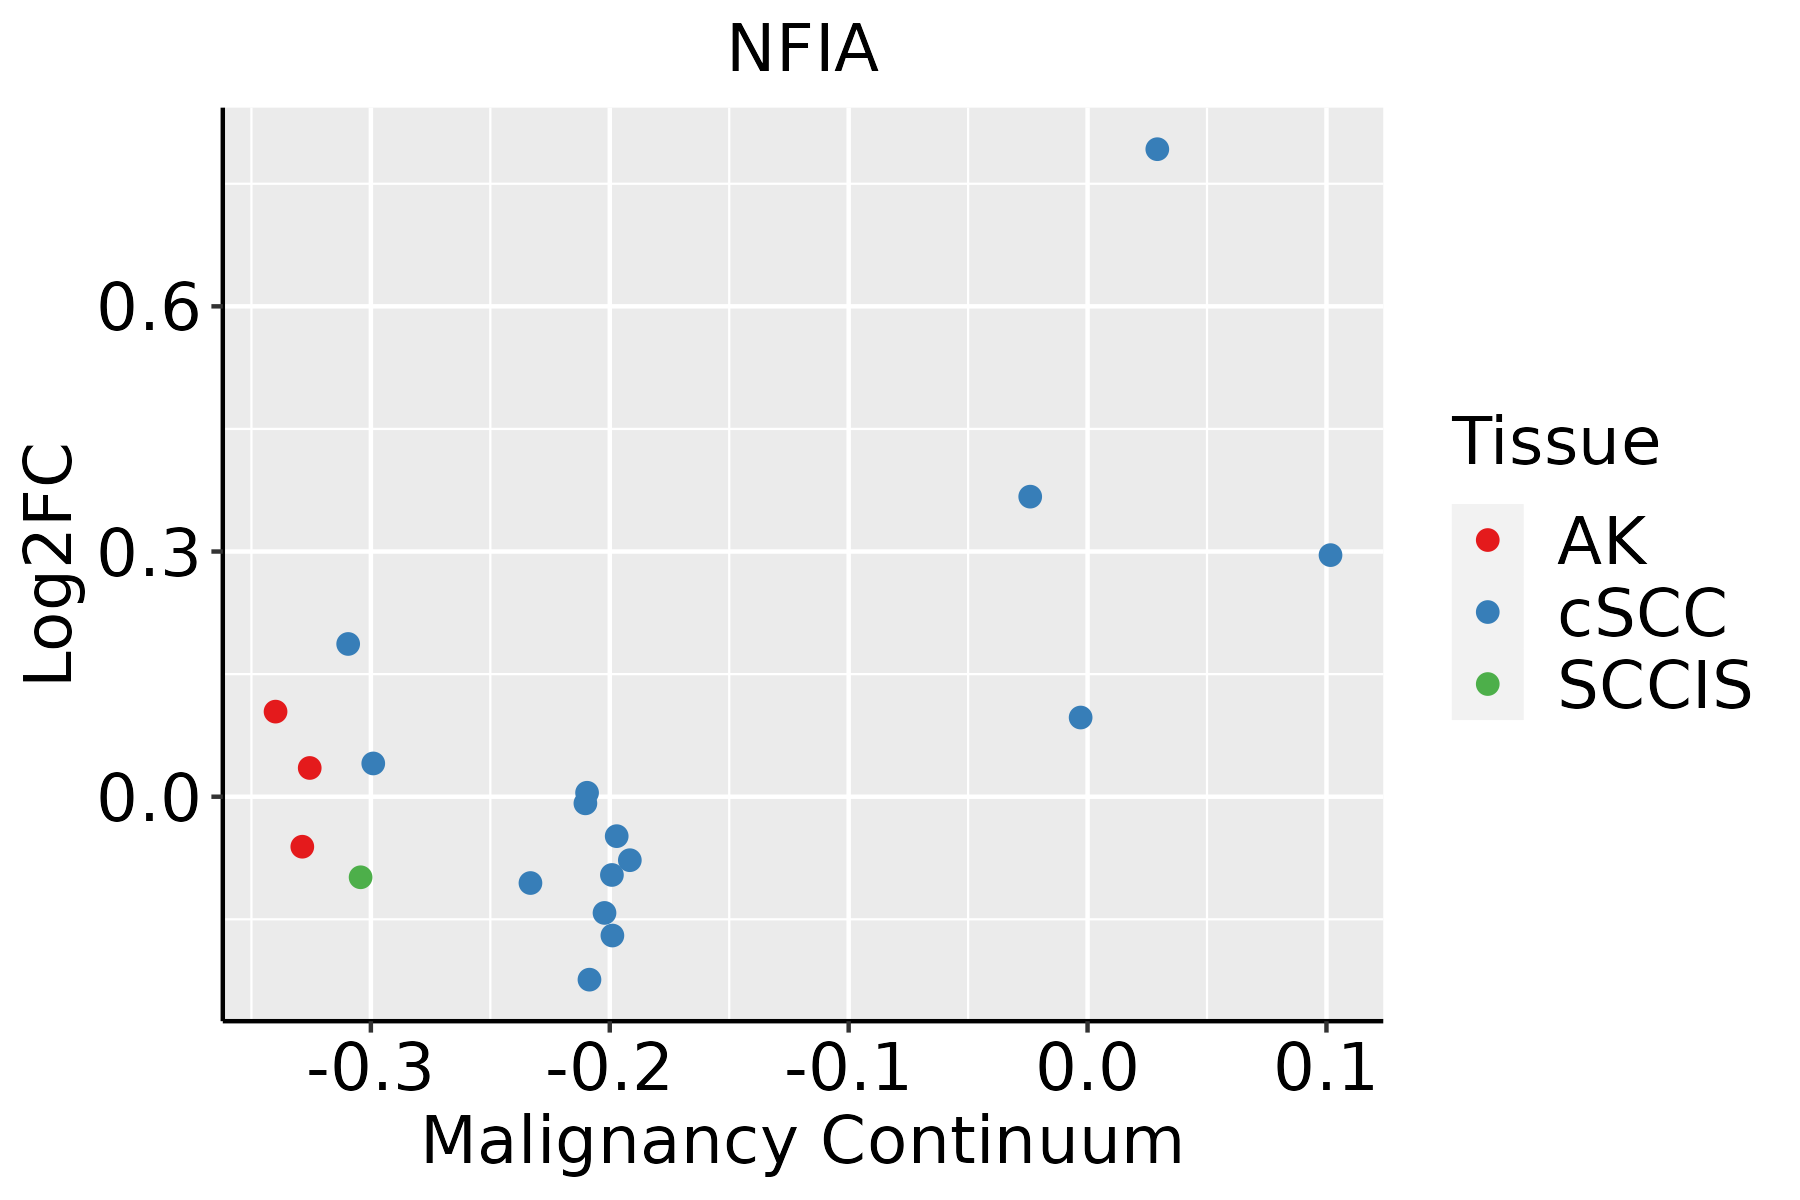 | AK: Actinic keratosis |
| cSCC: Cutaneous squamous cell carcinoma | ||
| SCCIS:squamous cell carcinoma in situ | ||
| Thyroid | 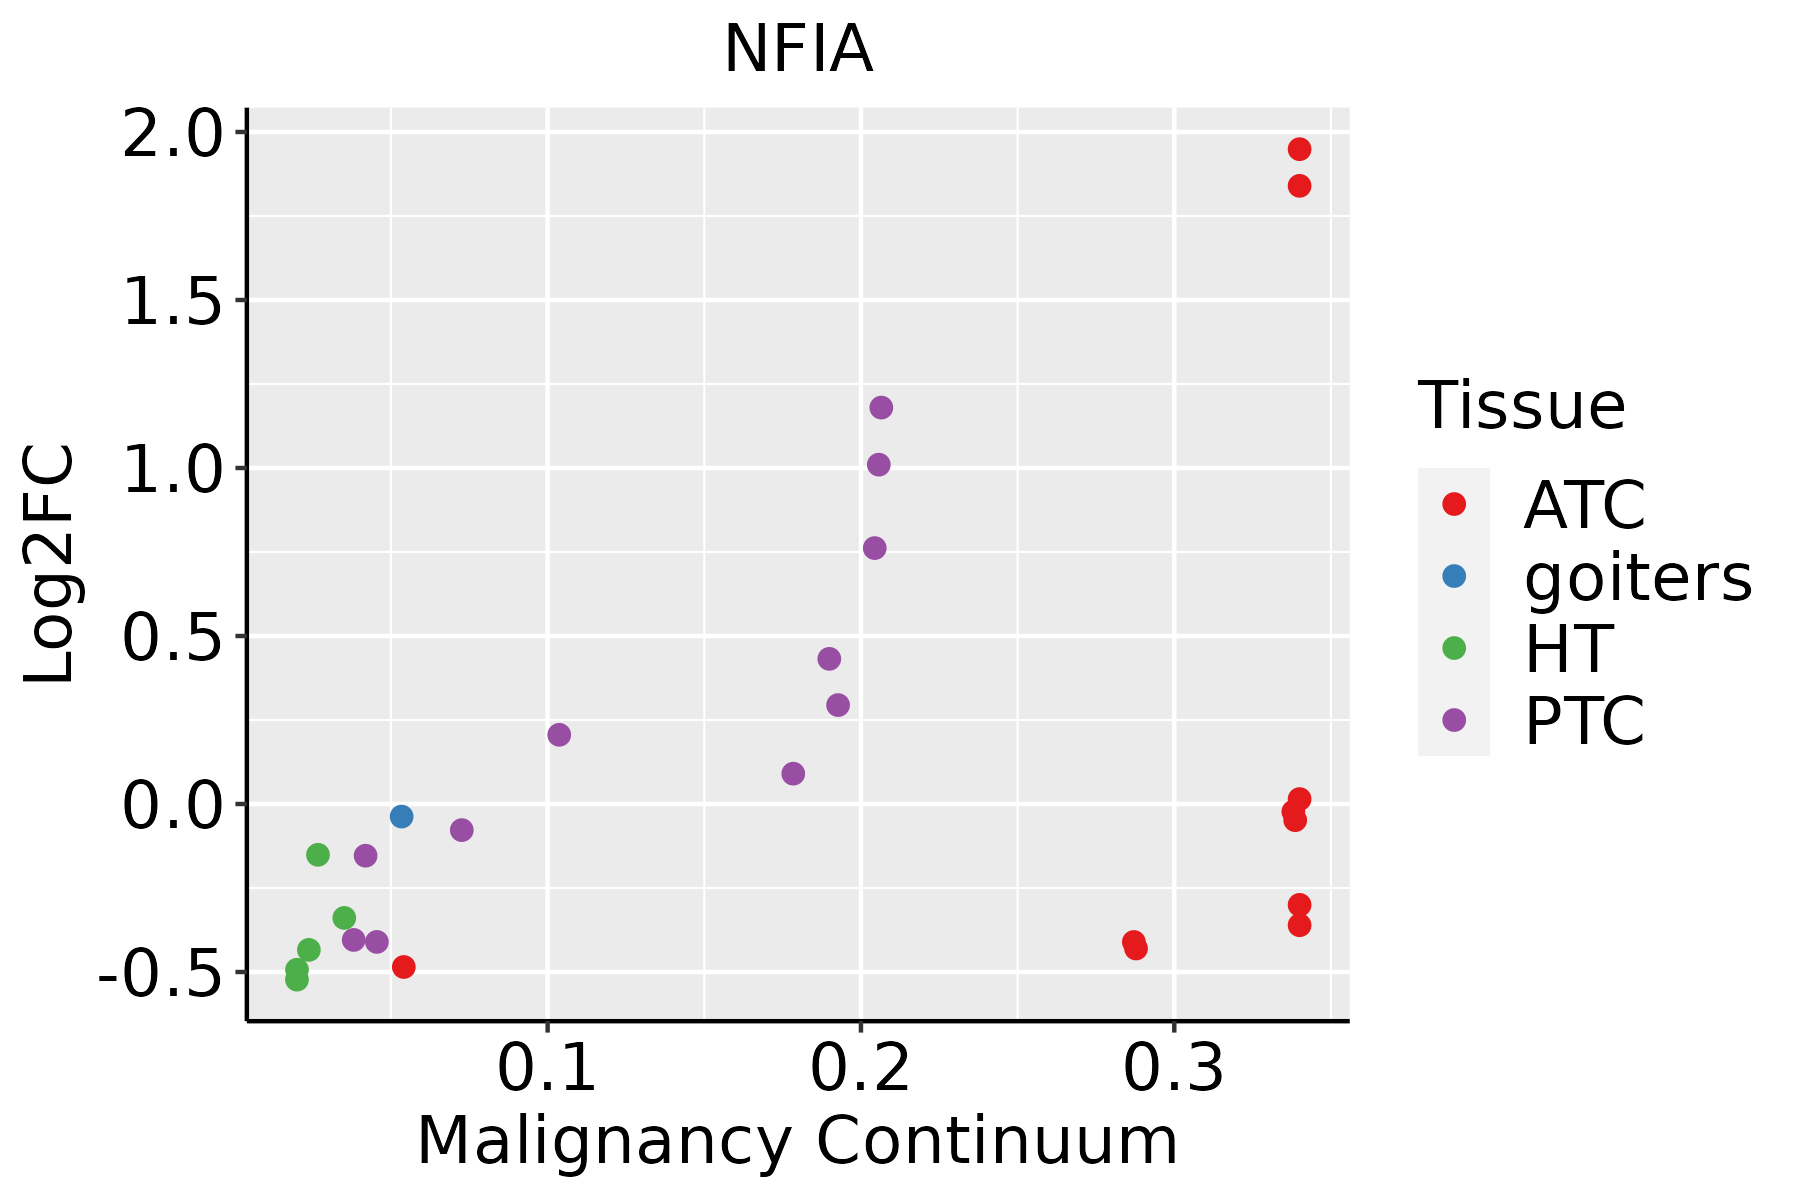 | ATC: Anaplastic thyroid cancer |
| HT: Hashimoto's thyroiditis | ||
| PTC: Papillary thyroid cancer |
| ∗log2FC in expression of this searched gene in stem-like cells from each diseased tissue sample relative to stem-like cells in normal samples in each tissue plotted against the malignancy continuum. Samples are colored based on if they are from different disease stage. |
Top |
Malignant transformation related pathway analysis |
| Find out the enriched GO biological processes and KEGG pathways involved in transition from healthy to precancer to cancer |
| Tissue | Disease Stage | Enriched GO biological Processes |
| Colorectum | AD |  |
| Colorectum | SER |  |
| Colorectum | MSS |  |
| Colorectum | MSI-H |  |
| Colorectum | FAP |  |
| ∗Top 15 enriched GO BP terms are showed in the bar plot of each disease state in each tissue. Each row represents a significant GO biological process which is colored according to the -log10(p.adjust). |
| Page: 1 2 3 4 5 6 7 8 9 |
| GO ID | Tissue | Disease Stage | Description | Gene Ratio | Bg Ratio | pvalue | p.adjust | Count |
| GO:00160329 | Breast | Precancer | viral process | 58/1080 | 415/18723 | 3.42e-10 | 3.16e-08 | 58 |
| GO:00190589 | Breast | Precancer | viral life cycle | 47/1080 | 317/18723 | 2.42e-09 | 1.99e-07 | 47 |
| GO:00190799 | Breast | Precancer | viral genome replication | 22/1080 | 131/18723 | 5.63e-06 | 1.66e-04 | 22 |
| GO:001603214 | Breast | IDC | viral process | 75/1434 | 415/18723 | 1.98e-12 | 4.02e-10 | 75 |
| GO:001905814 | Breast | IDC | viral life cycle | 61/1434 | 317/18723 | 1.61e-11 | 2.77e-09 | 61 |
| GO:001907914 | Breast | IDC | viral genome replication | 32/1434 | 131/18723 | 2.82e-09 | 2.46e-07 | 32 |
| GO:00016555 | Breast | IDC | urogenital system development | 39/1434 | 338/18723 | 6.75e-03 | 4.68e-02 | 39 |
| GO:001603224 | Breast | DCIS | viral process | 73/1390 | 415/18723 | 3.40e-12 | 6.88e-10 | 73 |
| GO:001905824 | Breast | DCIS | viral life cycle | 59/1390 | 317/18723 | 4.05e-11 | 5.74e-09 | 59 |
| GO:001907923 | Breast | DCIS | viral genome replication | 30/1390 | 131/18723 | 2.12e-08 | 1.45e-06 | 30 |
| GO:001603210 | Cervix | CC | viral process | 109/2311 | 415/18723 | 5.40e-15 | 6.46e-12 | 109 |
| GO:001905810 | Cervix | CC | viral life cycle | 87/2311 | 317/18723 | 2.20e-13 | 1.20e-10 | 87 |
| GO:001907910 | Cervix | CC | viral genome replication | 35/2311 | 131/18723 | 6.11e-06 | 1.49e-04 | 35 |
| GO:00062602 | Cervix | CC | DNA replication | 48/2311 | 260/18723 | 2.70e-03 | 1.85e-02 | 48 |
| GO:0016032 | Colorectum | AD | viral process | 168/3918 | 415/18723 | 4.67e-20 | 3.66e-17 | 168 |
| GO:0019058 | Colorectum | AD | viral life cycle | 119/3918 | 317/18723 | 6.18e-12 | 8.23e-10 | 119 |
| GO:0019079 | Colorectum | AD | viral genome replication | 51/3918 | 131/18723 | 1.83e-06 | 5.51e-05 | 51 |
| GO:0050808 | Colorectum | AD | synapse organization | 112/3918 | 426/18723 | 4.25e-03 | 2.92e-02 | 112 |
| GO:00160321 | Colorectum | SER | viral process | 118/2897 | 415/18723 | 8.36e-12 | 1.65e-09 | 118 |
| GO:00190581 | Colorectum | SER | viral life cycle | 87/2897 | 317/18723 | 2.82e-08 | 1.94e-06 | 87 |
| Page: 1 2 3 4 5 6 7 8 |
| Pathway ID | Tissue | Disease Stage | Description | Gene Ratio | Bg Ratio | pvalue | p.adjust | qvalue | Count |
| Page: 1 |
Top |
Cell-cell communication analysis |
| Identification of potential cell-cell interactions between two cell types and their ligand-receptor pairs for different disease states |
| Ligand | Receptor | LRpair | Pathway | Tissue | Disease Stage |
| Page: 1 |
Top |
Single-cell gene regulatory network inference analysis |
| Find out the significant the regulons (TFs) and the target genes of each regulon across cell types for different disease states |
| TF | Cell Type | Tissue | Disease Stage | Target Gene | RSS | Regulon Activity |
| NFIA | BMEM | Breast | Healthy | GNG11,CAV1,SPARCL1, etc. | 1.04e-01 |  |
| NFIA | BMEM | Breast | Precancer | GNG11,CAV1,SPARCL1, etc. | 1.08e-01 |  |
| NFIA | ECM | Breast | IDC | ABCA6,NID1,SRPX, etc. | 2.52e-01 |  |
| NFIA | INCAF | Breast | Precancer | ABCA6,NID1,SRPX, etc. | 1.41e-01 | |
| NFIA | NK | Cervix | ADJ | AC091057.1,MALAT1,GRHL2, etc. | 1.56e-02 |  |
| NFIA | MAIT | Cervix | CC | AC091057.1,MALAT1,GRHL2, etc. | 6.49e-02 |  |
| NFIA | BMEM | Cervix | CC | AC091057.1,MALAT1,GRHL2, etc. | 8.41e-02 | |
| NFIA | GC | Cervix | CC | AC091057.1,MALAT1,GRHL2, etc. | 1.57e-01 | |
| NFIA | MAST | Cervix | N_HPV | AC091057.1,MALAT1,GRHL2, etc. | 1.41e-02 |  |
| NFIA | CFIB | Colorectum | Healthy | PID1,RORA,KAZN, etc. | 1.76e-01 |  |
| ∗The dot plots of a searched regulon are shown for all cell subpopulations in each disease state of each tissue based on the regulon specific score inferred using pySCENIC and by calculating the average expression. |
| Page: 1 2 |
Top |
Somatic mutation of malignant transformation related genes |
| Annotation of somatic variants for genes involved in malignant transformation |
| Hugo Symbol | Variant Class | Variant Classification | dbSNP RS | HGVSc | HGVSp | HGVSp Short | SWISSPROT | BIOTYPE | SIFT | PolyPhen | Tumor Sample Barcode | Tissue | Histology | Sex | Age | Stage | Therapy Types | Drugs | Outcome |
| NFIA | SNV | Missense_Mutation | rs886039429 | c.496C>T | p.Arg166Cys | p.R166C | Q12857 | protein_coding | deleterious(0) | probably_damaging(0.995) | TCGA-AN-A046-01 | Breast | breast invasive carcinoma | Female | >=65 | I/II | Unknown | Unknown | SD |
| NFIA | SNV | Missense_Mutation | c.1211N>T | p.Ala404Val | p.A404V | Q12857 | protein_coding | tolerated(0.63) | probably_damaging(0.971) | TCGA-C8-A278-01 | Breast | breast invasive carcinoma | Female | <65 | III/IV | Hormone Therapy | tamoxiphen | SD | |
| NFIA | SNV | Missense_Mutation | c.875N>T | p.Ser292Leu | p.S292L | Q12857 | protein_coding | deleterious(0.01) | benign(0.059) | TCGA-D8-A1JA-01 | Breast | breast invasive carcinoma | Female | <65 | III/IV | Chemotherapy | adriamycin | PD | |
| NFIA | insertion | Frame_Shift_Ins | novel | c.1295_1296insAACTAATACAGATG | p.Ile433ThrfsTer14 | p.I433Tfs*14 | Q12857 | protein_coding | TCGA-B6-A0IK-01 | Breast | breast invasive carcinoma | Female | <65 | III/IV | Unknown | Unknown | PD | ||
| NFIA | SNV | Missense_Mutation | c.248G>A | p.Arg83Gln | p.R83Q | Q12857 | protein_coding | deleterious(0) | probably_damaging(0.975) | TCGA-2W-A8YY-01 | Cervix | cervical & endocervical cancer | Female | <65 | I/II | Chemotherapy | cisplatin | CR | |
| NFIA | SNV | Missense_Mutation | novel | c.29N>G | p.Ser10Trp | p.S10W | Q12857 | protein_coding | benign(0.06) | TCGA-C5-A7X5-01 | Cervix | cervical & endocervical cancer | Female | >=65 | I/II | Chemotherapy | carboplatin | PD | |
| NFIA | SNV | Missense_Mutation | novel | c.13N>A | p.Asp5Asn | p.D5N | protein_coding | tolerated_low_confidence(0.28) | unknown(0) | TCGA-HM-A4S6-01 | Cervix | cervical & endocervical cancer | Female | <65 | III/IV | Chemotherapy | cisplatin | CR | |
| NFIA | SNV | Missense_Mutation | c.1582N>A | p.Ala528Thr | p.A528T | Q12857 | protein_coding | deleterious_low_confidence(0.03) | probably_damaging(0.988) | TCGA-AA-3663-01 | Colorectum | colon adenocarcinoma | Male | <65 | I/II | Unknown | Unknown | SD | |
| NFIA | SNV | Missense_Mutation | c.1582N>A | p.Ala528Thr | p.A528T | Q12857 | protein_coding | deleterious_low_confidence(0.03) | probably_damaging(0.988) | TCGA-AA-3845-01 | Colorectum | colon adenocarcinoma | Female | >=65 | I/II | Unknown | Unknown | PD | |
| NFIA | SNV | Missense_Mutation | novel | c.964N>T | p.Arg322Cys | p.R322C | Q12857 | protein_coding | deleterious(0) | probably_damaging(0.995) | TCGA-AA-3947-01 | Colorectum | colon adenocarcinoma | Female | <65 | I/II | Unknown | Unknown | SD |
| Page: 1 2 3 4 5 6 7 |
Top |
Related drugs of malignant transformation related genes |
| Identification of chemicals and drugs interact with genes involved in malignant transfromation |
| (DGIdb 4.0) |
| Entrez ID | Symbol | Category | Interaction Types | Drug Claim Name | Drug Name | PMIDs |
| Page: 1 |

Copyright 2023-Present -The University of Texas Health Science Center at Houston |