| Tissue | Expression Dynamics | Abbreviation |
| Cervix | 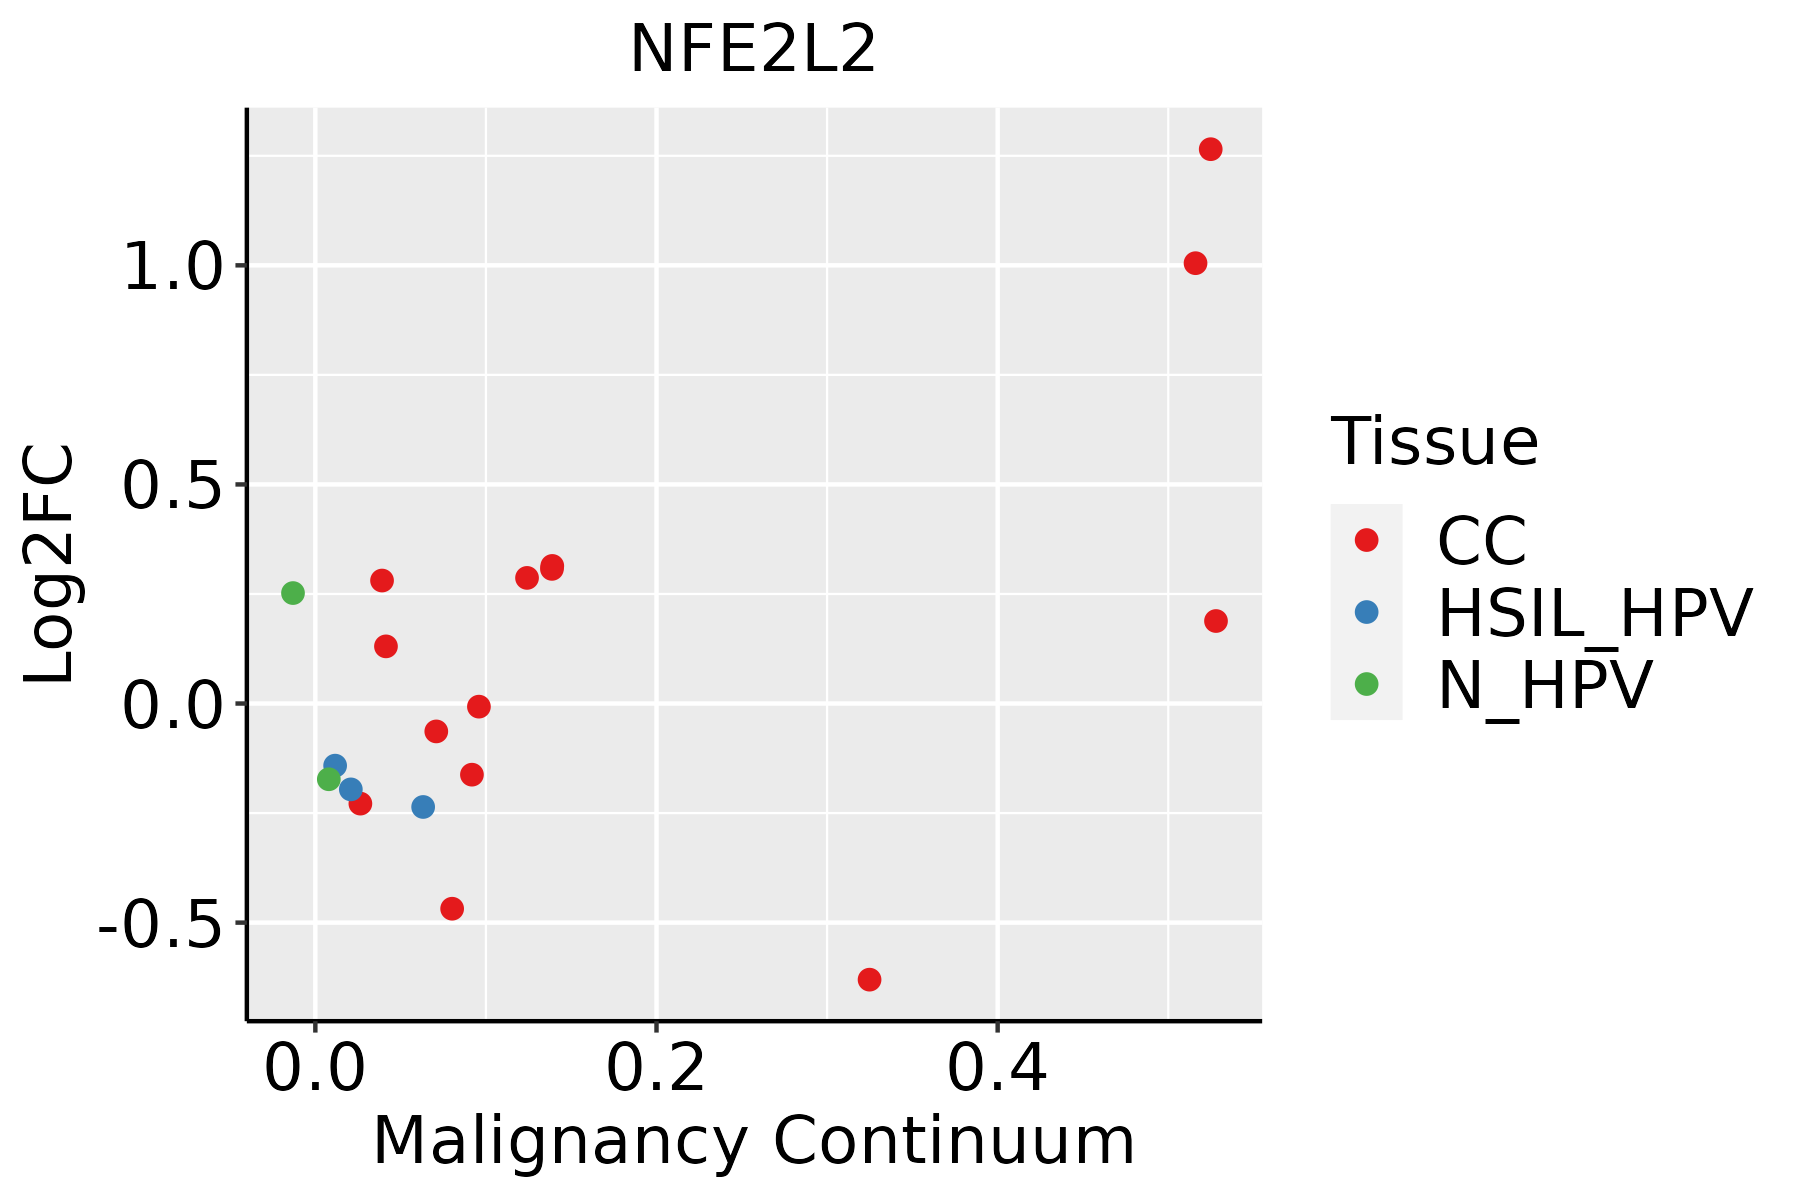 | CC: Cervix cancer |
| HSIL_HPV: HPV-infected high-grade squamous intraepithelial lesions |
| N_HPV: HPV-infected normal cervix |
| Colorectum (GSE201348) |  | FAP: Familial adenomatous polyposis |
| CRC: Colorectal cancer |
| Colorectum (HTA11) |  | AD: Adenomas |
| SER: Sessile serrated lesions |
| MSI-H: Microsatellite-high colorectal cancer |
| MSS: Microsatellite stable colorectal cancer |
| Esophagus |  | ESCC: Esophageal squamous cell carcinoma |
| HGIN: High-grade intraepithelial neoplasias |
| LGIN: Low-grade intraepithelial neoplasias |
| Liver |  | HCC: Hepatocellular carcinoma |
| NAFLD: Non-alcoholic fatty liver disease |
| Oral Cavity |  | EOLP: Erosive Oral lichen planus |
| LP: leukoplakia |
| NEOLP: Non-erosive oral lichen planus |
| OSCC: Oral squamous cell carcinoma |
| Prostate | 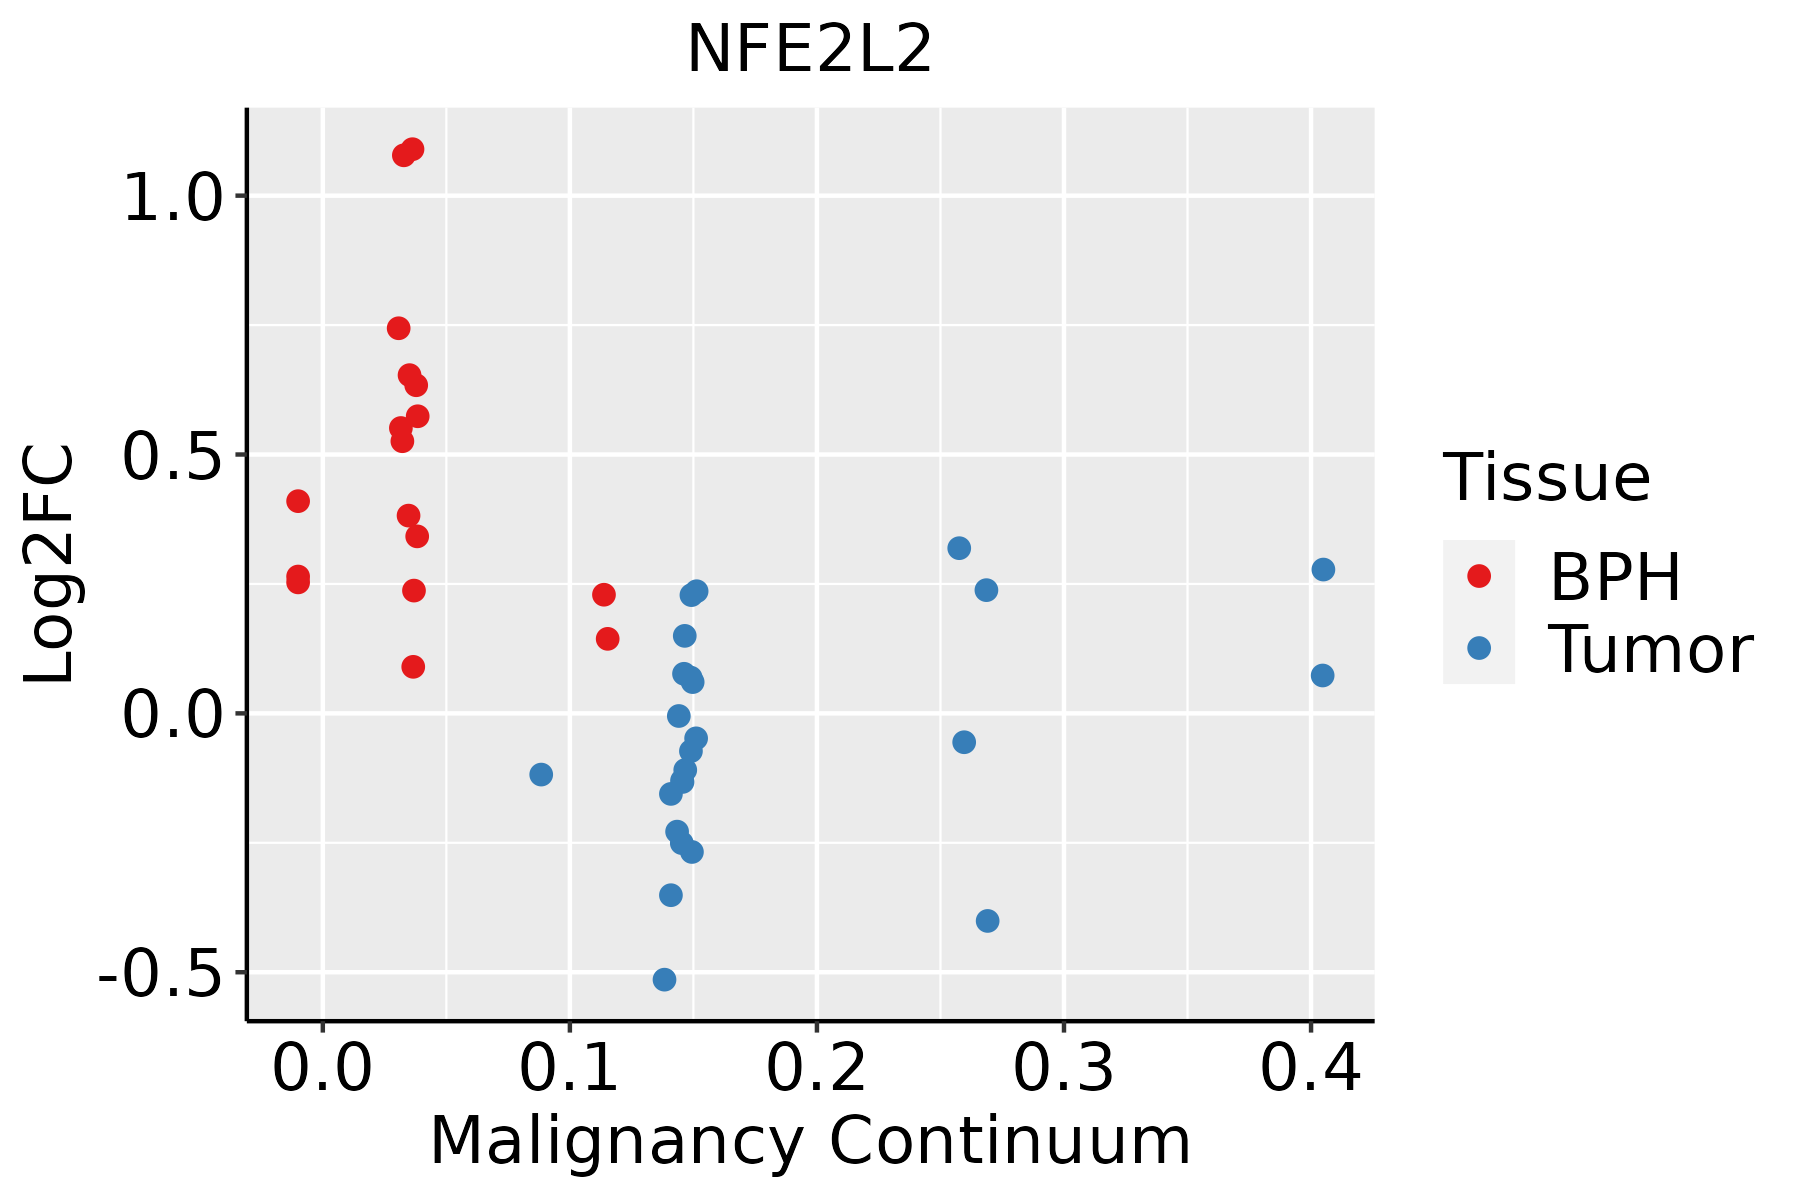 | BPH: Benign Prostatic Hyperplasia |
| Skin |  | AK: Actinic keratosis |
| cSCC: Cutaneous squamous cell carcinoma |
| SCCIS:squamous cell carcinoma in situ |
| Thyroid | 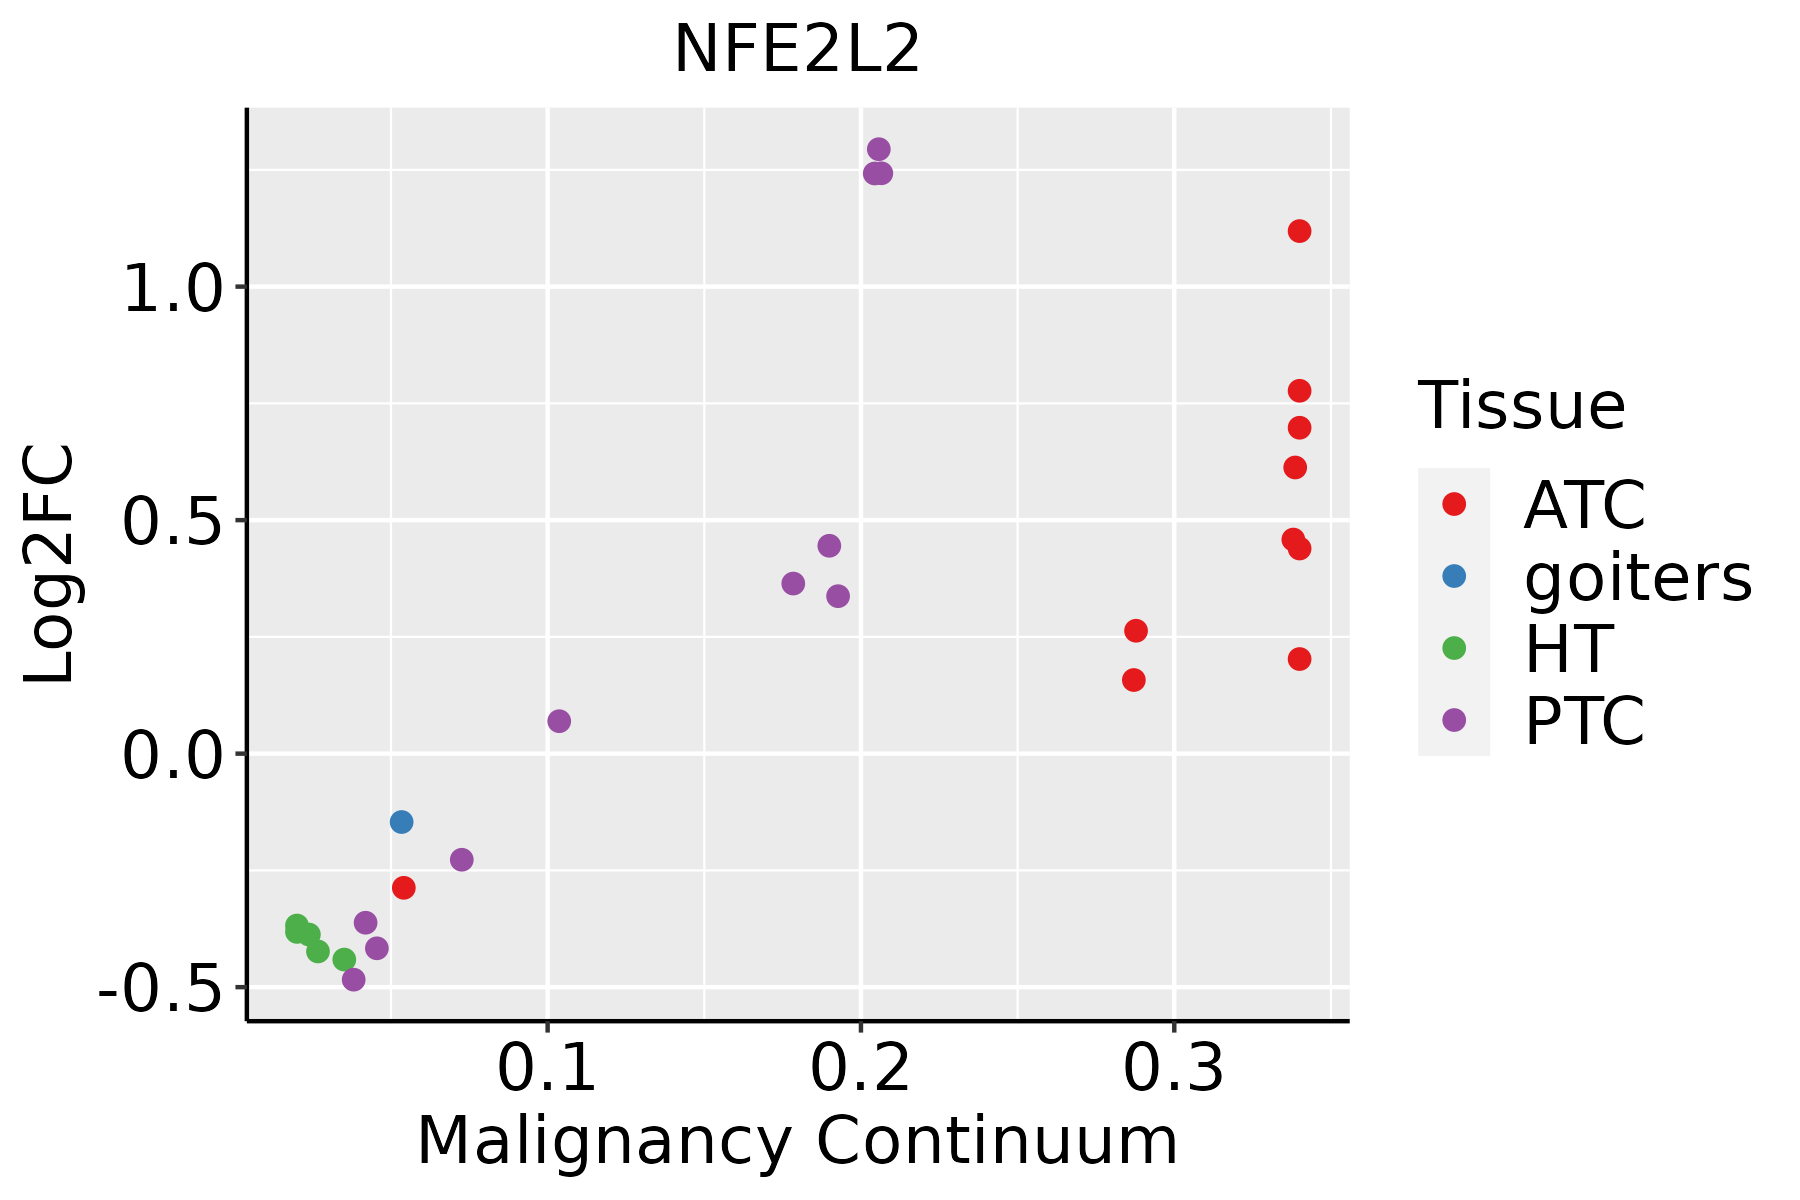 | ATC: Anaplastic thyroid cancer |
| HT: Hashimoto's thyroiditis |
| PTC: Papillary thyroid cancer |
| GO ID | Tissue | Disease Stage | Description | Gene Ratio | Bg Ratio | pvalue | p.adjust | Count |
| GO:009719310 | Cervix | CC | intrinsic apoptotic signaling pathway | 85/2311 | 288/18723 | 4.56e-15 | 6.46e-12 | 85 |
| GO:004217610 | Cervix | CC | regulation of protein catabolic process | 104/2311 | 391/18723 | 9.39e-15 | 9.36e-12 | 104 |
| GO:004206010 | Cervix | CC | wound healing | 109/2311 | 422/18723 | 1.84e-14 | 1.57e-11 | 109 |
| GO:200123310 | Cervix | CC | regulation of apoptotic signaling pathway | 96/2311 | 356/18723 | 4.08e-14 | 3.05e-11 | 96 |
| GO:004586210 | Cervix | CC | positive regulation of proteolysis | 95/2311 | 372/18723 | 1.84e-12 | 6.86e-10 | 95 |
| GO:190336210 | Cervix | CC | regulation of cellular protein catabolic process | 72/2311 | 255/18723 | 5.98e-12 | 2.10e-09 | 72 |
| GO:009013210 | Cervix | CC | epithelium migration | 90/2311 | 360/18723 | 2.45e-11 | 6.11e-09 | 90 |
| GO:00016679 | Cervix | CC | ameboidal-type cell migration | 110/2311 | 475/18723 | 2.66e-11 | 6.36e-09 | 110 |
| GO:001063110 | Cervix | CC | epithelial cell migration | 89/2311 | 357/18723 | 3.72e-11 | 8.54e-09 | 89 |
| GO:200124210 | Cervix | CC | regulation of intrinsic apoptotic signaling pathway | 52/2311 | 164/18723 | 5.06e-11 | 1.01e-08 | 52 |
| GO:009013010 | Cervix | CC | tissue migration | 90/2311 | 365/18723 | 5.42e-11 | 1.05e-08 | 90 |
| GO:004573210 | Cervix | CC | positive regulation of protein catabolic process | 65/2311 | 231/18723 | 7.44e-11 | 1.39e-08 | 65 |
| GO:001049810 | Cervix | CC | proteasomal protein catabolic process | 111/2311 | 490/18723 | 8.98e-11 | 1.58e-08 | 111 |
| GO:000697910 | Cervix | CC | response to oxidative stress | 102/2311 | 446/18723 | 2.99e-10 | 4.36e-08 | 102 |
| GO:000989610 | Cervix | CC | positive regulation of catabolic process | 109/2311 | 492/18723 | 5.26e-10 | 6.99e-08 | 109 |
| GO:190305010 | Cervix | CC | regulation of proteolysis involved in cellular protein catabolic process | 60/2311 | 221/18723 | 1.82e-09 | 1.98e-07 | 60 |
| GO:007149610 | Cervix | CC | cellular response to external stimulus | 78/2311 | 320/18723 | 1.82e-09 | 1.98e-07 | 78 |
| GO:001063210 | Cervix | CC | regulation of epithelial cell migration | 72/2311 | 292/18723 | 4.52e-09 | 4.43e-07 | 72 |
| GO:200005810 | Cervix | CC | regulation of ubiquitin-dependent protein catabolic process | 47/2311 | 164/18723 | 1.63e-08 | 1.25e-06 | 47 |
| GO:004316110 | Cervix | CC | proteasome-mediated ubiquitin-dependent protein catabolic process | 91/2311 | 412/18723 | 1.65e-08 | 1.25e-06 | 91 |
| Pathway ID | Tissue | Disease Stage | Description | Gene Ratio | Bg Ratio | pvalue | p.adjust | qvalue | Count |
| hsa0520820 | Cervix | CC | Chemical carcinogenesis - reactive oxygen species | 92/1267 | 223/8465 | 4.71e-22 | 5.09e-20 | 3.01e-20 | 92 |
| hsa0501220 | Cervix | CC | Parkinson disease | 102/1267 | 266/8465 | 1.81e-21 | 1.47e-19 | 8.66e-20 | 102 |
| hsa0541820 | Cervix | CC | Fluid shear stress and atherosclerosis | 50/1267 | 139/8465 | 5.71e-10 | 1.32e-08 | 7.81e-09 | 50 |
| hsa0541720 | Cervix | CC | Lipid and atherosclerosis | 65/1267 | 215/8465 | 6.47e-09 | 1.10e-07 | 6.52e-08 | 65 |
| hsa0414120 | Cervix | CC | Protein processing in endoplasmic reticulum | 55/1267 | 174/8465 | 1.74e-08 | 2.68e-07 | 1.58e-07 | 55 |
| hsa0522510 | Cervix | CC | Hepatocellular carcinoma | 40/1267 | 168/8465 | 1.52e-03 | 6.39e-03 | 3.78e-03 | 40 |
| hsa05208110 | Cervix | CC | Chemical carcinogenesis - reactive oxygen species | 92/1267 | 223/8465 | 4.71e-22 | 5.09e-20 | 3.01e-20 | 92 |
| hsa05012110 | Cervix | CC | Parkinson disease | 102/1267 | 266/8465 | 1.81e-21 | 1.47e-19 | 8.66e-20 | 102 |
| hsa05418110 | Cervix | CC | Fluid shear stress and atherosclerosis | 50/1267 | 139/8465 | 5.71e-10 | 1.32e-08 | 7.81e-09 | 50 |
| hsa05417110 | Cervix | CC | Lipid and atherosclerosis | 65/1267 | 215/8465 | 6.47e-09 | 1.10e-07 | 6.52e-08 | 65 |
| hsa04141110 | Cervix | CC | Protein processing in endoplasmic reticulum | 55/1267 | 174/8465 | 1.74e-08 | 2.68e-07 | 1.58e-07 | 55 |
| hsa0522513 | Cervix | CC | Hepatocellular carcinoma | 40/1267 | 168/8465 | 1.52e-03 | 6.39e-03 | 3.78e-03 | 40 |
| hsa0501244 | Cervix | N_HPV | Parkinson disease | 45/349 | 266/8465 | 1.93e-16 | 1.75e-14 | 1.37e-14 | 45 |
| hsa0520844 | Cervix | N_HPV | Chemical carcinogenesis - reactive oxygen species | 32/349 | 223/8465 | 4.82e-10 | 1.87e-08 | 1.47e-08 | 32 |
| hsa0541845 | Cervix | N_HPV | Fluid shear stress and atherosclerosis | 20/349 | 139/8465 | 9.29e-07 | 1.41e-05 | 1.10e-05 | 20 |
| hsa0414144 | Cervix | N_HPV | Protein processing in endoplasmic reticulum | 21/349 | 174/8465 | 8.84e-06 | 1.09e-04 | 8.55e-05 | 21 |
| hsa0541745 | Cervix | N_HPV | Lipid and atherosclerosis | 22/349 | 215/8465 | 7.28e-05 | 7.92e-04 | 6.19e-04 | 22 |
| hsa0501254 | Cervix | N_HPV | Parkinson disease | 45/349 | 266/8465 | 1.93e-16 | 1.75e-14 | 1.37e-14 | 45 |
| hsa0520854 | Cervix | N_HPV | Chemical carcinogenesis - reactive oxygen species | 32/349 | 223/8465 | 4.82e-10 | 1.87e-08 | 1.47e-08 | 32 |
| hsa0541855 | Cervix | N_HPV | Fluid shear stress and atherosclerosis | 20/349 | 139/8465 | 9.29e-07 | 1.41e-05 | 1.10e-05 | 20 |
| Hugo Symbol | Variant Class | Variant Classification | dbSNP RS | HGVSc | HGVSp | HGVSp Short | SWISSPROT | BIOTYPE | SIFT | PolyPhen | Tumor Sample Barcode | Tissue | Histology | Sex | Age | Stage | Therapy Types | Drugs | Outcome |
| NFE2L2 | SNV | Missense_Mutation | | c.242N>A | p.Gly81Asp | p.G81D | Q16236 | protein_coding | deleterious(0) | probably_damaging(0.999) | TCGA-A7-A26E-01 | Breast | breast invasive carcinoma | Female | >=65 | III/IV | Chemotherapy | cytoxan | SD |
| NFE2L2 | SNV | Missense_Mutation | | c.959N>G | p.Ser320Cys | p.S320C | Q16236 | protein_coding | tolerated(0.19) | benign(0.005) | TCGA-AC-A23H-01 | Breast | breast invasive carcinoma | Female | >=65 | I/II | Unknown | Unknown | PD |
| NFE2L2 | SNV | Missense_Mutation | | c.371C>G | p.Ala124Gly | p.A124G | Q16236 | protein_coding | deleterious(0.03) | benign(0.02) | TCGA-D8-A1X6-01 | Breast | breast invasive carcinoma | Female | >=65 | III/IV | Hormone Therapy | tamoxiphen | SD |
| NFE2L2 | insertion | Frame_Shift_Ins | novel | c.1128_1129insTT | p.Glu377LeufsTer6 | p.E377Lfs*6 | Q16236 | protein_coding | | | TCGA-A8-A09D-01 | Breast | breast invasive carcinoma | Female | <65 | I/II | Chemotherapy | doxorubicin | CR |
| NFE2L2 | insertion | Frame_Shift_Ins | novel | c.1126_1127insTTGTGGTTATAATTTCCCTGATTTGCCATGAGTTTGAACATCTTCCA | p.Ser376PhefsTer22 | p.S376Ffs*22 | Q16236 | protein_coding | | | TCGA-A8-A09D-01 | Breast | breast invasive carcinoma | Female | <65 | I/II | Chemotherapy | doxorubicin | CR |
| NFE2L2 | deletion | Frame_Shift_Del | novel | c.129delN | p.Glu45SerfsTer32 | p.E45Sfs*32 | Q16236 | protein_coding | | | TCGA-EW-A2FV-01 | Breast | breast invasive carcinoma | Female | <65 | III/IV | Chemotherapy | docetaxel | SD |
| NFE2L2 | SNV | Missense_Mutation | novel | c.594G>T | p.Gln198His | p.Q198H | Q16236 | protein_coding | tolerated(0.07) | probably_damaging(0.997) | TCGA-2W-A8YY-01 | Cervix | cervical & endocervical cancer | Female | <65 | I/II | Chemotherapy | cisplatin | CR |
| NFE2L2 | SNV | Missense_Mutation | | c.1138G>C | p.Glu380Gln | p.E380Q | Q16236 | protein_coding | deleterious(0.01) | possibly_damaging(0.522) | TCGA-C5-A1BL-01 | Cervix | cervical & endocervical cancer | Female | <65 | I/II | Unknown | Unknown | SD |
| NFE2L2 | SNV | Missense_Mutation | | c.85G>C | p.Asp29His | p.D29H | Q16236 | protein_coding | deleterious(0) | probably_damaging(0.999) | TCGA-C5-A1MN-01 | Cervix | cervical & endocervical cancer | Female | <65 | III/IV | Chemotherapy | cisplatin | SD |
| NFE2L2 | SNV | Missense_Mutation | | c.1544N>C | p.Arg515Thr | p.R515T | Q16236 | protein_coding | deleterious(0) | probably_damaging(0.999) | TCGA-DR-A0ZM-01 | Cervix | cervical & endocervical cancer | Female | <65 | III/IV | Unspecific | Cisplatin | SD |
| Entrez ID | Symbol | Category | Interaction Types | Drug Claim Name | Drug Name | PMIDs |
| 4780 | NFE2L2 | CLINICALLY ACTIONABLE, TRANSCRIPTION FACTOR | | ALDICARB | ALDICARB | |
| 4780 | NFE2L2 | CLINICALLY ACTIONABLE, TRANSCRIPTION FACTOR | | 3,3'-DIMETHOXYBENZIDINE | CHEMBL398363 | |
| 4780 | NFE2L2 | CLINICALLY ACTIONABLE, TRANSCRIPTION FACTOR | | LOTEPREDNOL ETABONATE | LOTEPREDNOL ETABONATE | |
| 4780 | NFE2L2 | CLINICALLY ACTIONABLE, TRANSCRIPTION FACTOR | | BECLOMETHASONE DIPROPIONATE | BECLOMETHASONE DIPROPIONATE | |
| 4780 | NFE2L2 | CLINICALLY ACTIONABLE, TRANSCRIPTION FACTOR | | PHENOXYCARB | PHENOXYCARB | |
| 4780 | NFE2L2 | CLINICALLY ACTIONABLE, TRANSCRIPTION FACTOR | | METHIOCARB | METHIOCARB | |
| 4780 | NFE2L2 | CLINICALLY ACTIONABLE, TRANSCRIPTION FACTOR | | JNJ-1661010 | CHEMBL460273 | |
| 4780 | NFE2L2 | CLINICALLY ACTIONABLE, TRANSCRIPTION FACTOR | | NALED | NALED | |
| 4780 | NFE2L2 | CLINICALLY ACTIONABLE, TRANSCRIPTION FACTOR | | MORNIFLUMATE | MORNIFLUMATE | |
| 4780 | NFE2L2 | CLINICALLY ACTIONABLE, TRANSCRIPTION FACTOR | | RHEIN | RHEIN | |


