
|
|||||
|
 | |
| |
| |
| |
| |
| |
|
Gene: NFE2L1 |
Gene summary for NFE2L1 |
| Gene information | Species | Human | Gene symbol | NFE2L1 | Gene ID | 4779 |
| Gene name | nuclear factor, erythroid 2 like 1 | |
| Gene Alias | LCR-F1 | |
| Cytomap | 17q21.32 | |
| Gene Type | protein-coding | GO ID | GO:0006066 | UniProtAcc | J9JIE5 |
Top |
Malignant transformation analysis |
| Identification of the aberrant gene expression in precancerous and cancerous lesions by comparing the gene expression of stem-like cells in diseased tissues with normal stem cells |
| Entrez ID | Symbol | Replicates | Species | Organ | Tissue | Adj P-value | Log2FC | Malignancy |
| 4779 | NFE2L1 | HTA11_2487_2000001011 | Human | Colorectum | SER | 5.54e-07 | 5.87e-01 | -0.1808 |
| 4779 | NFE2L1 | HTA11_347_2000001011 | Human | Colorectum | AD | 9.15e-19 | 6.19e-01 | -0.1954 |
| 4779 | NFE2L1 | HTA11_411_2000001011 | Human | Colorectum | SER | 2.22e-10 | 1.42e+00 | -0.2602 |
| 4779 | NFE2L1 | HTA11_2112_2000001011 | Human | Colorectum | SER | 7.26e-03 | 6.55e-01 | -0.2196 |
| 4779 | NFE2L1 | HTA11_696_2000001011 | Human | Colorectum | AD | 4.97e-12 | 4.49e-01 | -0.1464 |
| 4779 | NFE2L1 | HTA11_5212_2000001011 | Human | Colorectum | AD | 8.06e-05 | 7.23e-01 | -0.2061 |
| 4779 | NFE2L1 | HTA11_99999970781_79442 | Human | Colorectum | MSS | 1.19e-05 | 2.33e-01 | 0.294 |
| 4779 | NFE2L1 | HTA11_99999965062_69753 | Human | Colorectum | MSI-H | 8.03e-03 | 9.20e-01 | 0.3487 |
| 4779 | NFE2L1 | HTA11_99999971662_82457 | Human | Colorectum | MSS | 6.13e-13 | 5.72e-01 | 0.3859 |
| 4779 | NFE2L1 | HTA11_99999974143_84620 | Human | Colorectum | MSS | 2.75e-03 | 2.95e-01 | 0.3005 |
| 4779 | NFE2L1 | LZE2T | Human | Esophagus | ESCC | 1.85e-03 | 2.00e-01 | 0.082 |
| 4779 | NFE2L1 | LZE4T | Human | Esophagus | ESCC | 3.03e-14 | 2.75e-01 | 0.0811 |
| 4779 | NFE2L1 | LZE7T | Human | Esophagus | ESCC | 6.03e-04 | 4.17e-01 | 0.0667 |
| 4779 | NFE2L1 | LZE8T | Human | Esophagus | ESCC | 2.76e-02 | 1.51e-01 | 0.067 |
| 4779 | NFE2L1 | LZE20T | Human | Esophagus | ESCC | 4.08e-03 | 4.55e-02 | 0.0662 |
| 4779 | NFE2L1 | LZE22D1 | Human | Esophagus | HGIN | 7.89e-04 | 3.82e-03 | 0.0595 |
| 4779 | NFE2L1 | LZE24T | Human | Esophagus | ESCC | 7.60e-10 | 3.08e-01 | 0.0596 |
| 4779 | NFE2L1 | LZE21T | Human | Esophagus | ESCC | 4.90e-04 | 6.08e-01 | 0.0655 |
| 4779 | NFE2L1 | LZE6T | Human | Esophagus | ESCC | 2.15e-02 | 8.06e-02 | 0.0845 |
| 4779 | NFE2L1 | P1T-E | Human | Esophagus | ESCC | 2.96e-11 | 3.55e-01 | 0.0875 |
| Page: 1 2 3 4 5 6 7 8 |
| Tissue | Expression Dynamics | Abbreviation |
| Colorectum (GSE201348) |  | FAP: Familial adenomatous polyposis |
| CRC: Colorectal cancer | ||
| Colorectum (HTA11) |  | AD: Adenomas |
| SER: Sessile serrated lesions | ||
| MSI-H: Microsatellite-high colorectal cancer | ||
| MSS: Microsatellite stable colorectal cancer | ||
| Esophagus | 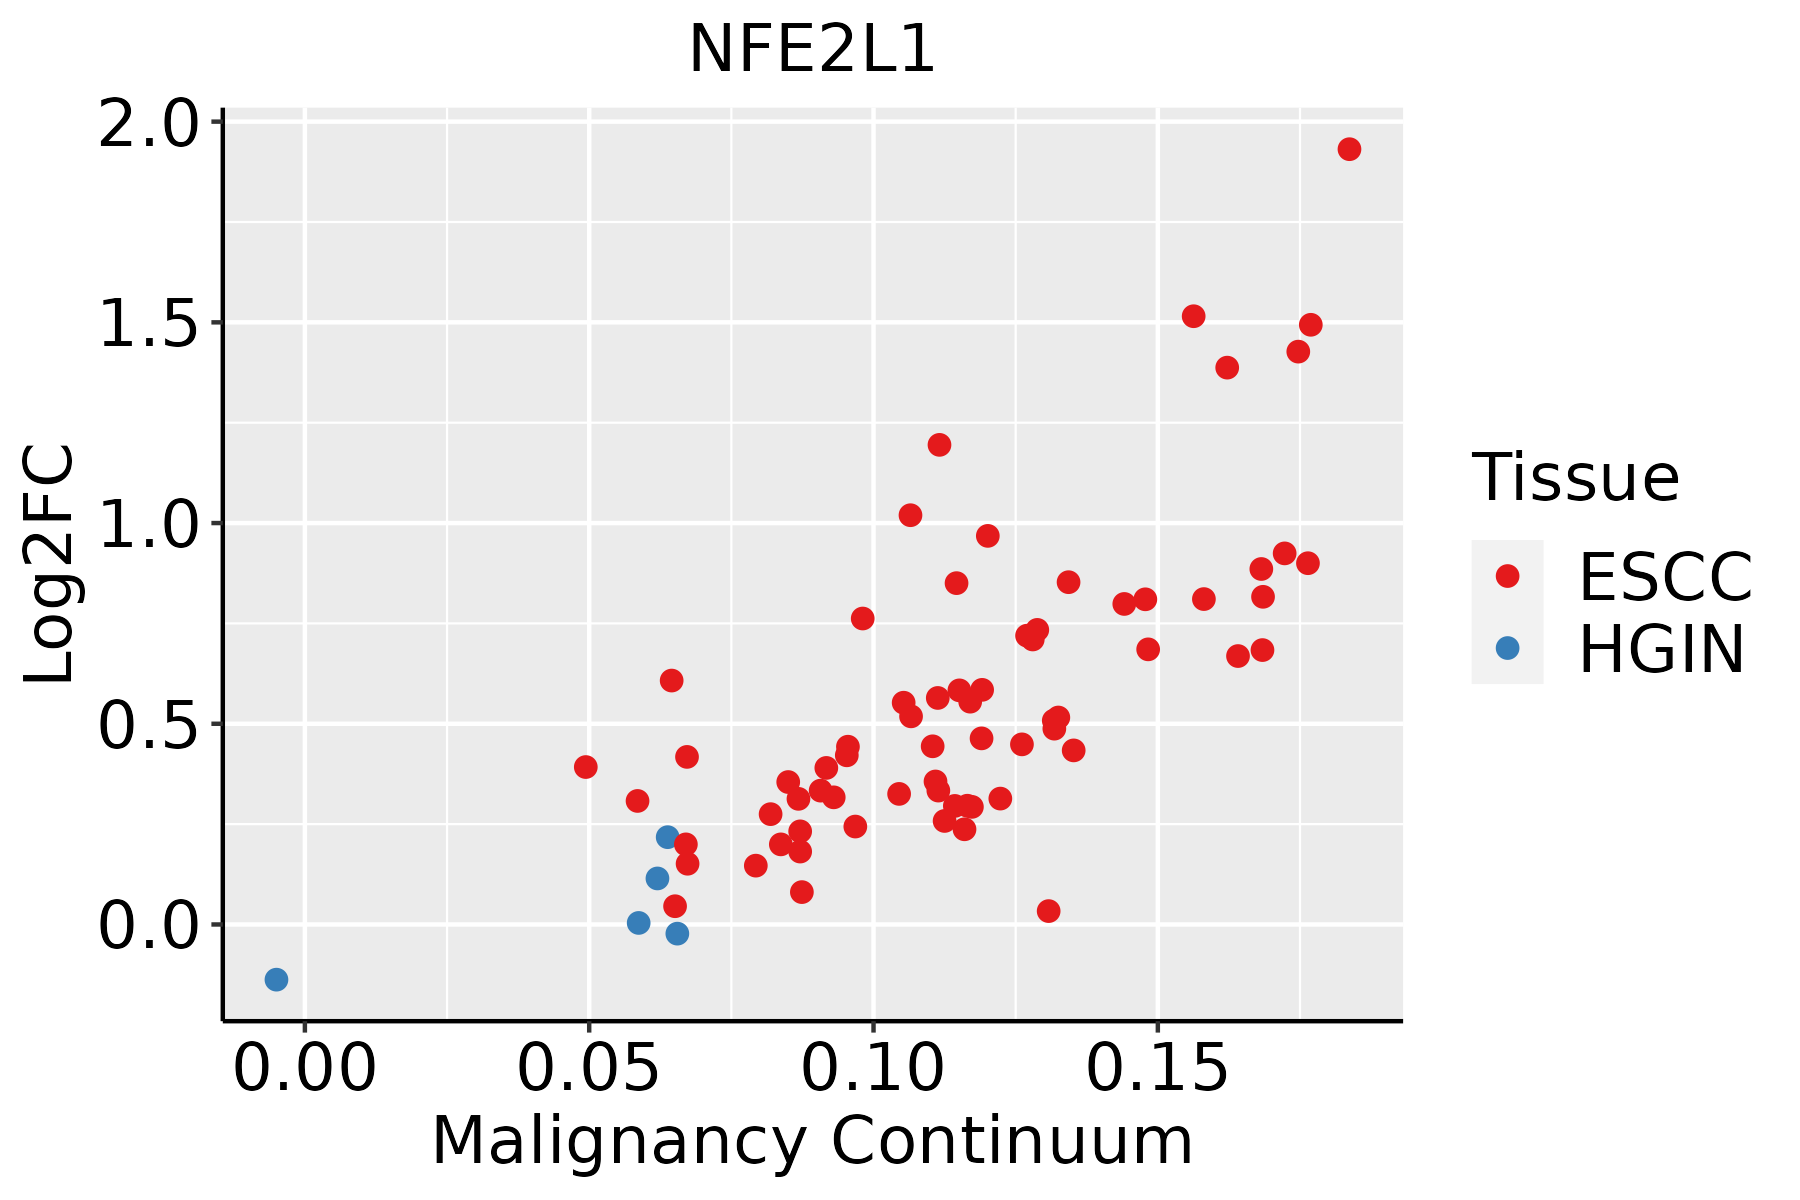 | ESCC: Esophageal squamous cell carcinoma |
| HGIN: High-grade intraepithelial neoplasias | ||
| LGIN: Low-grade intraepithelial neoplasias | ||
| Liver | 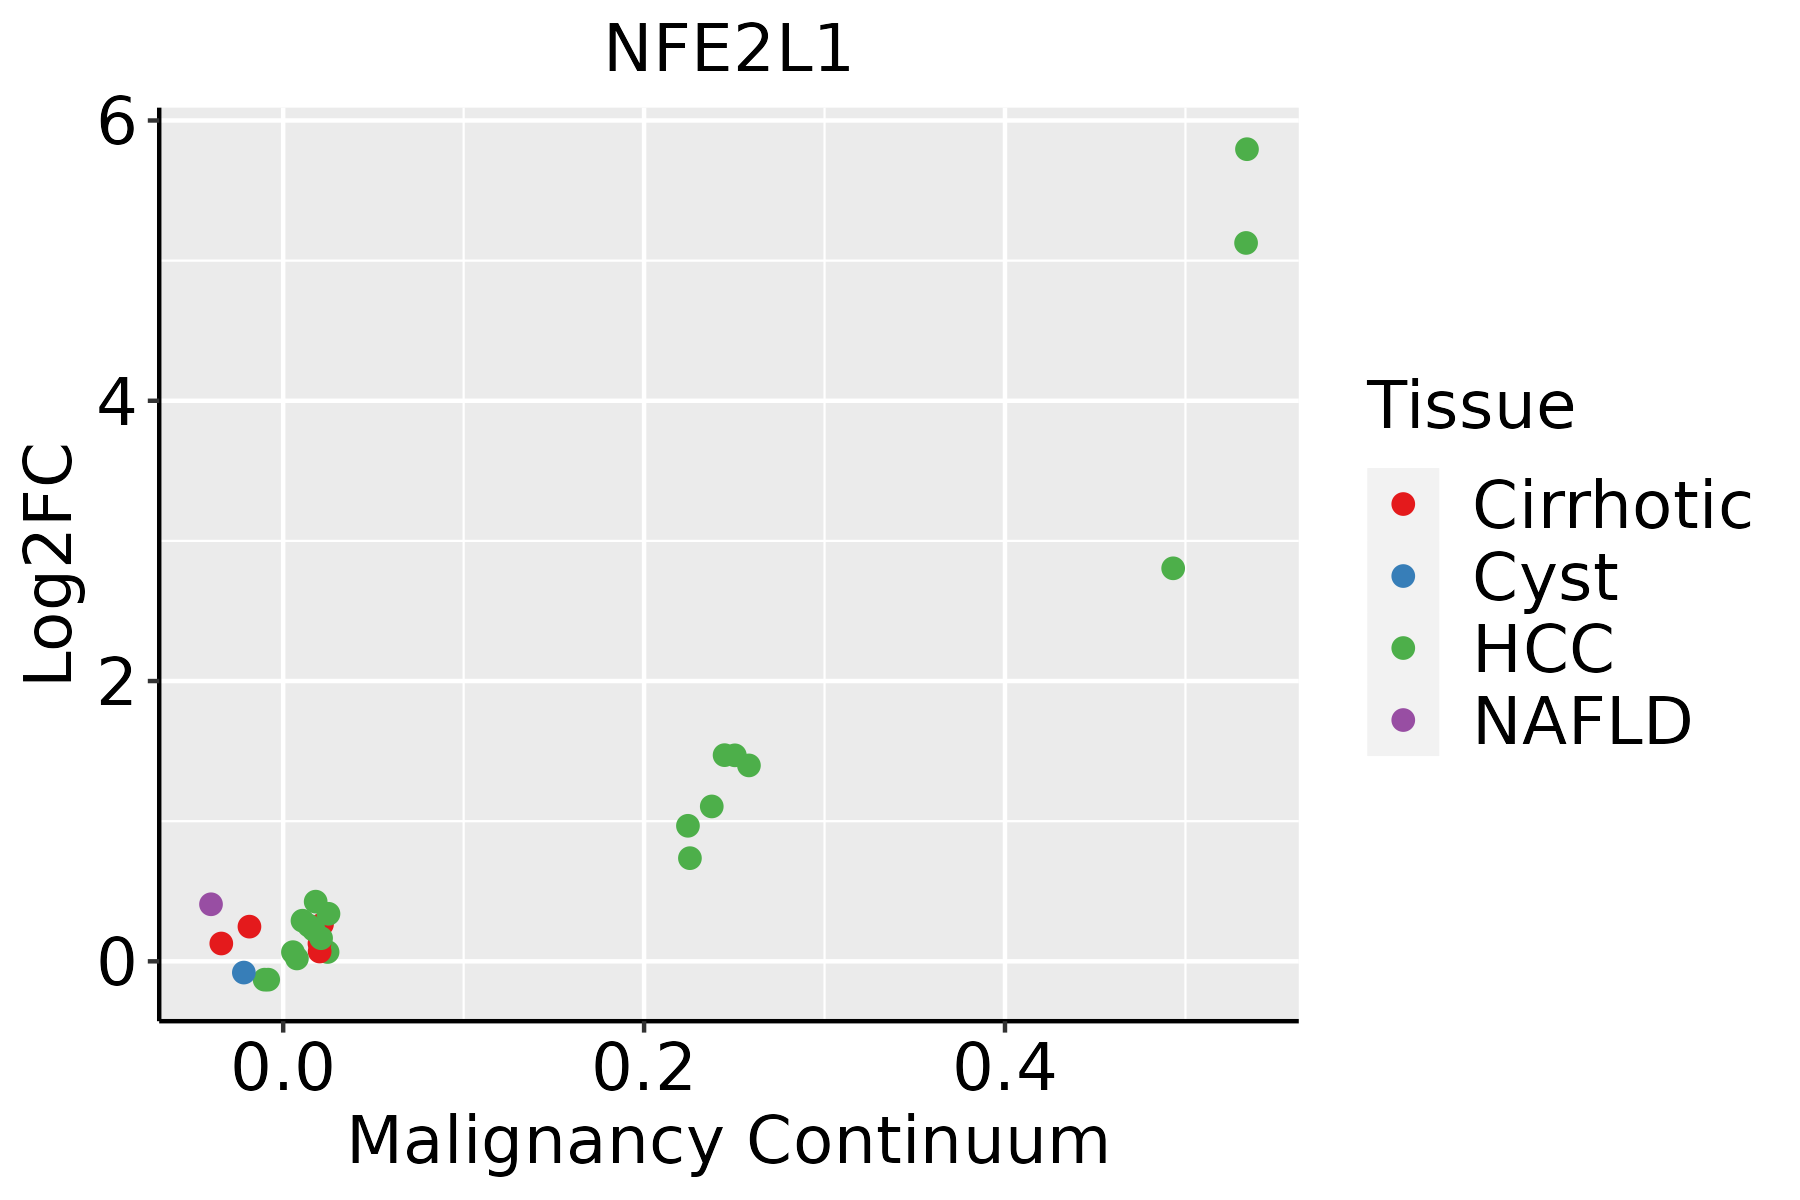 | HCC: Hepatocellular carcinoma |
| NAFLD: Non-alcoholic fatty liver disease | ||
| Oral Cavity |  | EOLP: Erosive Oral lichen planus |
| LP: leukoplakia | ||
| NEOLP: Non-erosive oral lichen planus | ||
| OSCC: Oral squamous cell carcinoma | ||
| Prostate | 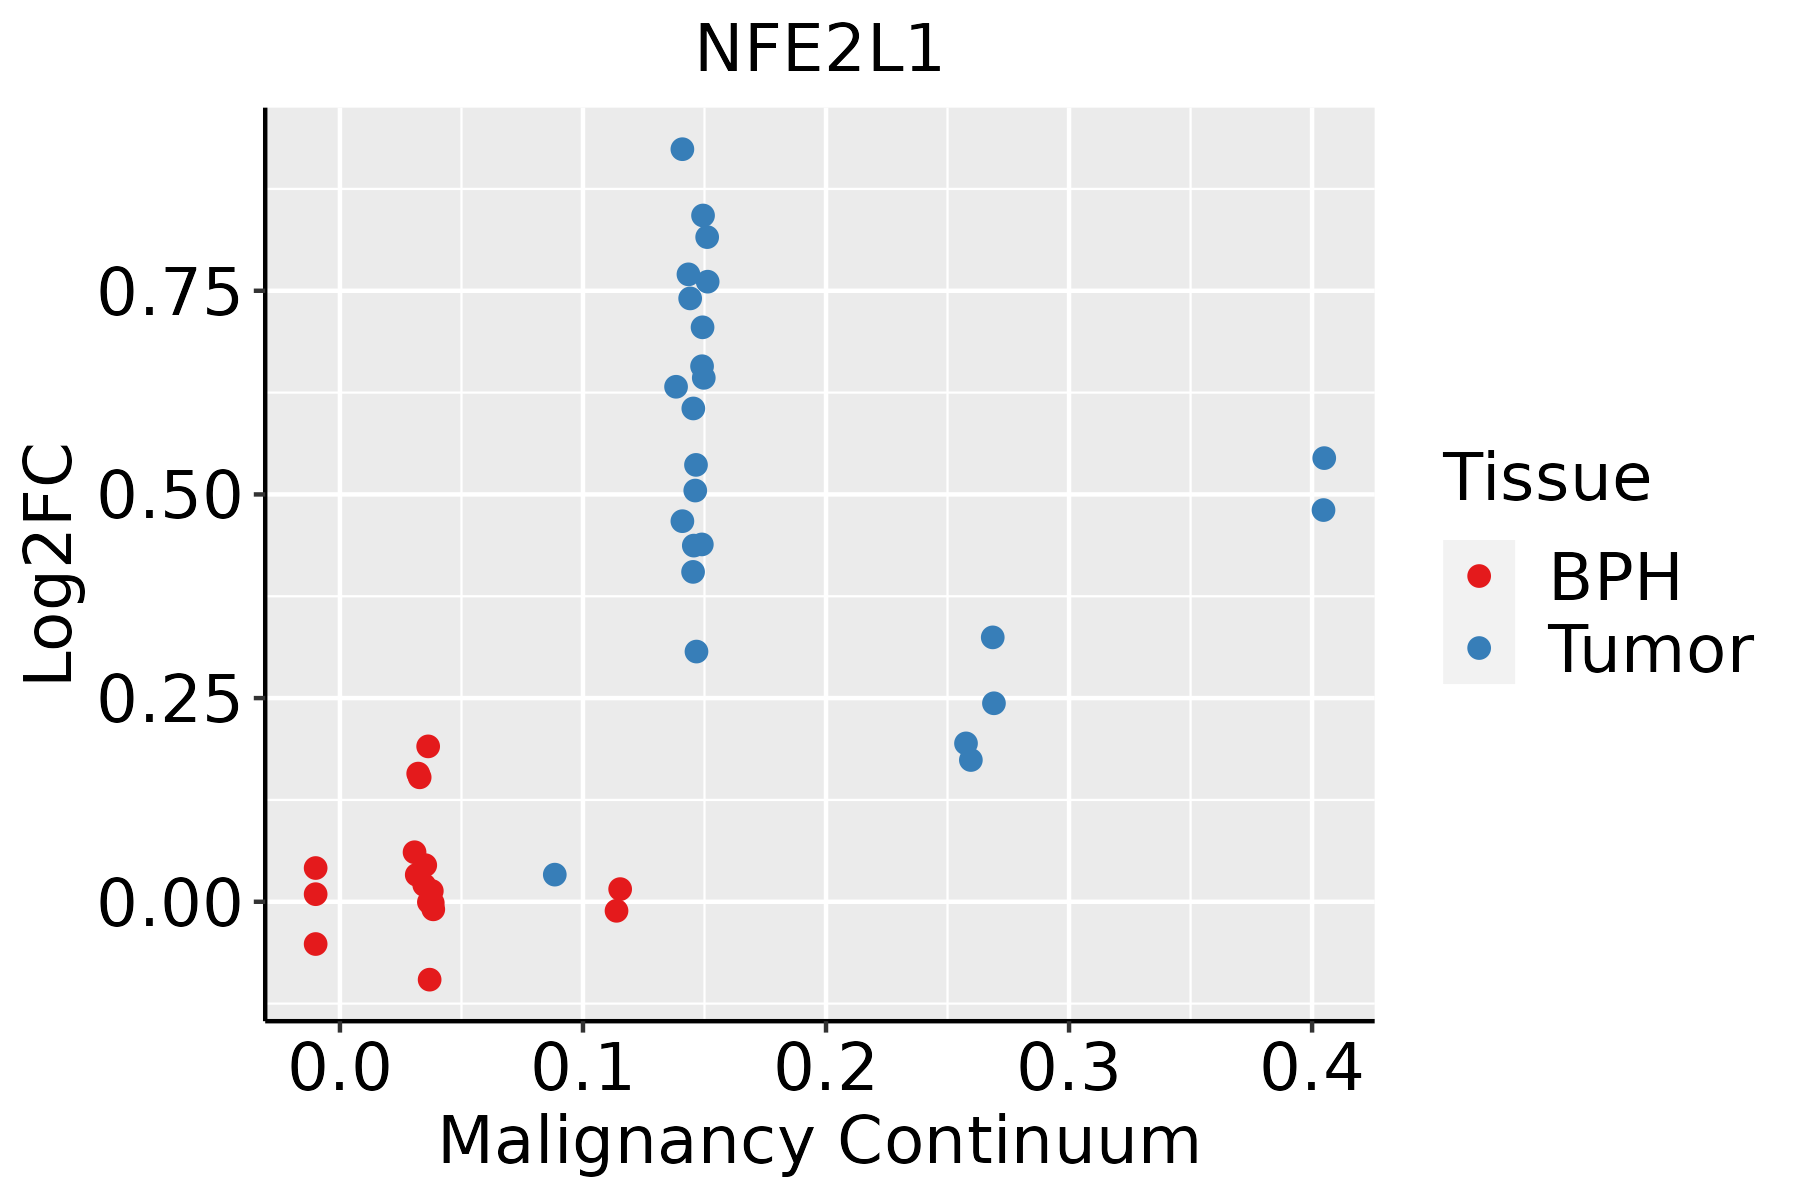 | BPH: Benign Prostatic Hyperplasia |
| Skin |  | AK: Actinic keratosis |
| cSCC: Cutaneous squamous cell carcinoma | ||
| SCCIS:squamous cell carcinoma in situ | ||
| Thyroid | 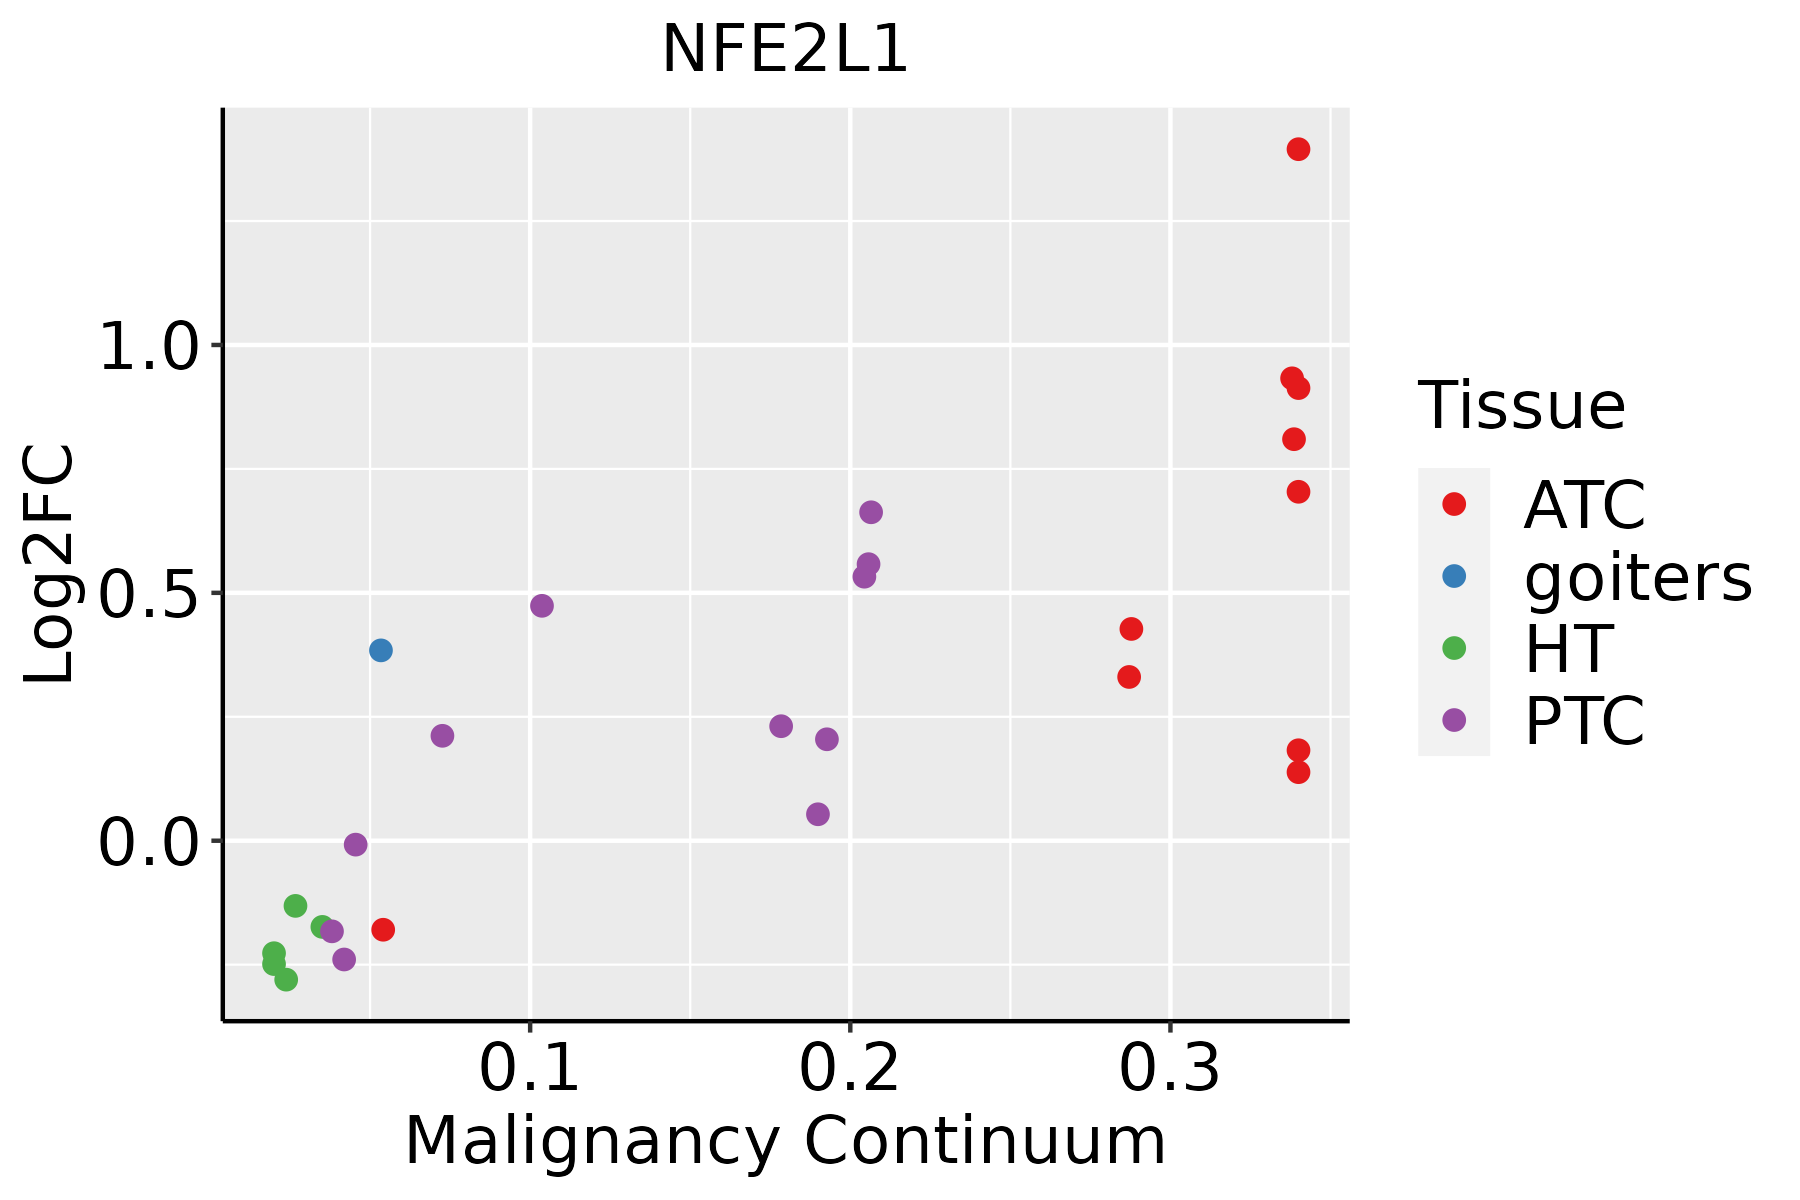 | ATC: Anaplastic thyroid cancer |
| HT: Hashimoto's thyroiditis | ||
| PTC: Papillary thyroid cancer |
| ∗log2FC in expression of this searched gene in stem-like cells from each diseased tissue sample relative to stem-like cells in normal samples in each tissue plotted against the malignancy continuum. Samples are colored based on if they are from different disease stage. |
Top |
Malignant transformation related pathway analysis |
| Find out the enriched GO biological processes and KEGG pathways involved in transition from healthy to precancer to cancer |
| Tissue | Disease Stage | Enriched GO biological Processes |
| Colorectum | AD |  |
| Colorectum | SER |  |
| Colorectum | MSS |  |
| Colorectum | MSI-H |  |
| Colorectum | FAP |  |
| ∗Top 15 enriched GO BP terms are showed in the bar plot of each disease state in each tissue. Each row represents a significant GO biological process which is colored according to the -log10(p.adjust). |
| Page: 1 2 3 4 5 6 7 8 9 |
| GO ID | Tissue | Disease Stage | Description | Gene Ratio | Bg Ratio | pvalue | p.adjust | Count |
| GO:0006979 | Colorectum | AD | response to oxidative stress | 145/3918 | 446/18723 | 5.16e-09 | 3.23e-07 | 145 |
| GO:0062197 | Colorectum | AD | cellular response to chemical stress | 109/3918 | 337/18723 | 5.33e-07 | 1.95e-05 | 109 |
| GO:0034599 | Colorectum | AD | cellular response to oxidative stress | 94/3918 | 288/18723 | 2.03e-06 | 6.02e-05 | 94 |
| GO:0006066 | Colorectum | AD | alcohol metabolic process | 106/3918 | 353/18723 | 3.02e-05 | 5.57e-04 | 106 |
| GO:0008202 | Colorectum | AD | steroid metabolic process | 85/3918 | 319/18723 | 8.07e-03 | 4.75e-02 | 85 |
| GO:00069791 | Colorectum | SER | response to oxidative stress | 114/2897 | 446/18723 | 1.75e-08 | 1.28e-06 | 114 |
| GO:00621971 | Colorectum | SER | cellular response to chemical stress | 87/2897 | 337/18723 | 5.33e-07 | 2.59e-05 | 87 |
| GO:00345991 | Colorectum | SER | cellular response to oxidative stress | 73/2897 | 288/18723 | 8.52e-06 | 2.86e-04 | 73 |
| GO:00060661 | Colorectum | SER | alcohol metabolic process | 79/2897 | 353/18723 | 3.50e-04 | 5.50e-03 | 79 |
| GO:00069792 | Colorectum | MSS | response to oxidative stress | 128/3467 | 446/18723 | 7.65e-08 | 3.81e-06 | 128 |
| GO:00621972 | Colorectum | MSS | cellular response to chemical stress | 102/3467 | 337/18723 | 9.73e-08 | 4.71e-06 | 102 |
| GO:00345992 | Colorectum | MSS | cellular response to oxidative stress | 88/3467 | 288/18723 | 4.58e-07 | 1.77e-05 | 88 |
| GO:00060662 | Colorectum | MSS | alcohol metabolic process | 92/3467 | 353/18723 | 2.57e-04 | 3.46e-03 | 92 |
| GO:00069793 | Colorectum | MSI-H | response to oxidative stress | 68/1319 | 446/18723 | 1.17e-09 | 1.59e-07 | 68 |
| GO:00621973 | Colorectum | MSI-H | cellular response to chemical stress | 51/1319 | 337/18723 | 1.78e-07 | 1.52e-05 | 51 |
| GO:00345993 | Colorectum | MSI-H | cellular response to oxidative stress | 43/1319 | 288/18723 | 2.31e-06 | 1.40e-04 | 43 |
| GO:000697927 | Esophagus | HGIN | response to oxidative stress | 107/2587 | 446/18723 | 3.91e-09 | 2.76e-07 | 107 |
| GO:006219727 | Esophagus | HGIN | cellular response to chemical stress | 76/2587 | 337/18723 | 8.00e-06 | 2.41e-04 | 76 |
| GO:003459926 | Esophagus | HGIN | cellular response to oxidative stress | 65/2587 | 288/18723 | 3.42e-05 | 8.66e-04 | 65 |
| GO:0006979111 | Esophagus | ESCC | response to oxidative stress | 303/8552 | 446/18723 | 7.15e-22 | 1.30e-19 | 303 |
| Page: 1 2 3 4 5 |
| Pathway ID | Tissue | Disease Stage | Description | Gene Ratio | Bg Ratio | pvalue | p.adjust | qvalue | Count |
| Page: 1 |
Top |
Cell-cell communication analysis |
| Identification of potential cell-cell interactions between two cell types and their ligand-receptor pairs for different disease states |
| Ligand | Receptor | LRpair | Pathway | Tissue | Disease Stage |
| Page: 1 |
Top |
Single-cell gene regulatory network inference analysis |
| Find out the significant the regulons (TFs) and the target genes of each regulon across cell types for different disease states |
| TF | Cell Type | Tissue | Disease Stage | Target Gene | RSS | Regulon Activity |
| NFE2L1 | ABS | Colorectum | AD | RABGAP1,ITM2C,FXYD3, etc. | 2.75e-01 |  |
| NFE2L1 | ABS | Colorectum | CRC | ANKRD40,CD63,DHFR, etc. | 5.92e-02 |  |
| NFE2L1 | ICAF | Endometrium | ADJ | PLEKHH2,PCDHB4,MTRNR2L12, etc. | 8.58e-03 |  |
| NFE2L1 | MYOFIB | Endometrium | ADJ | PLEKHH2,PCDHB4,MTRNR2L12, etc. | 0.00e+00 | |
| NFE2L1 | KER | Esophagus | HGIN | ITGB4,ITGA3,FAT2, etc. | 2.23e-01 |  |
| NFE2L1 | STM | Esophagus | HGIN | ITGB4,ITGA3,FAT2, etc. | 2.31e-01 | |
| NFE2L1 | MSC.MVA | Liver | Cirrhotic | XPOT,SEMA3G,LAMB2, etc. | 1.61e-01 |  |
| NFE2L1 | MSC.MVA | Liver | HCC | XPOT,SEMA3G,LAMB2, etc. | 1.51e-01 |  |
| NFE2L1 | MSC | Liver | Healthy | XPOT,SEMA3G,LAMB2, etc. | 2.47e-02 |  |
| NFE2L1 | MVA | Liver | Healthy | XPOT,SEMA3G,LAMB2, etc. | 5.98e-02 | |
| ∗The dot plots of a searched regulon are shown for all cell subpopulations in each disease state of each tissue based on the regulon specific score inferred using pySCENIC and by calculating the average expression. |
| Page: 1 2 |
Top |
Somatic mutation of malignant transformation related genes |
| Annotation of somatic variants for genes involved in malignant transformation |
| Hugo Symbol | Variant Class | Variant Classification | dbSNP RS | HGVSc | HGVSp | HGVSp Short | SWISSPROT | BIOTYPE | SIFT | PolyPhen | Tumor Sample Barcode | Tissue | Histology | Sex | Age | Stage | Therapy Types | Drugs | Outcome |
| NFE2L1 | SNV | Missense_Mutation | c.1681N>G | p.Gln561Glu | p.Q561E | Q14494 | protein_coding | tolerated(1) | benign(0.11) | TCGA-A1-A0SI-01 | Breast | breast invasive carcinoma | Female | <65 | I/II | Unknown | Unknown | SD | |
| NFE2L1 | SNV | Missense_Mutation | c.1928N>T | p.Ser643Phe | p.S643F | Q14494 | protein_coding | deleterious(0) | possibly_damaging(0.723) | TCGA-A8-A07R-01 | Breast | breast invasive carcinoma | Female | >=65 | III/IV | Ancillary | zoledronic | SD | |
| NFE2L1 | SNV | Missense_Mutation | c.1856N>A | p.Arg619Gln | p.R619Q | Q14494 | protein_coding | tolerated(0.08) | benign(0.228) | TCGA-A8-A09Z-01 | Breast | breast invasive carcinoma | Female | >=65 | I/II | Unknown | Unknown | SD | |
| NFE2L1 | SNV | Missense_Mutation | novel | c.37N>T | p.Leu13Phe | p.L13F | Q14494 | protein_coding | deleterious(0) | possibly_damaging(0.478) | TCGA-AO-A0JC-01 | Breast | breast invasive carcinoma | Female | <65 | I/II | Chemotherapy | fluorouracil | SD |
| NFE2L1 | SNV | Missense_Mutation | c.1502N>T | p.Ser501Phe | p.S501F | Q14494 | protein_coding | tolerated(0.24) | probably_damaging(0.982) | TCGA-BH-A18Q-01 | Breast | breast invasive carcinoma | Female | <65 | I/II | Unknown | Unknown | SD | |
| NFE2L1 | SNV | Missense_Mutation | c.524T>A | p.Ile175Asn | p.I175N | Q14494 | protein_coding | deleterious(0) | possibly_damaging(0.499) | TCGA-D8-A1XK-01 | Breast | breast invasive carcinoma | Female | <65 | I/II | Chemotherapy | doxorubicine+cyclophosphamide | SD | |
| NFE2L1 | insertion | In_Frame_Ins | novel | c.2237_2238insCCCTTT | p.Gly746_Ser747insProPhe | p.G746_S747insPF | Q14494 | protein_coding | TCGA-A7-A0CJ-01 | Breast | breast invasive carcinoma | Female | <65 | I/II | Chemotherapy | cytoxan | SD | ||
| NFE2L1 | insertion | Frame_Shift_Ins | novel | c.2239_2240insCCAATGACAAAATCATCAACCTGCCT | p.Ser747ThrfsTer129 | p.S747Tfs*129 | Q14494 | protein_coding | TCGA-A7-A0CJ-01 | Breast | breast invasive carcinoma | Female | <65 | I/II | Chemotherapy | cytoxan | SD | ||
| NFE2L1 | insertion | Frame_Shift_Ins | novel | c.2146dupA | p.Ser716LysfsTer13 | p.S716Kfs*13 | Q14494 | protein_coding | TCGA-A8-A0AB-01 | Breast | breast invasive carcinoma | Female | <65 | I/II | Chemotherapy | 5-fluorouracil | CR | ||
| NFE2L1 | insertion | Nonsense_Mutation | novel | c.2147_2148insGTGCGGTTGGCTACAGCTCTGACTCTGAGAC | p.Ser716ArgfsTer8 | p.S716Rfs*8 | Q14494 | protein_coding | TCGA-A8-A0AB-01 | Breast | breast invasive carcinoma | Female | <65 | I/II | Chemotherapy | 5-fluorouracil | CR |
| Page: 1 2 3 4 5 6 7 8 9 10 |
Top |
Related drugs of malignant transformation related genes |
| Identification of chemicals and drugs interact with genes involved in malignant transfromation |
| (DGIdb 4.0) |
| Entrez ID | Symbol | Category | Interaction Types | Drug Claim Name | Drug Name | PMIDs |
| Page: 1 |

Copyright 2023-Present -The University of Texas Health Science Center at Houston |