
|
|||||
|
 | |
| |
| |
| |
| |
| |
|
Gene: NFATC2IP |
Gene summary for NFATC2IP |
| Gene information | Species | Human | Gene symbol | NFATC2IP | Gene ID | 84901 |
| Gene name | nuclear factor of activated T cells 2 interacting protein | |
| Gene Alias | ESC2 | |
| Cytomap | 16p11.2 | |
| Gene Type | protein-coding | GO ID | GO:0001816 | UniProtAcc | Q8NCF5 |
Top |
Malignant transformation analysis |
| Identification of the aberrant gene expression in precancerous and cancerous lesions by comparing the gene expression of stem-like cells in diseased tissues with normal stem cells |
| Entrez ID | Symbol | Replicates | Species | Organ | Tissue | Adj P-value | Log2FC | Malignancy |
| 84901 | NFATC2IP | CCI_2 | Human | Cervix | CC | 4.33e-04 | 6.98e-01 | 0.5249 |
| 84901 | NFATC2IP | CCI_3 | Human | Cervix | CC | 1.92e-02 | 5.32e-01 | 0.516 |
| 84901 | NFATC2IP | sample3 | Human | Cervix | CC | 1.41e-02 | 1.90e-01 | 0.1387 |
| 84901 | NFATC2IP | T3 | Human | Cervix | CC | 4.04e-04 | 2.10e-01 | 0.1389 |
| 84901 | NFATC2IP | LZE7T | Human | Esophagus | ESCC | 1.25e-07 | 3.90e-01 | 0.0667 |
| 84901 | NFATC2IP | LZE20T | Human | Esophagus | ESCC | 3.59e-08 | 1.56e-01 | 0.0662 |
| 84901 | NFATC2IP | LZE24T | Human | Esophagus | ESCC | 4.80e-17 | 6.26e-01 | 0.0596 |
| 84901 | NFATC2IP | P1T-E | Human | Esophagus | ESCC | 1.26e-11 | 7.35e-01 | 0.0875 |
| 84901 | NFATC2IP | P2T-E | Human | Esophagus | ESCC | 1.58e-48 | 8.13e-01 | 0.1177 |
| 84901 | NFATC2IP | P4T-E | Human | Esophagus | ESCC | 6.00e-45 | 1.13e+00 | 0.1323 |
| 84901 | NFATC2IP | P5T-E | Human | Esophagus | ESCC | 8.06e-18 | 3.67e-01 | 0.1327 |
| 84901 | NFATC2IP | P8T-E | Human | Esophagus | ESCC | 7.46e-20 | 3.50e-01 | 0.0889 |
| 84901 | NFATC2IP | P9T-E | Human | Esophagus | ESCC | 2.72e-12 | 2.52e-01 | 0.1131 |
| 84901 | NFATC2IP | P10T-E | Human | Esophagus | ESCC | 1.90e-13 | 3.14e-01 | 0.116 |
| 84901 | NFATC2IP | P11T-E | Human | Esophagus | ESCC | 1.50e-06 | 3.12e-01 | 0.1426 |
| 84901 | NFATC2IP | P12T-E | Human | Esophagus | ESCC | 2.34e-25 | 4.61e-01 | 0.1122 |
| 84901 | NFATC2IP | P15T-E | Human | Esophagus | ESCC | 4.04e-11 | 2.55e-01 | 0.1149 |
| 84901 | NFATC2IP | P16T-E | Human | Esophagus | ESCC | 1.19e-06 | 2.55e-01 | 0.1153 |
| 84901 | NFATC2IP | P17T-E | Human | Esophagus | ESCC | 2.60e-07 | 2.99e-01 | 0.1278 |
| 84901 | NFATC2IP | P20T-E | Human | Esophagus | ESCC | 2.04e-22 | 4.97e-01 | 0.1124 |
| Page: 1 2 3 4 5 6 |
| Tissue | Expression Dynamics | Abbreviation |
| Cervix |  | CC: Cervix cancer |
| HSIL_HPV: HPV-infected high-grade squamous intraepithelial lesions | ||
| N_HPV: HPV-infected normal cervix | ||
| Esophagus | 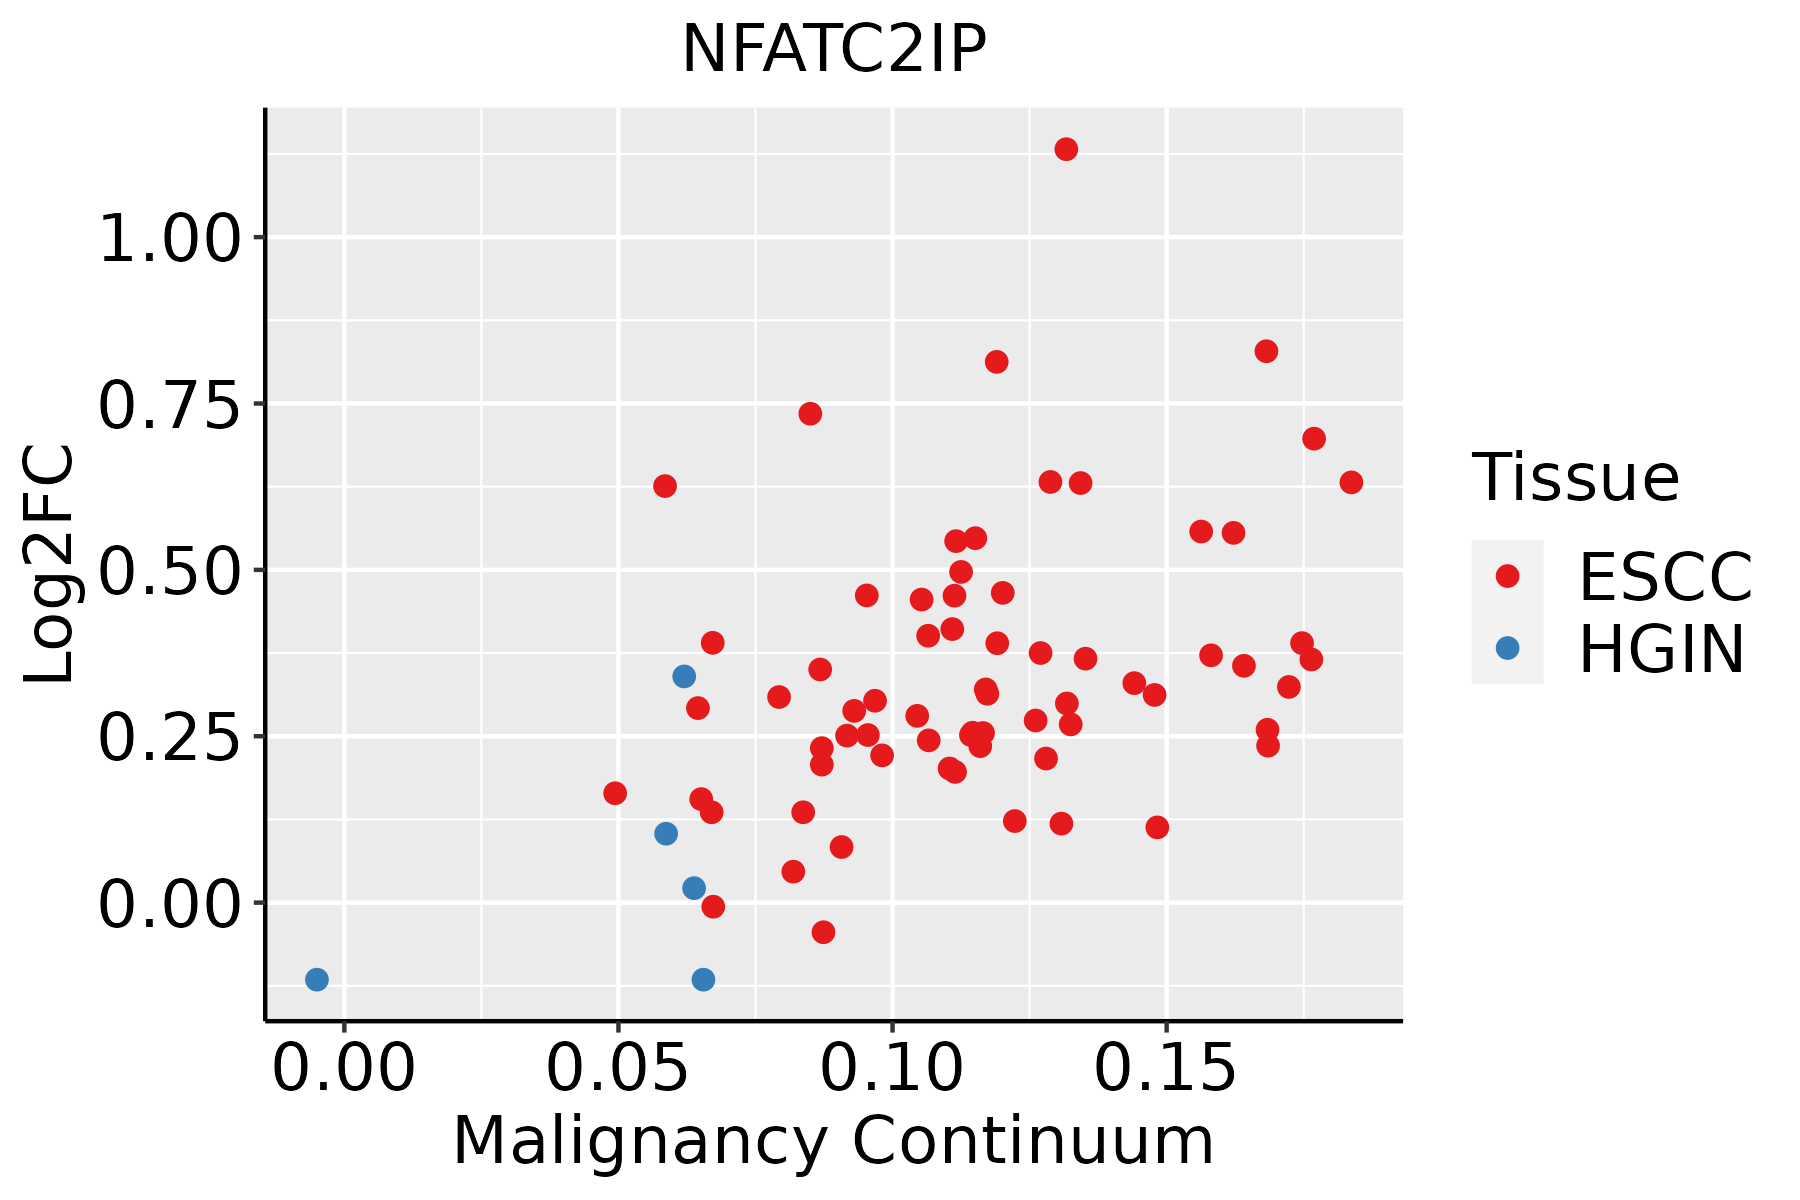 | ESCC: Esophageal squamous cell carcinoma |
| HGIN: High-grade intraepithelial neoplasias | ||
| LGIN: Low-grade intraepithelial neoplasias | ||
| Liver | 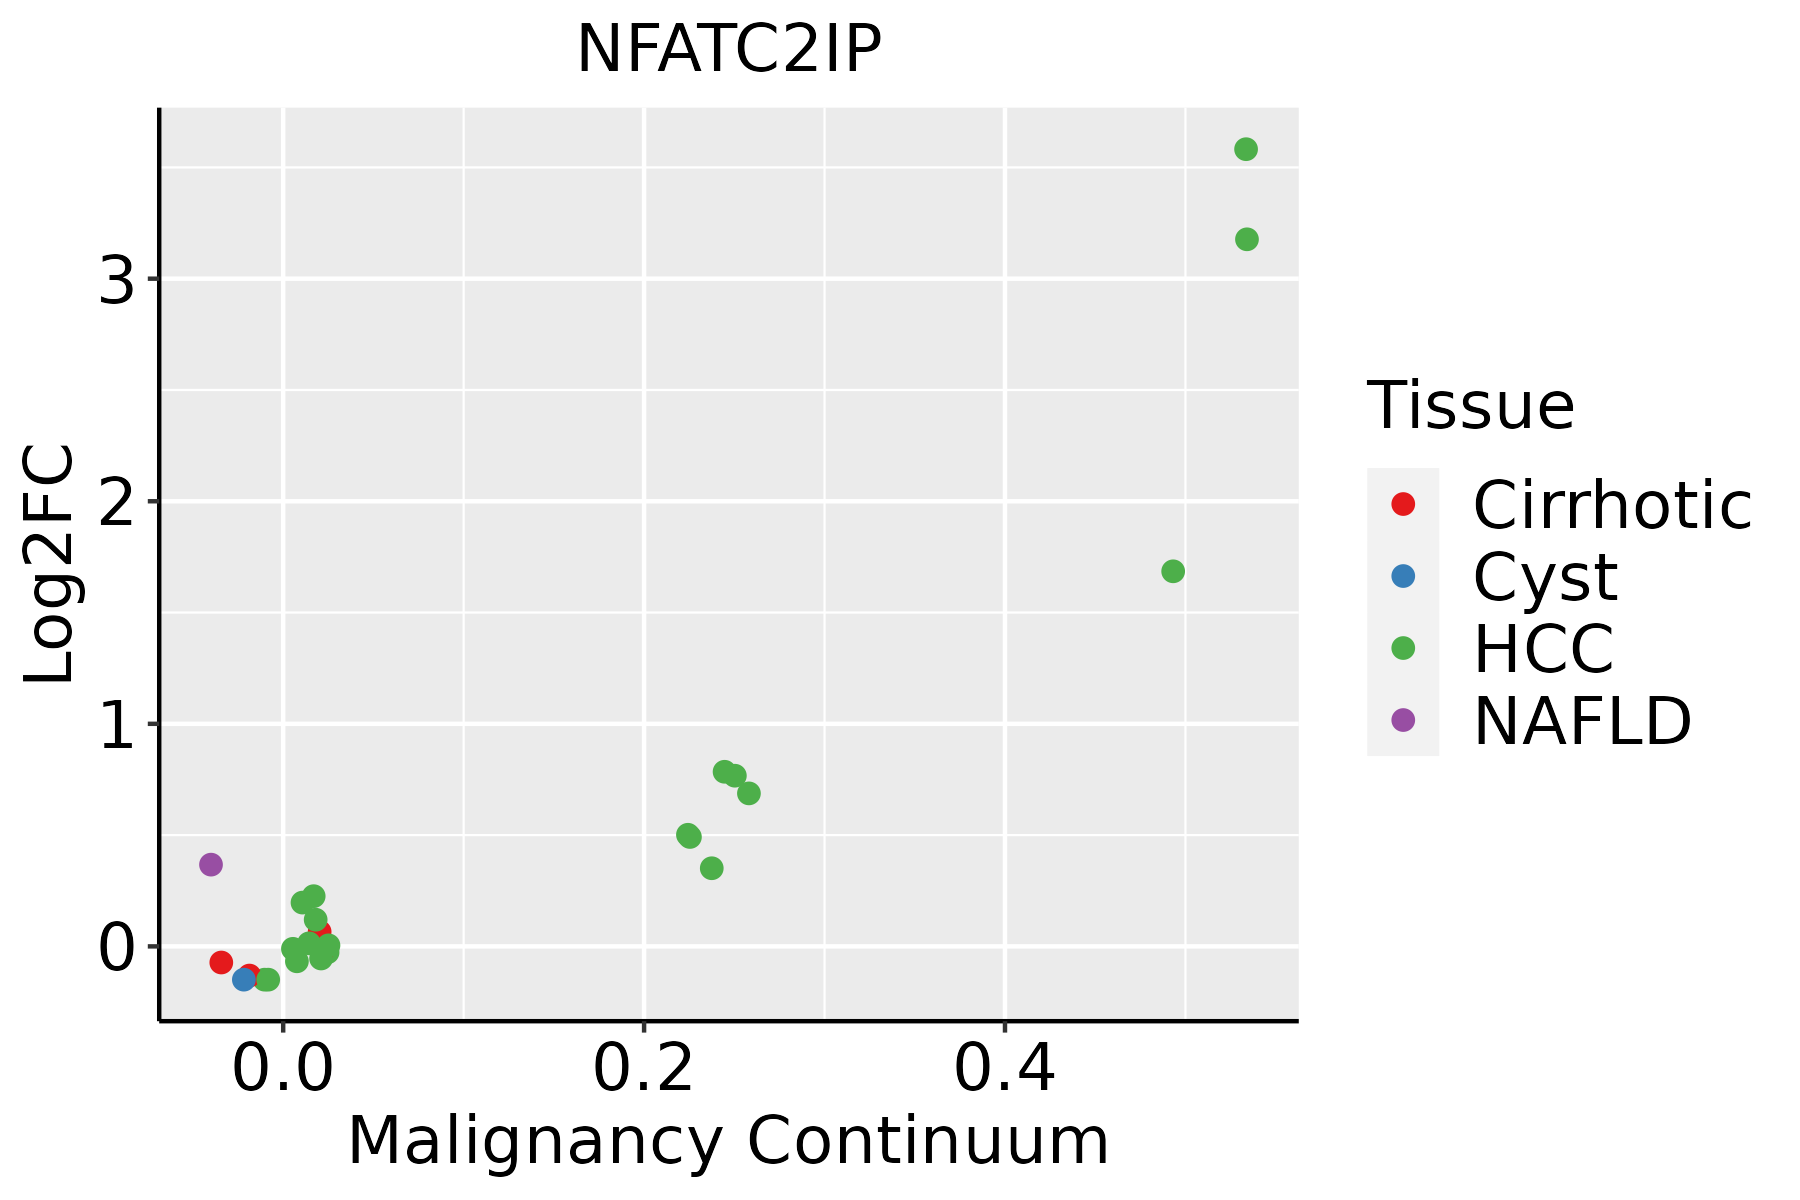 | HCC: Hepatocellular carcinoma |
| NAFLD: Non-alcoholic fatty liver disease | ||
| Oral Cavity |  | EOLP: Erosive Oral lichen planus |
| LP: leukoplakia | ||
| NEOLP: Non-erosive oral lichen planus | ||
| OSCC: Oral squamous cell carcinoma | ||
| Skin |  | AK: Actinic keratosis |
| cSCC: Cutaneous squamous cell carcinoma | ||
| SCCIS:squamous cell carcinoma in situ | ||
| Thyroid | 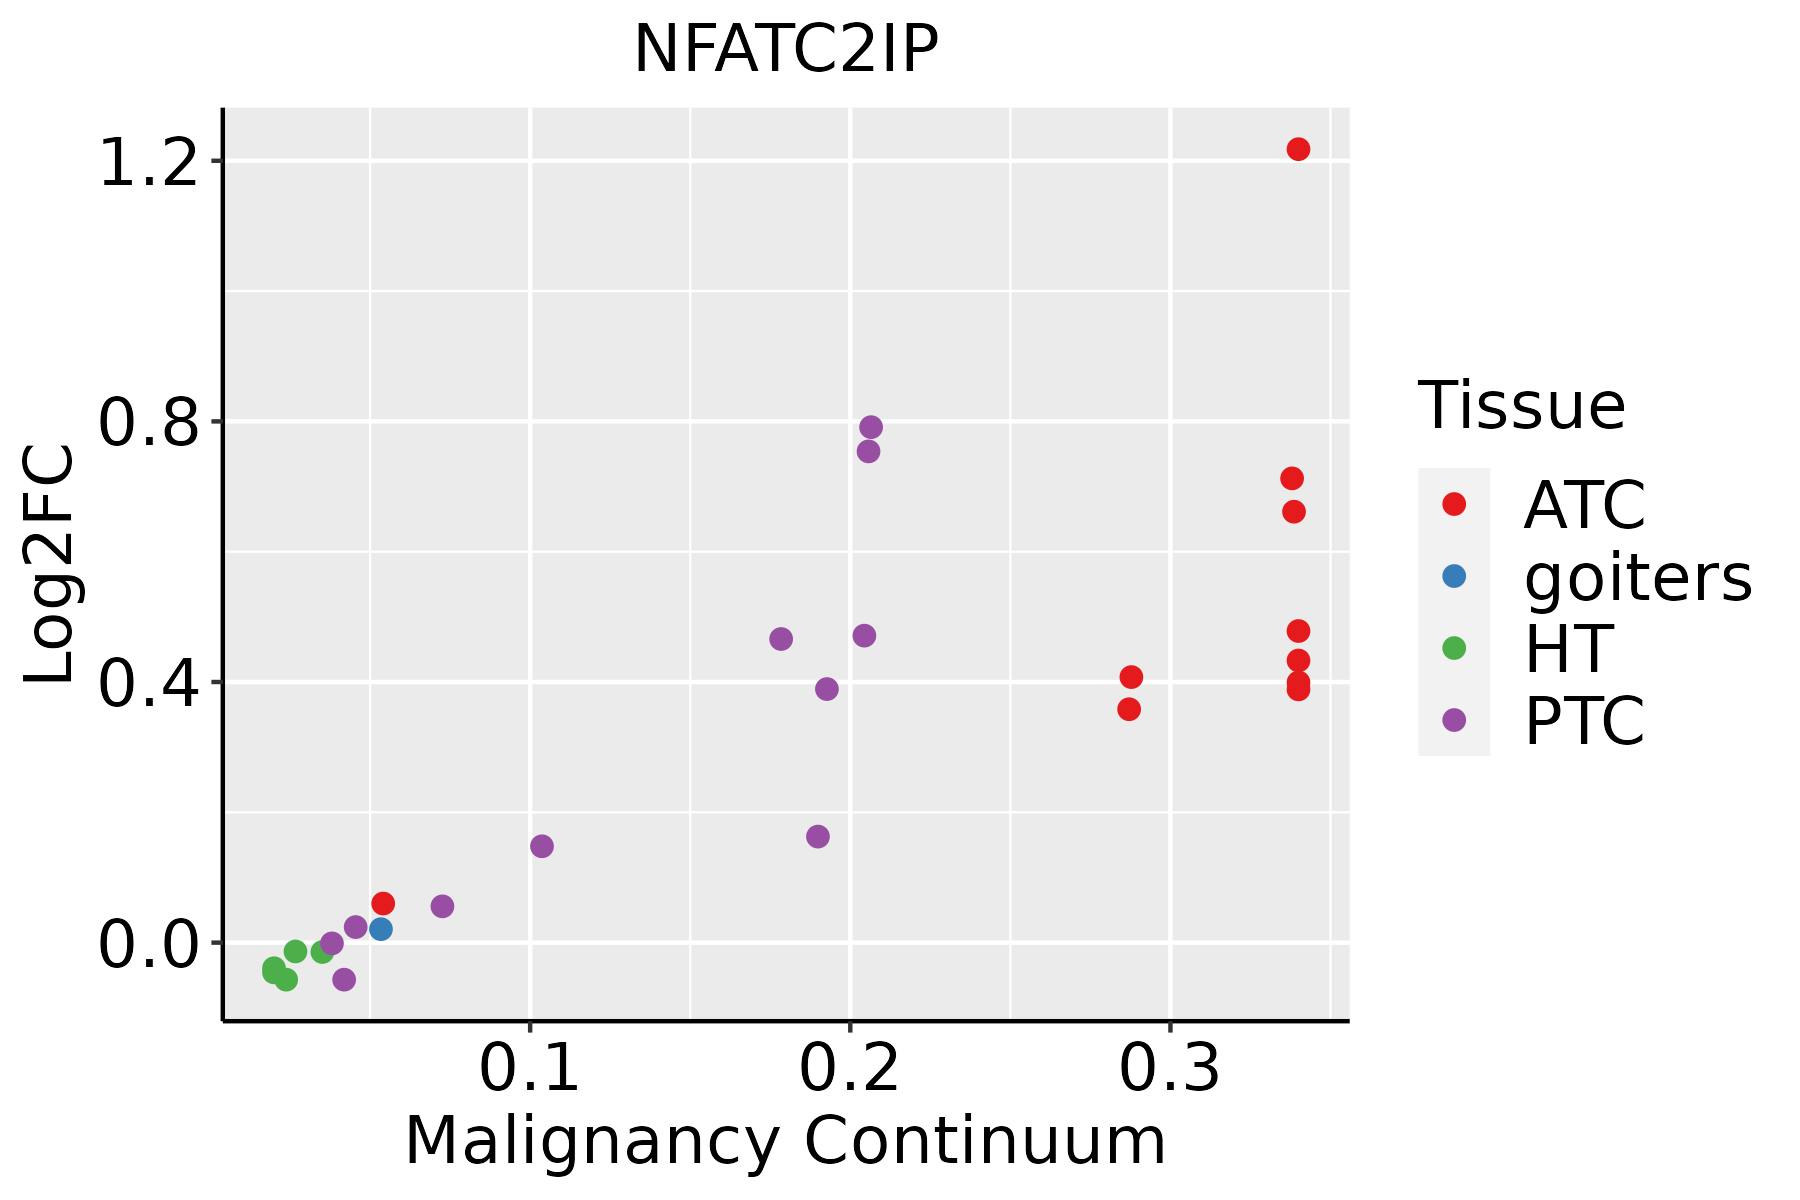 | ATC: Anaplastic thyroid cancer |
| HT: Hashimoto's thyroiditis | ||
| PTC: Papillary thyroid cancer |
| ∗log2FC in expression of this searched gene in stem-like cells from each diseased tissue sample relative to stem-like cells in normal samples in each tissue plotted against the malignancy continuum. Samples are colored based on if they are from different disease stage. |
Top |
Malignant transformation related pathway analysis |
| Find out the enriched GO biological processes and KEGG pathways involved in transition from healthy to precancer to cancer |
| Tissue | Disease Stage | Enriched GO biological Processes |
| Colorectum | AD |  |
| Colorectum | SER |  |
| Colorectum | MSS |  |
| Colorectum | MSI-H |  |
| Colorectum | FAP |  |
| ∗Top 15 enriched GO BP terms are showed in the bar plot of each disease state in each tissue. Each row represents a significant GO biological process which is colored according to the -log10(p.adjust). |
| Page: 1 2 3 4 5 6 7 8 9 |
| GO ID | Tissue | Disease Stage | Description | Gene Ratio | Bg Ratio | pvalue | p.adjust | Count |
| Page: 1 |
| Pathway ID | Tissue | Disease Stage | Description | Gene Ratio | Bg Ratio | pvalue | p.adjust | qvalue | Count |
| Page: 1 |
Top |
Cell-cell communication analysis |
| Identification of potential cell-cell interactions between two cell types and their ligand-receptor pairs for different disease states |
| Ligand | Receptor | LRpair | Pathway | Tissue | Disease Stage |
| Page: 1 |
Top |
Single-cell gene regulatory network inference analysis |
| Find out the significant the regulons (TFs) and the target genes of each regulon across cell types for different disease states |
| TF | Cell Type | Tissue | Disease Stage | Target Gene | RSS | Regulon Activity |
| ∗The dot plots of a searched regulon are shown for all cell subpopulations in each disease state of each tissue based on the regulon specific score inferred using pySCENIC and by calculating the average expression. |
| Page: 1 |
Top |
Somatic mutation of malignant transformation related genes |
| Annotation of somatic variants for genes involved in malignant transformation |
| Hugo Symbol | Variant Class | Variant Classification | dbSNP RS | HGVSc | HGVSp | HGVSp Short | SWISSPROT | BIOTYPE | SIFT | PolyPhen | Tumor Sample Barcode | Tissue | Histology | Sex | Age | Stage | Therapy Types | Drugs | Outcome |
| NFATC2IP | SNV | Missense_Mutation | novel | c.902N>T | p.Pro301Leu | p.P301L | Q8NCF5 | protein_coding | deleterious(0) | probably_damaging(0.976) | TCGA-C8-A12L-01 | Breast | breast invasive carcinoma | Female | >=65 | I/II | Unknown | Unknown | SD |
| NFATC2IP | insertion | Frame_Shift_Ins | novel | c.706_707insC | p.Lys236ThrfsTer14 | p.K236Tfs*14 | Q8NCF5 | protein_coding | TCGA-A8-A08H-01 | Breast | breast invasive carcinoma | Female | >=65 | I/II | Unknown | Unknown | SD | ||
| NFATC2IP | insertion | Nonsense_Mutation | novel | c.709_710insTGGAAAAATCCTCAACAAAATACTAGTAAAC | p.Pro237LeufsTer9 | p.P237Lfs*9 | Q8NCF5 | protein_coding | TCGA-A8-A08H-01 | Breast | breast invasive carcinoma | Female | >=65 | I/II | Unknown | Unknown | SD | ||
| NFATC2IP | SNV | Missense_Mutation | novel | c.223N>A | p.Pro75Thr | p.P75T | Q8NCF5 | protein_coding | tolerated_low_confidence(0.42) | benign(0.077) | TCGA-EK-A2R7-01 | Cervix | cervical & endocervical cancer | Female | <65 | I/II | Unknown | Unknown | SD |
| NFATC2IP | SNV | Missense_Mutation | c.880G>A | p.Ala294Thr | p.A294T | Q8NCF5 | protein_coding | deleterious(0) | possibly_damaging(0.868) | TCGA-D5-5539-01 | Colorectum | colon adenocarcinoma | Male | <65 | III/IV | Chemotherapy | 5-fu | PD | |
| NFATC2IP | SNV | Missense_Mutation | c.122G>A | p.Gly41Asp | p.G41D | Q8NCF5 | protein_coding | tolerated_low_confidence(0.21) | benign(0.007) | TCGA-WS-AB45-01 | Colorectum | colon adenocarcinoma | Female | <65 | I/II | Unknown | Unknown | SD | |
| NFATC2IP | SNV | Missense_Mutation | novel | c.171N>C | p.Glu57Asp | p.E57D | Q8NCF5 | protein_coding | tolerated_low_confidence(1) | benign(0) | TCGA-F5-6814-01 | Colorectum | rectum adenocarcinoma | Male | <65 | I/II | Unknown | Unknown | SD |
| NFATC2IP | SNV | Missense_Mutation | rs376638547 | c.479N>T | p.Ser160Leu | p.S160L | Q8NCF5 | protein_coding | tolerated(0.15) | benign(0.001) | TCGA-AP-A056-01 | Endometrium | uterine corpus endometrioid carcinoma | Female | <65 | I/II | Unknown | Unknown | SD |
| NFATC2IP | SNV | Missense_Mutation | rs143448860 | c.403C>T | p.Arg135Cys | p.R135C | Q8NCF5 | protein_coding | tolerated(0.07) | benign(0.353) | TCGA-AP-A1E0-01 | Endometrium | uterine corpus endometrioid carcinoma | Female | <65 | III/IV | Chemotherapy | paclitaxel | SD |
| NFATC2IP | SNV | Missense_Mutation | c.427N>A | p.Leu143Ile | p.L143I | Q8NCF5 | protein_coding | deleterious(0.03) | possibly_damaging(0.76) | TCGA-B5-A0JZ-01 | Endometrium | uterine corpus endometrioid carcinoma | Female | <65 | III/IV | Chemotherapy | carboplatin | PD |
| Page: 1 2 3 |
Top |
Related drugs of malignant transformation related genes |
| Identification of chemicals and drugs interact with genes involved in malignant transfromation |
| (DGIdb 4.0) |
| Entrez ID | Symbol | Category | Interaction Types | Drug Claim Name | Drug Name | PMIDs |
| Page: 1 |

Copyright 2023-Present -The University of Texas Health Science Center at Houston |