
|
|||||
|
 | |
| |
| |
| |
| |
| |
|
Gene: NFATC2 |
Gene summary for NFATC2 |
| Gene information | Species | Human | Gene symbol | NFATC2 | Gene ID | 4773 |
| Gene name | nuclear factor of activated T cells 2 | |
| Gene Alias | NFAT1 | |
| Cytomap | 20q13.2 | |
| Gene Type | protein-coding | GO ID | GO:0000122 | UniProtAcc | Q13469 |
Top |
Malignant transformation analysis |
| Identification of the aberrant gene expression in precancerous and cancerous lesions by comparing the gene expression of stem-like cells in diseased tissues with normal stem cells |
| Entrez ID | Symbol | Replicates | Species | Organ | Tissue | Adj P-value | Log2FC | Malignancy |
| 4773 | NFATC2 | PTCwithoutHT_2 | Human | Thyroid | PTC | 2.43e-03 | -1.98e-01 | 0.0419 |
| 4773 | NFATC2 | male-WTA | Human | Thyroid | PTC | 7.65e-06 | -1.13e-01 | 0.1037 |
| 4773 | NFATC2 | PTC05 | Human | Thyroid | PTC | 1.29e-04 | -4.61e-02 | 0.2065 |
| 4773 | NFATC2 | PTC07 | Human | Thyroid | PTC | 2.66e-03 | -1.18e-01 | 0.2044 |
| 4773 | NFATC2 | ATC13 | Human | Thyroid | ATC | 2.12e-27 | 8.42e-01 | 0.34 |
| 4773 | NFATC2 | ATC5 | Human | Thyroid | ATC | 2.17e-34 | 9.50e-01 | 0.34 |
| Page: 1 |
| Tissue | Expression Dynamics | Abbreviation |
| Thyroid | 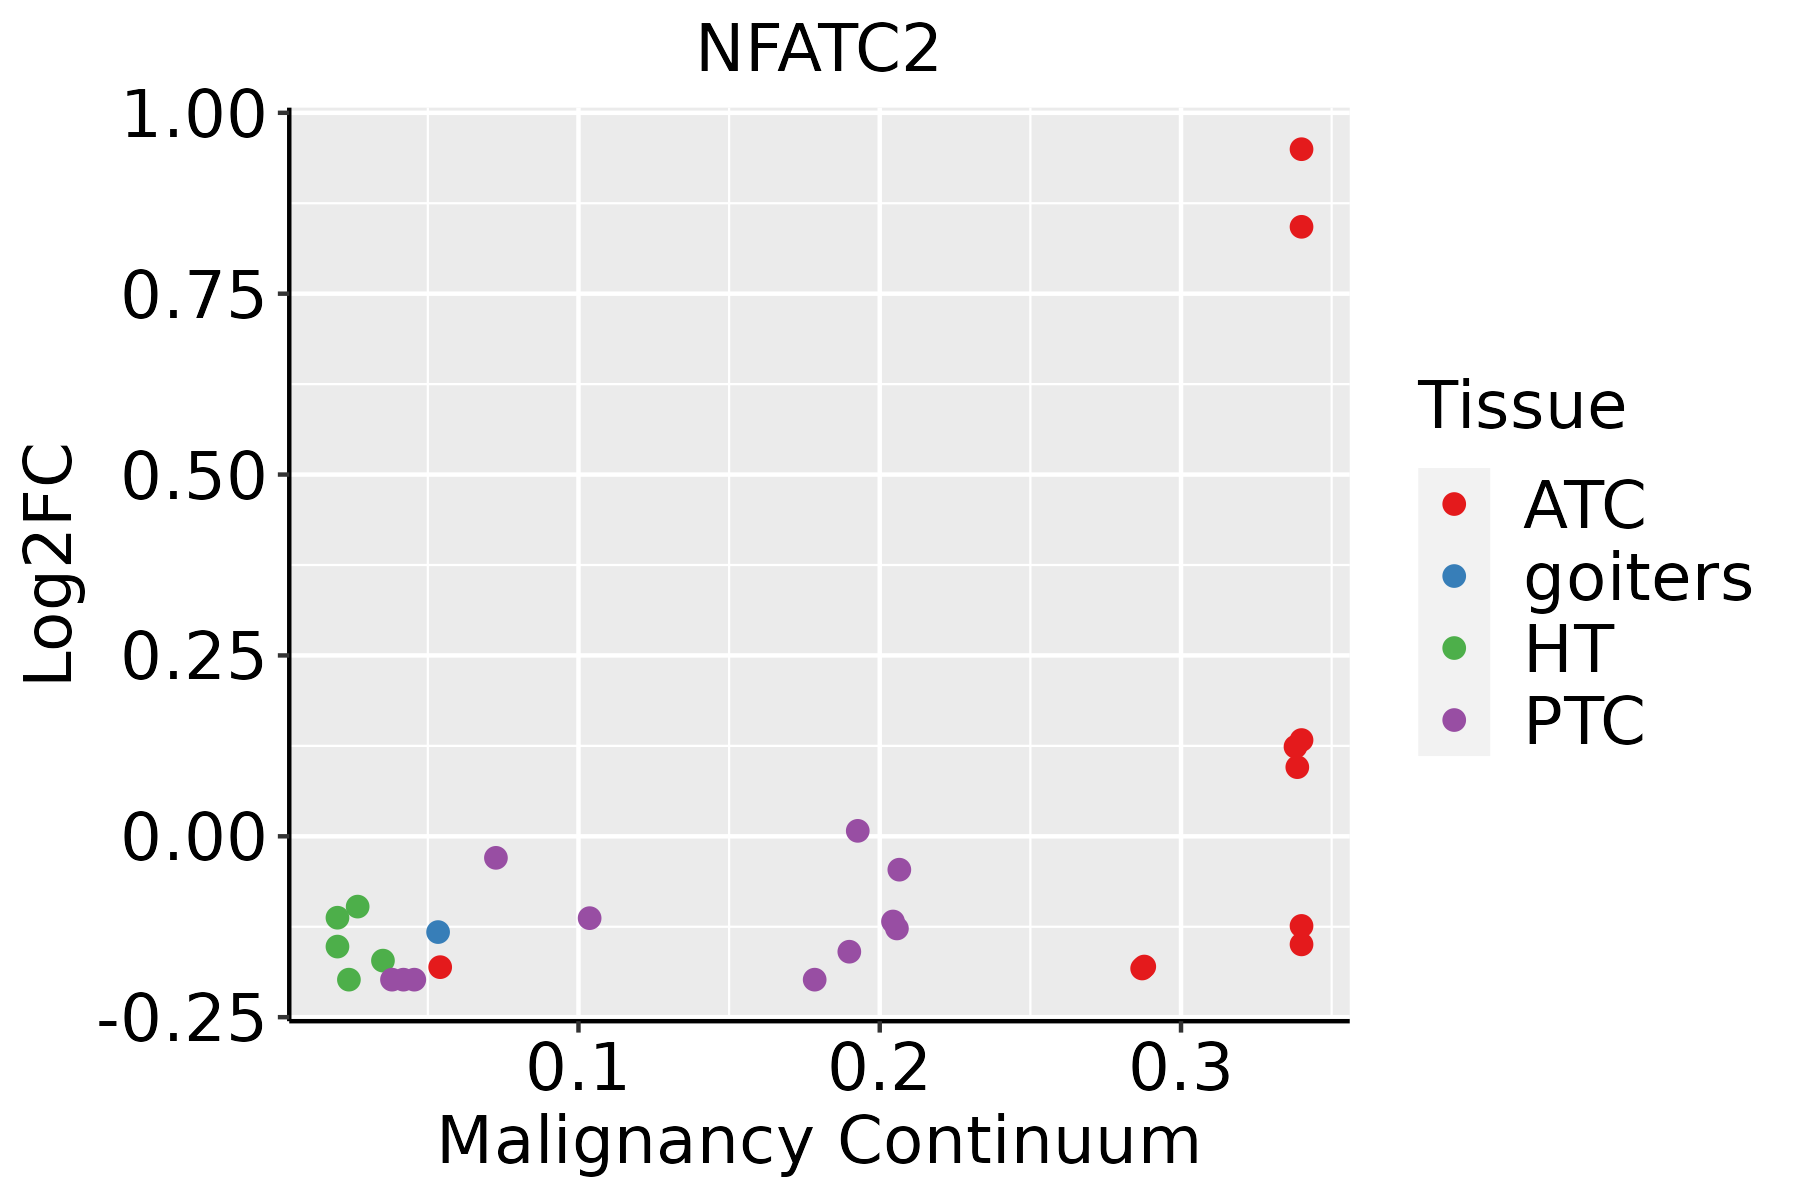 | ATC: Anaplastic thyroid cancer |
| HT: Hashimoto's thyroiditis | ||
| PTC: Papillary thyroid cancer |
| ∗log2FC in expression of this searched gene in stem-like cells from each diseased tissue sample relative to stem-like cells in normal samples in each tissue plotted against the malignancy continuum. Samples are colored based on if they are from different disease stage. |
Top |
Malignant transformation related pathway analysis |
| Find out the enriched GO biological processes and KEGG pathways involved in transition from healthy to precancer to cancer |
| Tissue | Disease Stage | Enriched GO biological Processes |
| Colorectum | AD |  |
| Colorectum | SER |  |
| Colorectum | MSS |  |
| Colorectum | MSI-H |  |
| Colorectum | FAP |  |
| ∗Top 15 enriched GO BP terms are showed in the bar plot of each disease state in each tissue. Each row represents a significant GO biological process which is colored according to the -log10(p.adjust). |
| Page: 1 2 3 4 5 6 7 8 9 |
| GO ID | Tissue | Disease Stage | Description | Gene Ratio | Bg Ratio | pvalue | p.adjust | Count |
| GO:0009410111 | Thyroid | PTC | response to xenobiotic stimulus | 171/5968 | 462/18723 | 1.00e-02 | 4.07e-02 | 171 |
| GO:004269216 | Thyroid | ATC | muscle cell differentiation | 165/6293 | 384/18723 | 7.17e-05 | 5.46e-04 | 165 |
| GO:005114617 | Thyroid | ATC | striated muscle cell differentiation | 119/6293 | 283/18723 | 1.74e-03 | 8.70e-03 | 119 |
| GO:005500112 | Thyroid | ATC | muscle cell development | 81/6293 | 184/18723 | 2.02e-03 | 9.60e-03 | 81 |
| GO:000941027 | Thyroid | ATC | response to xenobiotic stimulus | 184/6293 | 462/18723 | 2.70e-03 | 1.23e-02 | 184 |
| Page: 1 |
| Pathway ID | Tissue | Disease Stage | Description | Gene Ratio | Bg Ratio | pvalue | p.adjust | qvalue | Count |
| Page: 1 |
Top |
Cell-cell communication analysis |
| Identification of potential cell-cell interactions between two cell types and their ligand-receptor pairs for different disease states |
| Ligand | Receptor | LRpair | Pathway | Tissue | Disease Stage |
| Page: 1 |
Top |
Single-cell gene regulatory network inference analysis |
| Find out the significant the regulons (TFs) and the target genes of each regulon across cell types for different disease states |
| TF | Cell Type | Tissue | Disease Stage | Target Gene | RSS | Regulon Activity |
| NFATC2 | CD8TEXINT | Breast | ADJ | GZMK,ZBTB21,EOMES, etc. | 8.99e-02 |  |
| NFATC2 | CD8TEXP | Breast | ADJ | GZMK,ZBTB21,EOMES, etc. | 6.61e-02 | |
| NFATC2 | CD8TEXINT | Breast | DCIS | GZMK,ZBTB21,EOMES, etc. | 1.67e-01 |  |
| NFATC2 | CD8TEXP | Breast | DCIS | GZMK,ZBTB21,EOMES, etc. | 5.45e-02 | |
| NFATC2 | CD8TEREX | Breast | DCIS | GZMK,ZBTB21,EOMES, etc. | 1.61e-01 | |
| NFATC2 | CD8TCM | Breast | DCIS | GZMK,ZBTB21,EOMES, etc. | 8.39e-02 | |
| NFATC2 | CD8TRM | Breast | Healthy | GZMK,ZBTB21,EOMES, etc. | 3.95e-01 |  |
| NFATC2 | CD8TEXP | Breast | Healthy | GZMK,ZBTB21,EOMES, etc. | 3.32e-02 | |
| NFATC2 | CD8TCM | Breast | IDC | GZMK,ZBTB21,EOMES, etc. | 2.54e-01 |  |
| NFATC2 | CD8TEXINT | Breast | IDC | GZMK,ZBTB21,EOMES, etc. | 7.21e-02 | |
| ∗The dot plots of a searched regulon are shown for all cell subpopulations in each disease state of each tissue based on the regulon specific score inferred using pySCENIC and by calculating the average expression. |
| Page: 1 2 3 4 5 6 |
Top |
Somatic mutation of malignant transformation related genes |
| Annotation of somatic variants for genes involved in malignant transformation |
| Hugo Symbol | Variant Class | Variant Classification | dbSNP RS | HGVSc | HGVSp | HGVSp Short | SWISSPROT | BIOTYPE | SIFT | PolyPhen | Tumor Sample Barcode | Tissue | Histology | Sex | Age | Stage | Therapy Types | Drugs | Outcome |
| NFATC2 | SNV | Missense_Mutation | c.1279N>A | p.Glu427Lys | p.E427K | Q13469 | protein_coding | deleterious(0) | probably_damaging(0.999) | TCGA-A2-A0YK-01 | Breast | breast invasive carcinoma | Female | <65 | I/II | Chemotherapy | cytoxan | SD | |
| NFATC2 | SNV | Missense_Mutation | c.1505N>A | p.Pro502His | p.P502H | Q13469 | protein_coding | deleterious(0) | probably_damaging(1) | TCGA-A8-A07L-01 | Breast | breast invasive carcinoma | Female | <65 | III/IV | Chemotherapy | CR | ||
| NFATC2 | SNV | Missense_Mutation | rs748148486 | c.1433N>A | p.Arg478Gln | p.R478Q | Q13469 | protein_coding | deleterious(0) | probably_damaging(0.998) | TCGA-A8-A08G-01 | Breast | breast invasive carcinoma | Female | <65 | I/II | Chemotherapy | 5-fluorouracil | CR |
| NFATC2 | SNV | Missense_Mutation | rs774385491 | c.827N>T | p.Ser276Leu | p.S276L | Q13469 | protein_coding | deleterious(0.01) | probably_damaging(0.986) | TCGA-AN-A046-01 | Breast | breast invasive carcinoma | Female | >=65 | I/II | Unknown | Unknown | SD |
| NFATC2 | SNV | Missense_Mutation | novel | c.349N>G | p.Pro117Ala | p.P117A | Q13469 | protein_coding | tolerated(0.11) | benign(0.266) | TCGA-BH-A0B6-01 | Breast | breast invasive carcinoma | Female | <65 | I/II | Unknown | Unknown | SD |
| NFATC2 | SNV | Missense_Mutation | c.1992N>C | p.Lys664Asn | p.K664N | Q13469 | protein_coding | deleterious(0) | probably_damaging(0.999) | TCGA-C8-A26W-01 | Breast | breast invasive carcinoma | Female | <65 | I/II | Chemotherapy | doxorubicin | CR | |
| NFATC2 | insertion | Nonsense_Mutation | novel | c.1033_1034insAAAAAATAAAAATAAAAATTGAGTACCTAAATAGATAAAGGTAGAGC | p.Ile345LysfsTer13 | p.I345Kfs*13 | Q13469 | protein_coding | TCGA-B6-A0IA-01 | Breast | breast invasive carcinoma | Female | <65 | I/II | Unknown | Unknown | SD | ||
| NFATC2 | insertion | In_Frame_Ins | novel | c.918_919insTTGTTCACCCCCATACCAGATGAAAATGGACAG | p.Leu307_Asn308insPheThrProIleProAspGluAsnGlyGlnLeu | p.L307_N308insFTPIPDENGQL | Q13469 | protein_coding | TCGA-BH-A0HF-01 | Breast | breast invasive carcinoma | Female | >=65 | I/II | Hormone Therapy | arimidex | SD | ||
| NFATC2 | deletion | Frame_Shift_Del | novel | c.898delN | p.Ser300LeufsTer3 | p.S300Lfs*3 | Q13469 | protein_coding | TCGA-D8-A27V-01 | Breast | breast invasive carcinoma | Female | <65 | I/II | Hormone Therapy | tamoxiphen | SD | ||
| NFATC2 | SNV | Missense_Mutation | rs777046802 | c.2048N>T | p.Thr683Met | p.T683M | Q13469 | protein_coding | deleterious(0) | probably_damaging(0.971) | TCGA-2W-A8YY-01 | Cervix | cervical & endocervical cancer | Female | <65 | I/II | Chemotherapy | cisplatin | CR |
| Page: 1 2 3 4 5 6 7 8 9 10 11 12 13 14 15 16 17 |
Top |
Related drugs of malignant transformation related genes |
| Identification of chemicals and drugs interact with genes involved in malignant transfromation |
| (DGIdb 4.0) |
| Entrez ID | Symbol | Category | Interaction Types | Drug Claim Name | Drug Name | PMIDs |
| 4773 | NFATC2 | TRANSCRIPTION FACTOR BINDING, TRANSCRIPTION FACTOR COMPLEX, DRUGGABLE GENOME | asparaginase | ASPARAGINASE | 25987655 |
| Page: 1 |

Copyright 2023-Present -The University of Texas Health Science Center at Houston |