| GO ID | Tissue | Disease Stage | Description | Gene Ratio | Bg Ratio | pvalue | p.adjust | Count |
| GO:001605517 | Esophagus | ESCC | Wnt signaling pathway | 268/8552 | 444/18723 | 2.32e-10 | 6.58e-09 | 268 |
| GO:019873817 | Esophagus | ESCC | cell-cell signaling by wnt | 269/8552 | 446/18723 | 2.41e-10 | 6.79e-09 | 269 |
| GO:003011117 | Esophagus | ESCC | regulation of Wnt signaling pathway | 194/8552 | 328/18723 | 5.39e-07 | 7.14e-06 | 194 |
| GO:00301788 | Esophagus | ESCC | negative regulation of Wnt signaling pathway | 97/8552 | 170/18723 | 1.81e-03 | 8.31e-03 | 97 |
| GO:00031793 | Esophagus | ESCC | heart valve morphogenesis | 34/8552 | 55/18723 | 1.16e-02 | 3.90e-02 | 34 |
| GO:00031703 | Esophagus | ESCC | heart valve development | 39/8552 | 65/18723 | 1.41e-02 | 4.59e-02 | 39 |
| GO:001605510 | Oral cavity | OSCC | Wnt signaling pathway | 227/7305 | 444/18723 | 1.10e-07 | 1.87e-06 | 227 |
| GO:019873810 | Oral cavity | OSCC | cell-cell signaling by wnt | 227/7305 | 446/18723 | 1.75e-07 | 2.86e-06 | 227 |
| GO:003011110 | Oral cavity | OSCC | regulation of Wnt signaling pathway | 165/7305 | 328/18723 | 1.87e-05 | 1.80e-04 | 165 |
| GO:00331733 | Oral cavity | OSCC | calcineurin-NFAT signaling cascade | 26/7305 | 43/18723 | 3.55e-03 | 1.49e-02 | 26 |
| GO:00426927 | Oral cavity | OSCC | muscle cell differentiation | 175/7305 | 384/18723 | 4.79e-03 | 1.92e-02 | 175 |
| GO:00480164 | Oral cavity | OSCC | inositol phosphate-mediated signaling | 30/7305 | 55/18723 | 1.39e-02 | 4.59e-02 | 30 |
| GO:001605515 | Oral cavity | LP | Wnt signaling pathway | 140/4623 | 444/18723 | 5.80e-04 | 5.35e-03 | 140 |
| GO:019873815 | Oral cavity | LP | cell-cell signaling by wnt | 140/4623 | 446/18723 | 7.12e-04 | 6.38e-03 | 140 |
| GO:003011115 | Oral cavity | LP | regulation of Wnt signaling pathway | 103/4623 | 328/18723 | 3.29e-03 | 2.21e-02 | 103 |
| GO:001605523 | Oral cavity | EOLP | Wnt signaling pathway | 89/2218 | 444/18723 | 3.66e-07 | 1.06e-05 | 89 |
| GO:019873823 | Oral cavity | EOLP | cell-cell signaling by wnt | 89/2218 | 446/18723 | 4.49e-07 | 1.25e-05 | 89 |
| GO:004269214 | Oral cavity | EOLP | muscle cell differentiation | 77/2218 | 384/18723 | 2.18e-06 | 4.91e-05 | 77 |
| GO:003011123 | Oral cavity | EOLP | regulation of Wnt signaling pathway | 67/2218 | 328/18723 | 5.11e-06 | 1.04e-04 | 67 |
| GO:00031702 | Oral cavity | EOLP | heart valve development | 18/2218 | 65/18723 | 4.03e-04 | 3.58e-03 | 18 |
| Pathway ID | Tissue | Disease Stage | Description | Gene Ratio | Bg Ratio | pvalue | p.adjust | qvalue | Count |
| hsa05166211 | Esophagus | ESCC | Human T-cell leukemia virus 1 infection | 164/4205 | 222/8465 | 8.13e-14 | 2.09e-12 | 1.07e-12 | 164 |
| hsa0421829 | Esophagus | ESCC | Cellular senescence | 119/4205 | 156/8465 | 5.89e-12 | 9.40e-11 | 4.81e-11 | 119 |
| hsa05170210 | Esophagus | ESCC | Human immunodeficiency virus 1 infection | 147/4205 | 212/8465 | 3.37e-09 | 3.53e-08 | 1.81e-08 | 147 |
| hsa05167211 | Esophagus | ESCC | Kaposi sarcoma-associated herpesvirus infection | 136/4205 | 194/8465 | 4.28e-09 | 4.22e-08 | 2.16e-08 | 136 |
| hsa0513526 | Esophagus | ESCC | Yersinia infection | 100/4205 | 137/8465 | 1.80e-08 | 1.59e-07 | 8.12e-08 | 100 |
| hsa05417211 | Esophagus | ESCC | Lipid and atherosclerosis | 143/4205 | 215/8465 | 3.30e-07 | 2.45e-06 | 1.26e-06 | 143 |
| hsa05163210 | Esophagus | ESCC | Human cytomegalovirus infection | 148/4205 | 225/8465 | 5.73e-07 | 4.00e-06 | 2.05e-06 | 148 |
| hsa0493310 | Esophagus | ESCC | AGE-RAGE signaling pathway in diabetic complications | 72/4205 | 100/8465 | 4.15e-06 | 2.28e-05 | 1.17e-05 | 72 |
| hsa051619 | Esophagus | ESCC | Hepatitis B | 108/4205 | 162/8465 | 7.68e-06 | 4.15e-05 | 2.12e-05 | 108 |
| hsa046259 | Esophagus | ESCC | C-type lectin receptor signaling pathway | 73/4205 | 104/8465 | 1.57e-05 | 7.98e-05 | 4.09e-05 | 73 |
| hsa046599 | Esophagus | ESCC | Th17 cell differentiation | 68/4205 | 108/8465 | 3.53e-03 | 9.30e-03 | 4.76e-03 | 68 |
| hsa046585 | Esophagus | ESCC | Th1 and Th2 cell differentiation | 58/4205 | 92/8465 | 6.49e-03 | 1.60e-02 | 8.19e-03 | 58 |
| hsa046607 | Esophagus | ESCC | T cell receptor signaling pathway | 63/4205 | 104/8465 | 1.60e-02 | 3.60e-02 | 1.84e-02 | 63 |
| hsa05166310 | Esophagus | ESCC | Human T-cell leukemia virus 1 infection | 164/4205 | 222/8465 | 8.13e-14 | 2.09e-12 | 1.07e-12 | 164 |
| hsa0421838 | Esophagus | ESCC | Cellular senescence | 119/4205 | 156/8465 | 5.89e-12 | 9.40e-11 | 4.81e-11 | 119 |
| hsa0517038 | Esophagus | ESCC | Human immunodeficiency virus 1 infection | 147/4205 | 212/8465 | 3.37e-09 | 3.53e-08 | 1.81e-08 | 147 |
| hsa0516738 | Esophagus | ESCC | Kaposi sarcoma-associated herpesvirus infection | 136/4205 | 194/8465 | 4.28e-09 | 4.22e-08 | 2.16e-08 | 136 |
| hsa05135111 | Esophagus | ESCC | Yersinia infection | 100/4205 | 137/8465 | 1.80e-08 | 1.59e-07 | 8.12e-08 | 100 |
| hsa05417310 | Esophagus | ESCC | Lipid and atherosclerosis | 143/4205 | 215/8465 | 3.30e-07 | 2.45e-06 | 1.26e-06 | 143 |
| hsa0516338 | Esophagus | ESCC | Human cytomegalovirus infection | 148/4205 | 225/8465 | 5.73e-07 | 4.00e-06 | 2.05e-06 | 148 |
| TF | Cell Type | Tissue | Disease Stage | Target Gene | RSS | Regulon Activity |
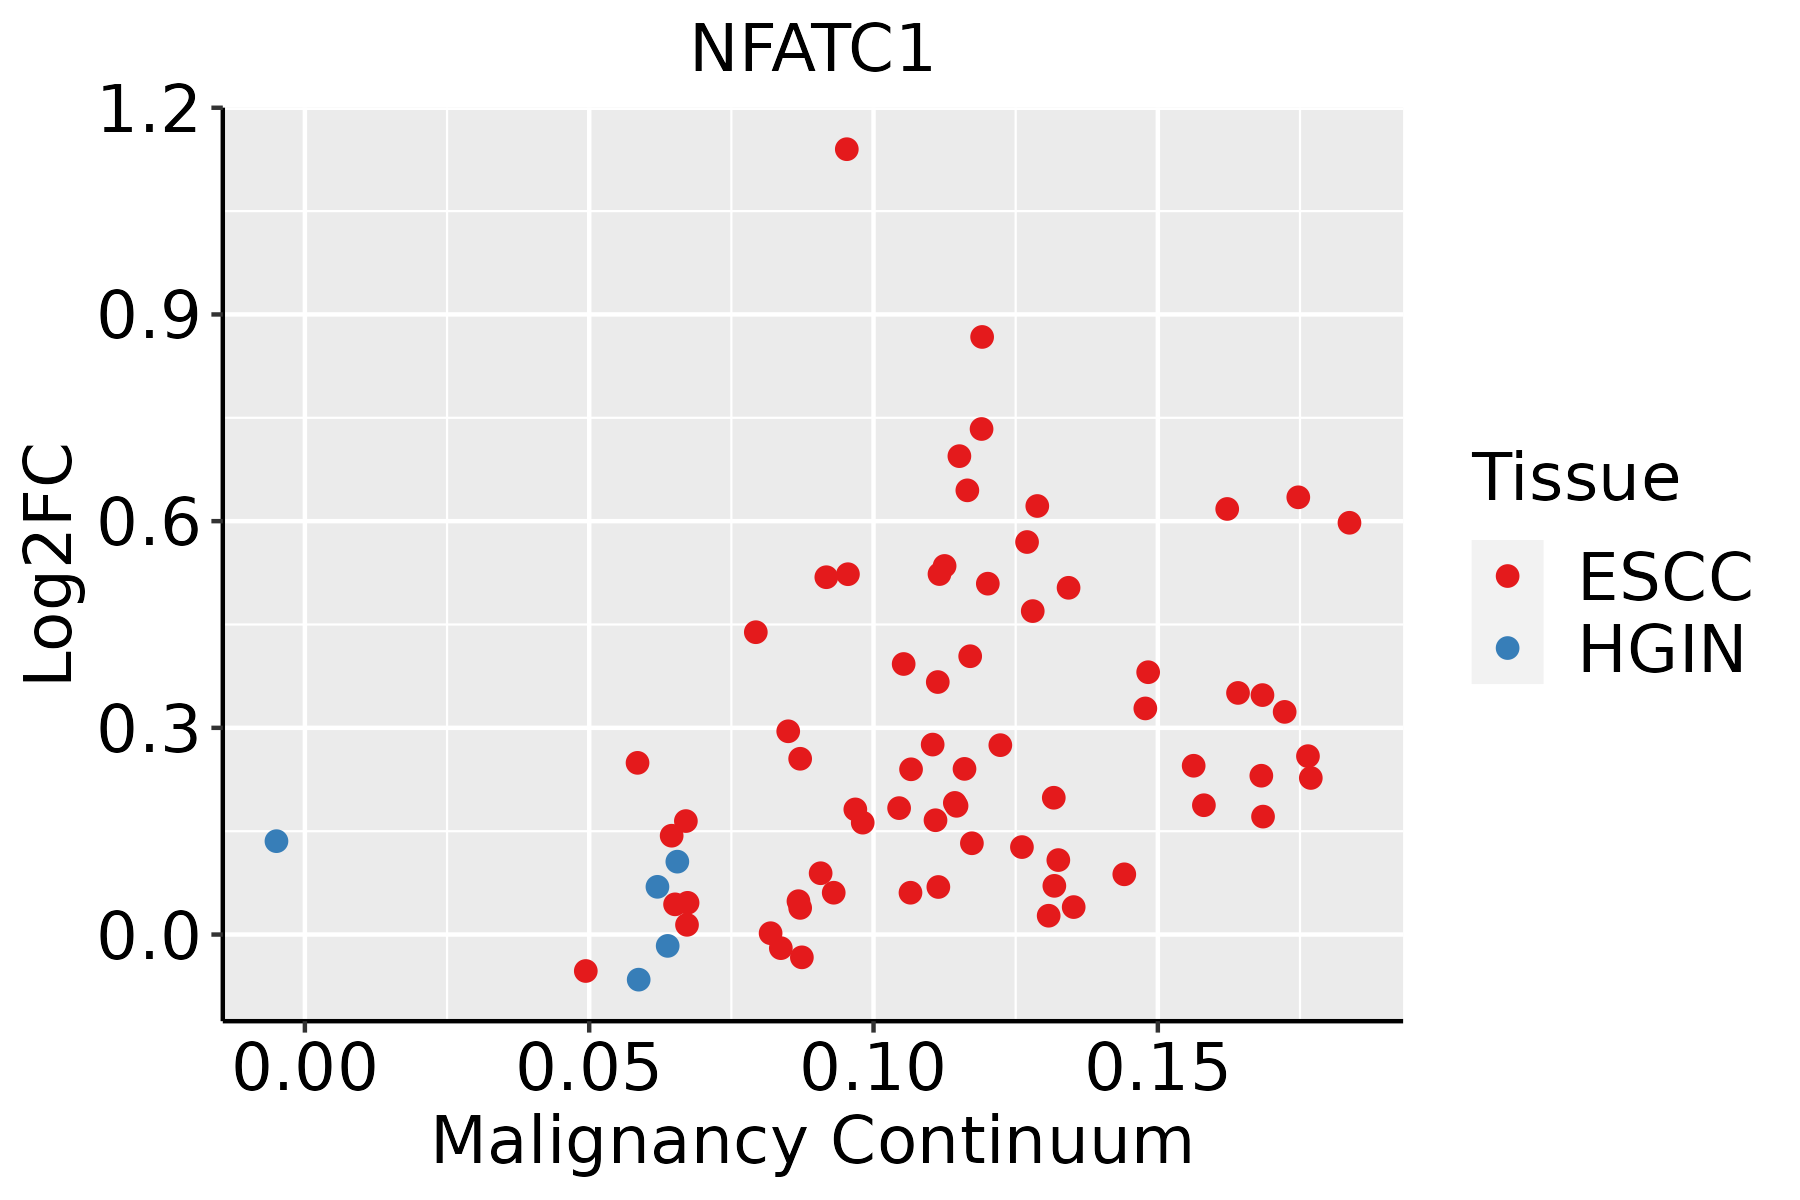
| NFATC1 | QUIE | Esophagus | LGIN | TRAF4,TGIF1,KDM6B, etc. | 4.40e-01 |  |
| NFATC1 | NEUT | Pancreas | Healthy | AC018445.5,AL163541.1,TTBK2, etc. | 1.03e-01 |  |
| NFATC1 | NEUT | Pancreas | PanIN | AC018445.5,AL163541.1,TTBK2, etc. | 9.20e-02 |  |
| NFATC1 | MALTB | Pancreas | PDAC | AC018445.5,AL163541.1,TTBK2, etc. | 1.67e-01 |  |
| NFATC1 | BAS | Prostate | Healthy | LMNA,IL32,TWIST2, etc. | 3.25e-01 |  |
| NFATC1 | M1MAC | Stomach | CAG | AC018445.5,ALDH1A1,CD40LG, etc. | 1.88e-01 |  |
| NFATC1 | M1MAC | Stomach | Healthy | AC018445.5,ALDH1A1,CD40LG, etc. | 7.09e-02 |  |
| NFATC1 | M1MAC | Stomach | SIM | AC018445.5,ALDH1A1,CD40LG, etc. | 2.39e-01 |  |
| Hugo Symbol | Variant Class | Variant Classification | dbSNP RS | HGVSc | HGVSp | HGVSp Short | SWISSPROT | BIOTYPE | SIFT | PolyPhen | Tumor Sample Barcode | Tissue | Histology | Sex | Age | Stage | Therapy Types | Drugs | Outcome |
| NFATC1 | SNV | Missense_Mutation | novel | c.1337G>A | p.Gly446Asp | p.G446D | O95644 | protein_coding | deleterious(0) | probably_damaging(1) | TCGA-AR-A2LE-01 | Breast | breast invasive carcinoma | Female | >=65 | I/II | Hormone Therapy | tamoxiphen | PD |
| NFATC1 | SNV | Missense_Mutation | rs774191442 | c.1696G>A | p.Val566Ile | p.V566I | O95644 | protein_coding | deleterious(0.02) | probably_damaging(0.942) | TCGA-E2-A2P5-01 | Breast | breast invasive carcinoma | Female | >=65 | III/IV | Hormone Therapy | arimidex | PD |
| NFATC1 | SNV | Missense_Mutation | rs752605795 | c.461C>T | p.Thr154Met | p.T154M | O95644 | protein_coding | tolerated(0.15) | probably_damaging(0.971) | TCGA-OL-A66J-01 | Breast | breast invasive carcinoma | Female | >=65 | I/II | Unknown | Unknown | SD |
| NFATC1 | SNV | Missense_Mutation | novel | c.2001N>C | p.Arg667Ser | p.R667S | O95644 | protein_coding | tolerated(0.27) | possibly_damaging(0.843) | TCGA-PE-A5DE-01 | Breast | breast invasive carcinoma | Female | <65 | I/II | Chemotherapy | taxotere | CR |
| NFATC1 | SNV | Missense_Mutation | rs372492742 | c.260N>T | p.Ser87Leu | p.S87L | O95644 | protein_coding | tolerated(0.34) | benign(0.001) | TCGA-C5-A1BQ-01 | Cervix | cervical & endocervical cancer | Female | >=65 | III/IV | Chemotherapy | cisplatin | CR |
| NFATC1 | SNV | Missense_Mutation | novel | c.1508N>T | p.Ser503Phe | p.S503F | O95644 | protein_coding | deleterious(0) | probably_damaging(0.973) | TCGA-C5-A2LZ-01 | Cervix | cervical & endocervical cancer | Female | >=65 | III/IV | Unknown | Unknown | PD |
| NFATC1 | SNV | Missense_Mutation | rs372492742 | c.260C>T | p.Ser87Leu | p.S87L | O95644 | protein_coding | tolerated(0.34) | benign(0.001) | TCGA-C5-A3HL-01 | Cervix | cervical & endocervical cancer | Female | >=65 | I/II | Unknown | Unknown | SD |
| NFATC1 | SNV | Missense_Mutation | rs780214363 | c.154N>A | p.Val52Ile | p.V52I | O95644 | protein_coding | tolerated(0.38) | benign(0.003) | TCGA-EA-A3HU-01 | Cervix | cervical & endocervical cancer | Female | <65 | I/II | Unknown | Unknown | SD |
| NFATC1 | SNV | Missense_Mutation | | c.487N>A | p.Glu163Lys | p.E163K | O95644 | protein_coding | deleterious(0.01) | possibly_damaging(0.601) | TCGA-IR-A3LA-01 | Cervix | cervical & endocervical cancer | Female | <65 | I/II | Chemotherapy | cisplatin | CR |
| NFATC1 | SNV | Missense_Mutation | novel | c.2342C>T | p.Ala781Val | p.A781V | O95644 | protein_coding | tolerated(0.13) | benign(0.053) | TCGA-VS-A9UJ-01 | Cervix | cervical & endocervical cancer | Female | <65 | I/II | Unknown | Unknown | PD |