Schematic overview of the cellular and molecular mechanisms involved in the cancer progression, including the proposed cellular and molecular mechanisms in cancer cells trajectory. AT1: alveolar type 1 cells; AT2: alveolar type 2 cells; AAH: atypical adenomatous hyperplasia; AIS: adenocarcinoma in situ; MIA: minimally invasive adenocarcinoma; IA: invasive adenocarcinoma; EMT: epithelial-mesenchymal transition

Home

Download

Statistics

Help

Contact

Center for Computational Systems Medicine
leaf

Gene summary

leaf

Malignant transformation analysis

leaf

Malignant transformation related pathway analysis

leaf

Cell-cell communication analysis

leaf

Single-cell gene regulatory network inference analysis

leaf

Somatic mutation of malignant transformation related genes

leaf

Related drugs of malignant transformation related genes

Gene: NFAT5

Gene summary for NFAT5

check button Gene summary.

Gene informationSpeciesHuman
Gene symbol

NFAT5

Gene ID

10725

Gene namenuclear factor of activated T cells 5
Gene AliasNF-AT5
Cytomap16q22.1
Gene Typeprotein-coding
GO ID

GO:0001816

UniProtAcc

O94916


Top

Malignant transformation analysis

check button Identification of the aberrant gene expression in precancerous and cancerous lesions by comparing the gene expression of stem-like cells in diseased tissues with normal stem cells
check button Malignant transformation involving gene list.
Entrez IDSymbolReplicatesSpeciesOrganTissueAdj P-valueLog2FCMalignancy
10725NFAT5CA_HPV_1HumanCervixCC5.90e-03-5.80e-030.0264
10725NFAT5CCI_1HumanCervixCC3.15e-059.17e-010.528
10725NFAT5CCI_2HumanCervixCC1.05e-081.40e+000.5249
10725NFAT5CCI_3HumanCervixCC4.64e-141.47e+000.516
10725NFAT5L1HumanCervixCC5.82e-04-3.11e-010.0802
10725NFAT5HTA11_1938_2000001011HumanColorectumAD7.33e-045.34e-01-0.0811
10725NFAT5HTA11_347_2000001011HumanColorectumAD6.61e-146.73e-01-0.1954
10725NFAT5HTA11_1391_2000001011HumanColorectumAD9.27e-057.34e-01-0.059
10725NFAT5HTA11_99999965062_69753HumanColorectumMSI-H1.36e-171.27e+000.3487
10725NFAT5HTA11_99999965104_69814HumanColorectumMSS8.09e-191.18e+000.281
10725NFAT5HTA11_99999971662_82457HumanColorectumMSS3.71e-081.00e+000.3859
10725NFAT5HTA11_99999974143_84620HumanColorectumMSS4.67e-118.55e-010.3005
10725NFAT5F007HumanColorectumFAP4.66e-03-2.79e-020.1176
10725NFAT5A002-C-010HumanColorectumFAP8.06e-03-3.46e-020.242
10725NFAT5A001-C-207HumanColorectumFAP1.39e-04-2.43e-010.1278
10725NFAT5A015-C-203HumanColorectumFAP3.07e-39-4.42e-01-0.1294
10725NFAT5A015-C-204HumanColorectumFAP6.85e-09-3.43e-01-0.0228
10725NFAT5A014-C-040HumanColorectumFAP6.92e-07-3.71e-01-0.1184
10725NFAT5A002-C-201HumanColorectumFAP2.62e-12-2.70e-010.0324
10725NFAT5A002-C-203HumanColorectumFAP3.78e-03-1.54e-010.2786
Page: 1 2 3 4 5 6 7 8 9 10 11 12 

check button Transcriptomic changes along malignancy continuum.
TissueExpression DynamicsAbbreviation
CervixThe image shows the transcriptomic changes along malignancy continuum.log2FC in expression of this searched gene in stem-like cells from each diseased tissue sample relative to stem-like cells in normal samples in each tissue plotted against the malignancy continuum. Samples are colored based on if they are from different disease stage.CC: Cervix cancer
HSIL_HPV: HPV-infected high-grade squamous intraepithelial lesions
N_HPV: HPV-infected normal cervix
Colorectum (GSE201348)The image shows the transcriptomic changes along malignancy continuum.log2FC in expression of this searched gene in stem-like cells from each diseased tissue sample relative to stem-like cells in normal samples in each tissue plotted against the malignancy continuum. Samples are colored based on if they are from different disease stage.FAP: Familial adenomatous polyposis
CRC: Colorectal cancer
Colorectum (HTA11)The image shows the transcriptomic changes along malignancy continuum.log2FC in expression of this searched gene in stem-like cells from each diseased tissue sample relative to stem-like cells in normal samples in each tissue plotted against the malignancy continuum. Samples are colored based on if they are from different disease stage.AD: Adenomas
SER: Sessile serrated lesions
MSI-H: Microsatellite-high colorectal cancer
MSS: Microsatellite stable colorectal cancer
EndometriumThe image shows the transcriptomic changes along malignancy continuum.log2FC in expression of this searched gene in stem-like cells from each diseased tissue sample relative to stem-like cells in normal samples in each tissue plotted against the malignancy continuum. Samples are colored based on if they are from different disease stage.AEH: Atypical endometrial hyperplasia
EEC: Endometrioid Cancer
EsophagusThe image shows the transcriptomic changes along malignancy continuum.log2FC in expression of this searched gene in stem-like cells from each diseased tissue sample relative to stem-like cells in normal samples in each tissue plotted against the malignancy continuum. Samples are colored based on if they are from different disease stage.
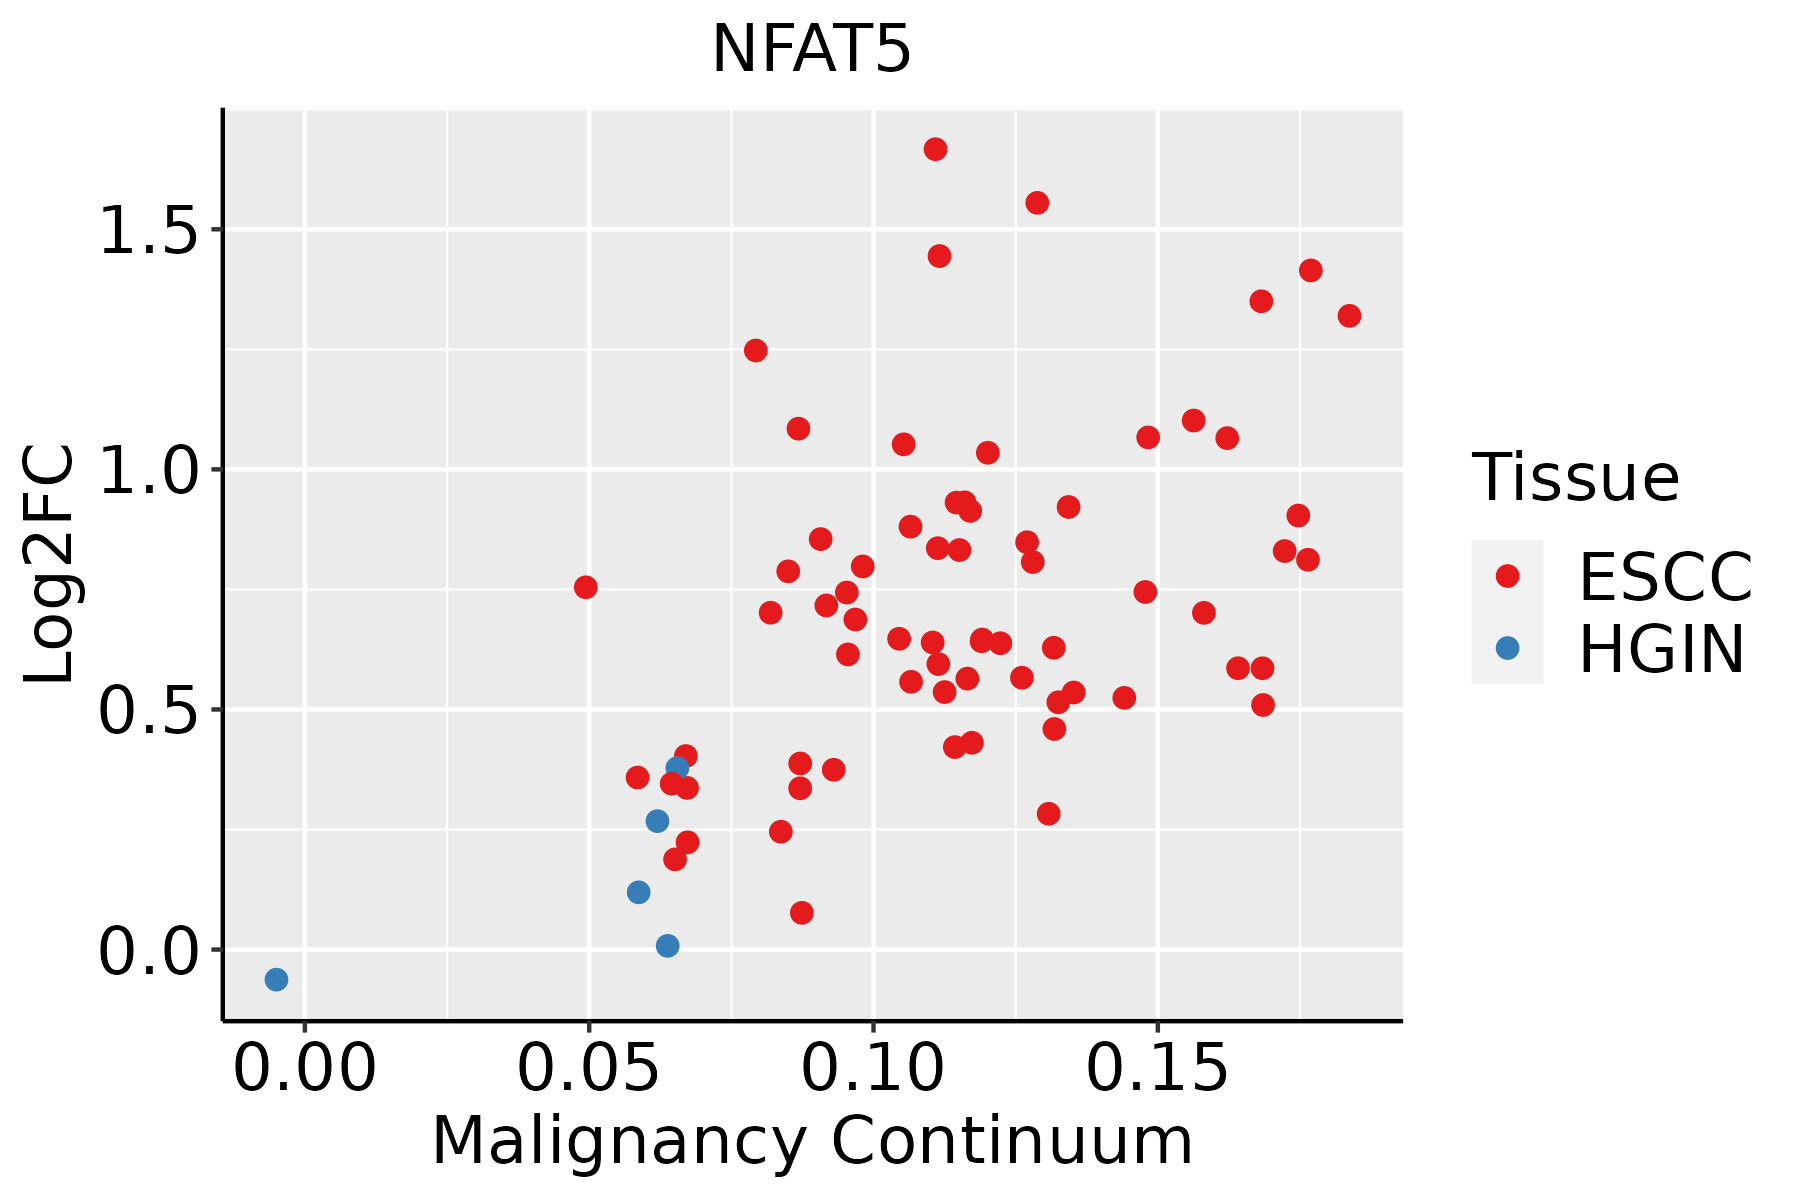
ESCC: Esophageal squamous cell carcinoma
HGIN: High-grade intraepithelial neoplasias
LGIN: Low-grade intraepithelial neoplasias
LiverThe image shows the transcriptomic changes along malignancy continuum.log2FC in expression of this searched gene in stem-like cells from each diseased tissue sample relative to stem-like cells in normal samples in each tissue plotted against the malignancy continuum. Samples are colored based on if they are from different disease stage.
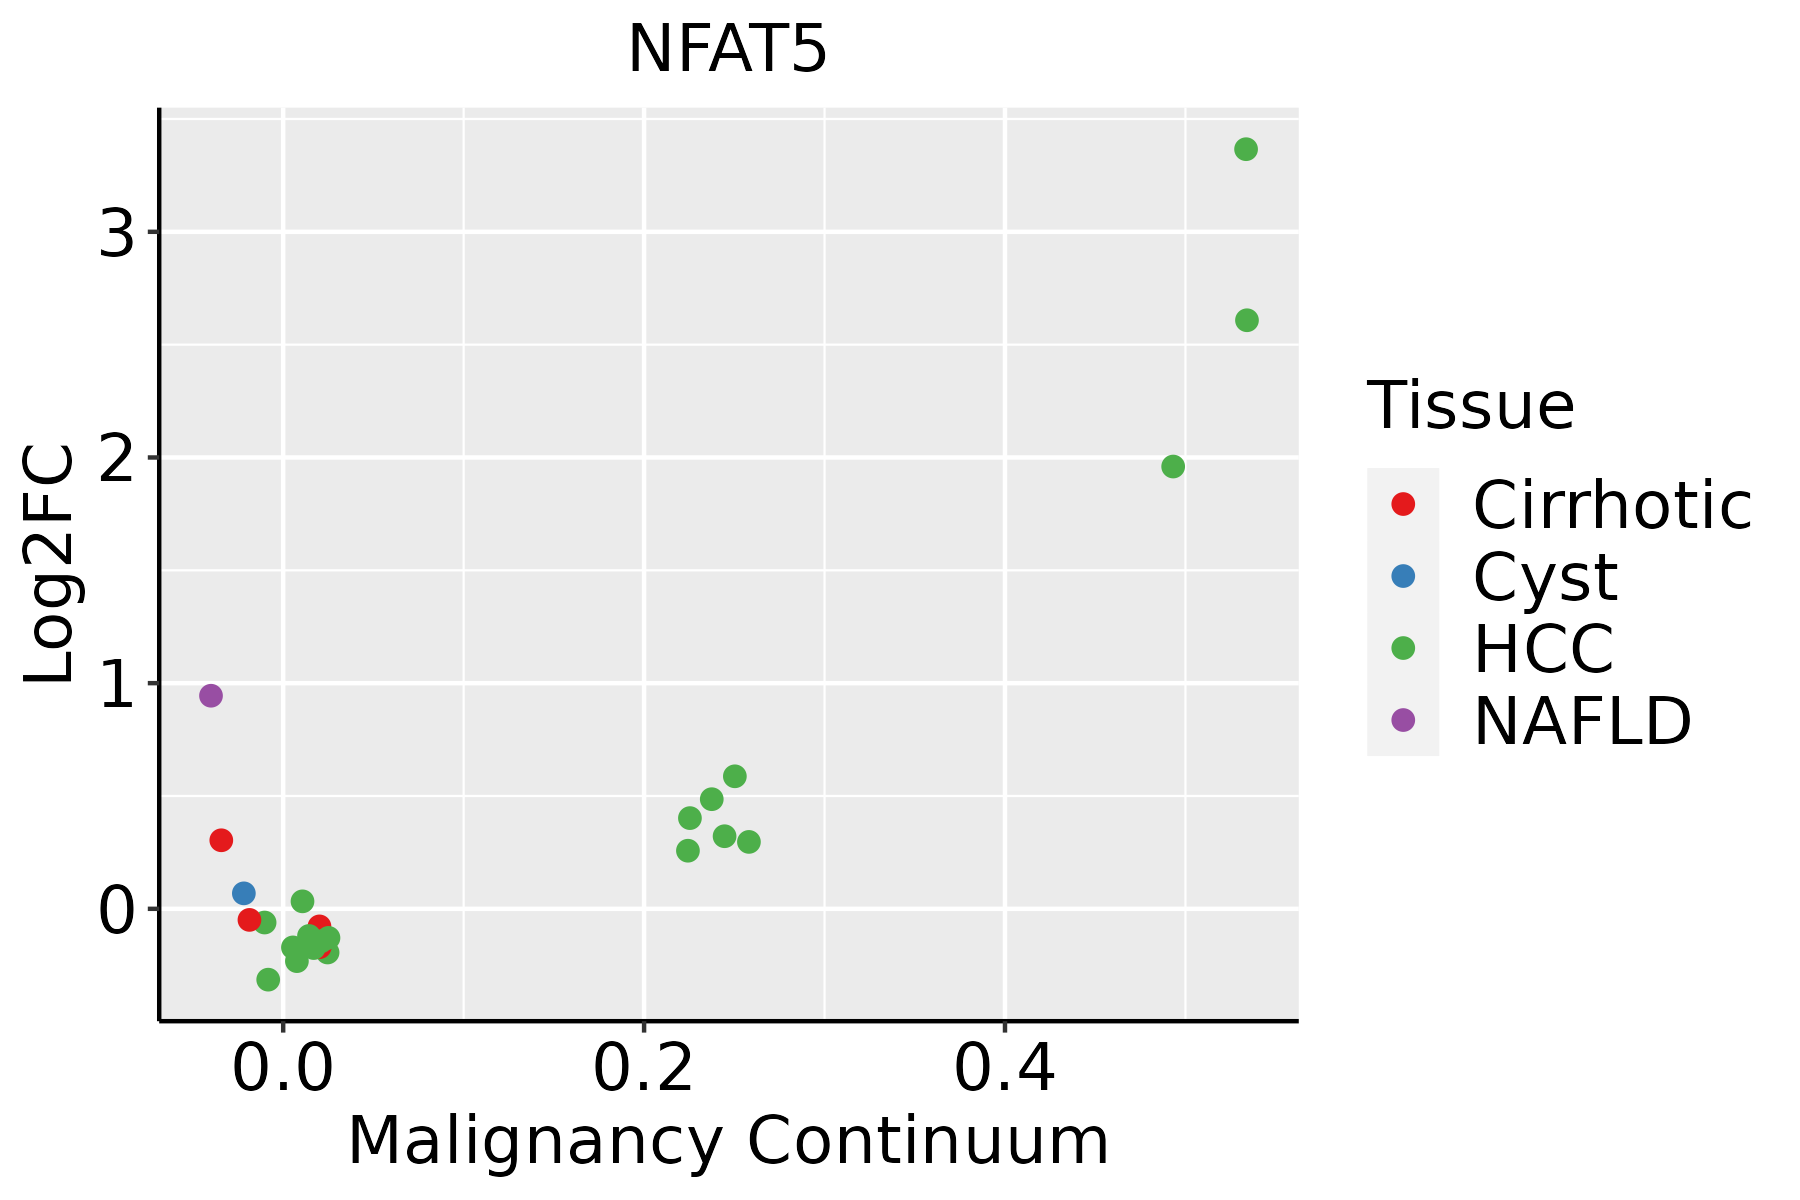
HCC: Hepatocellular carcinoma
NAFLD: Non-alcoholic fatty liver disease
LungThe image shows the transcriptomic changes along malignancy continuum.log2FC in expression of this searched gene in stem-like cells from each diseased tissue sample relative to stem-like cells in normal samples in each tissue plotted against the malignancy continuum. Samples are colored based on if they are from different disease stage.AAH: Atypical adenomatous hyperplasia
AIS: Adenocarcinoma in situ
IAC: Invasive lung adenocarcinoma
MIA: Minimally invasive adenocarcinoma
Oral CavityThe image shows the transcriptomic changes along malignancy continuum.log2FC in expression of this searched gene in stem-like cells from each diseased tissue sample relative to stem-like cells in normal samples in each tissue plotted against the malignancy continuum. Samples are colored based on if they are from different disease stage.
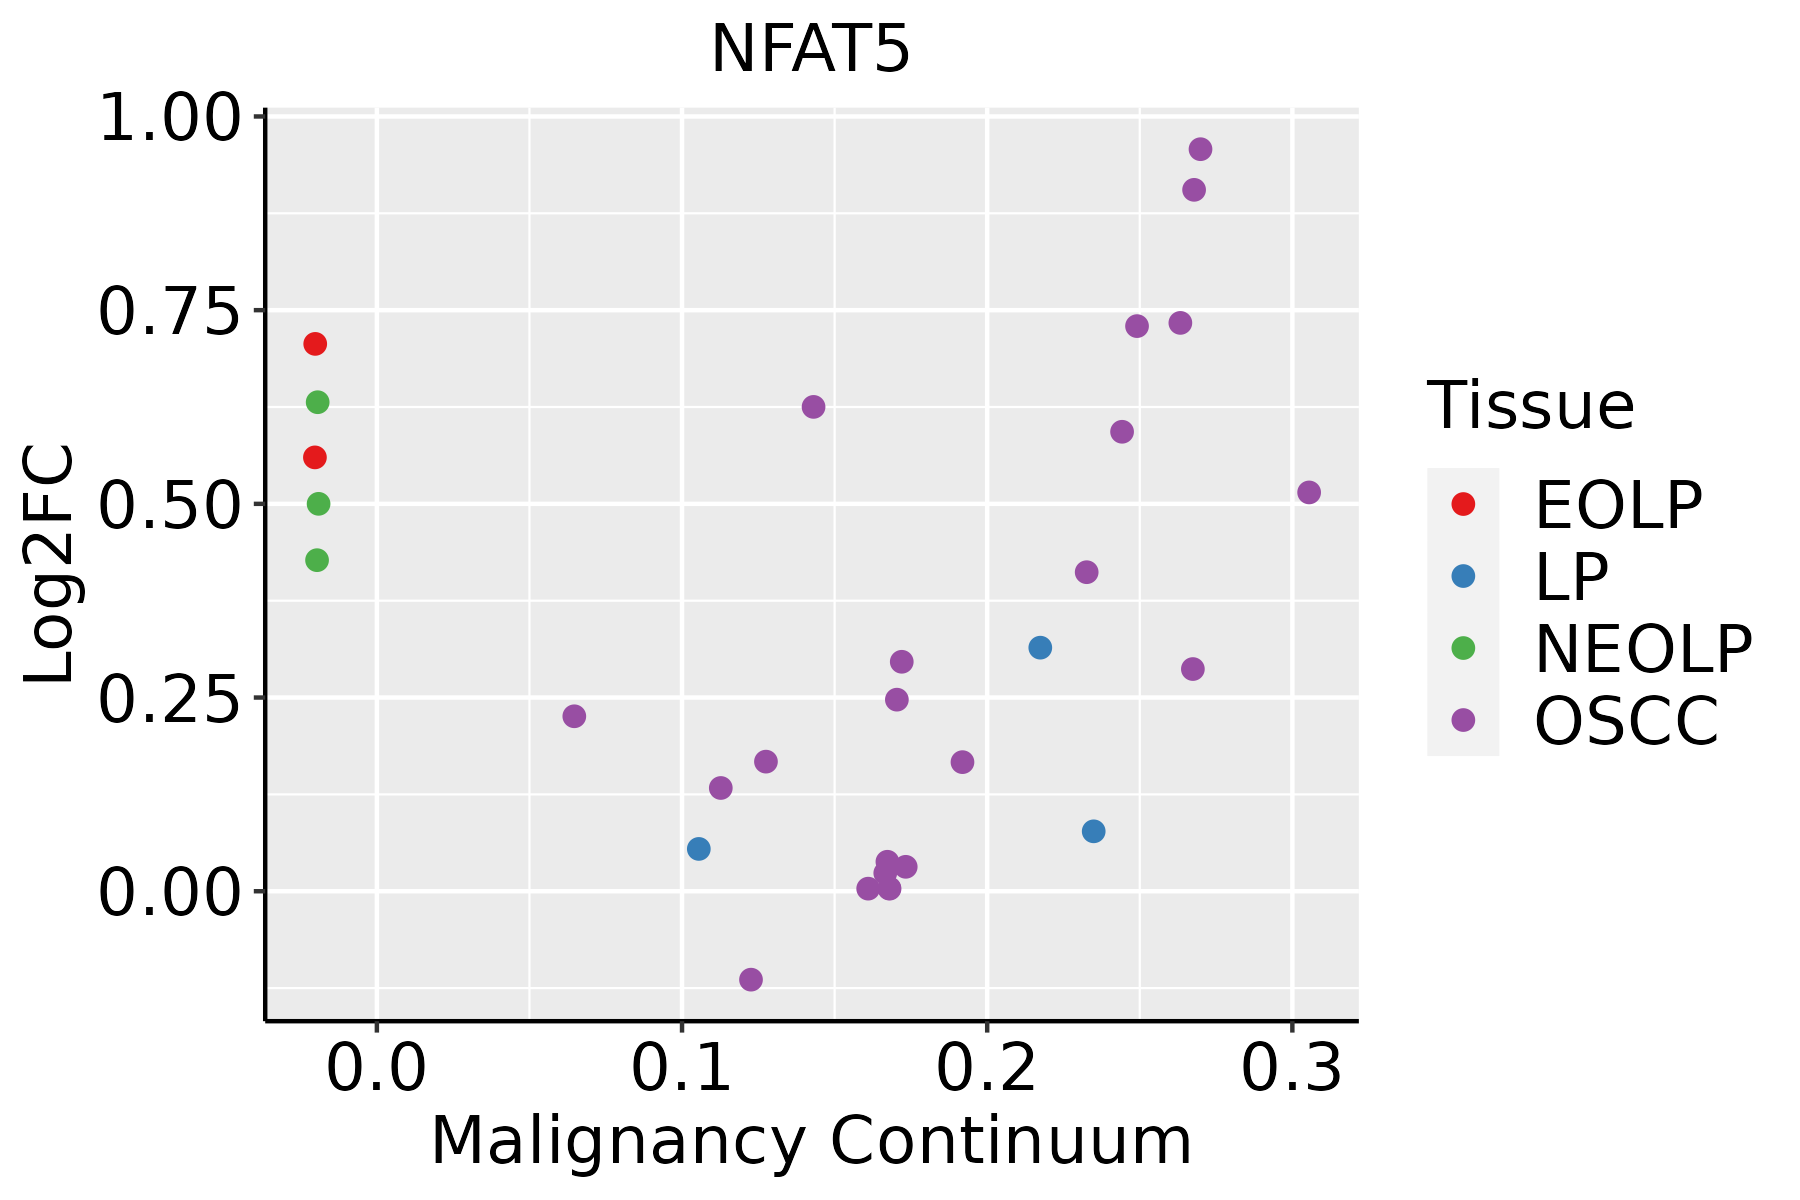
EOLP: Erosive Oral lichen planus
LP: leukoplakia
NEOLP: Non-erosive oral lichen planus
OSCC: Oral squamous cell carcinoma
ProstateThe image shows the transcriptomic changes along malignancy continuum.log2FC in expression of this searched gene in stem-like cells from each diseased tissue sample relative to stem-like cells in normal samples in each tissue plotted against the malignancy continuum. Samples are colored based on if they are from different disease stage.BPH: Benign Prostatic Hyperplasia
SkinThe image shows the transcriptomic changes along malignancy continuum.log2FC in expression of this searched gene in stem-like cells from each diseased tissue sample relative to stem-like cells in normal samples in each tissue plotted against the malignancy continuum. Samples are colored based on if they are from different disease stage.
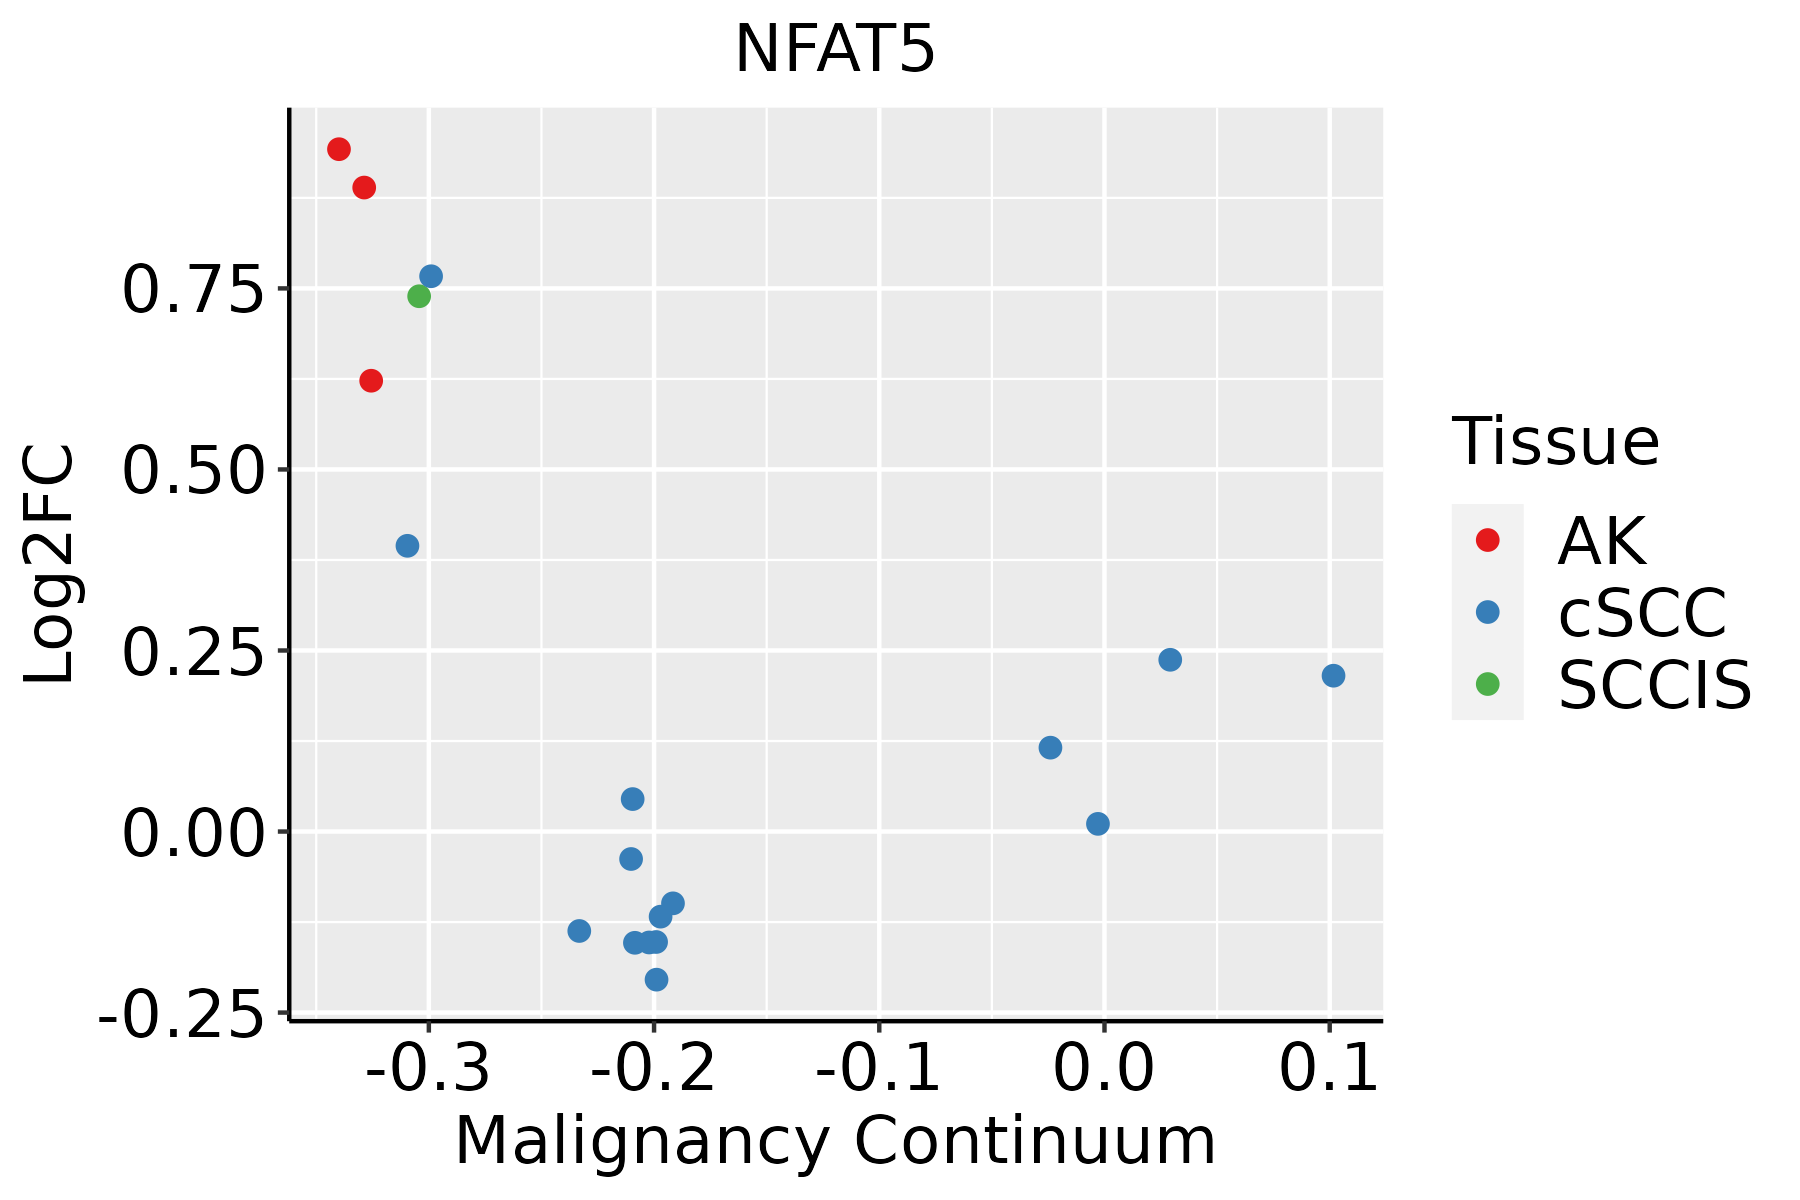
AK: Actinic keratosis
cSCC: Cutaneous squamous cell carcinoma
SCCIS:squamous cell carcinoma in situ
ThyroidThe image shows the transcriptomic changes along malignancy continuum.log2FC in expression of this searched gene in stem-like cells from each diseased tissue sample relative to stem-like cells in normal samples in each tissue plotted against the malignancy continuum. Samples are colored based on if they are from different disease stage.ATC: Anaplastic thyroid cancer
HT: Hashimoto's thyroiditis
PTC: Papillary thyroid cancer
∗log2FC in expression of this searched gene in stem-like cells from each diseased tissue sample relative to stem-like cells in normal samples in each tissue plotted against the malignancy continuum. Samples are colored based on if they are from different disease stage.

Top

Malignant transformation related pathway analysis

check buttonFind out the enriched GO biological processes and KEGG pathways involved in transition from healthy to precancer to cancer
check button Figure of enriched GO biological processes.
TissueDisease StageEnriched GO biological Processes
ColorectumADGO analysis - Figure of enriched GO biological processes: Top 15 enriched GO BP terms are showed in the bar plot of each disease state in each tissue. Each row represents a significant GO biological process which is colored according to the -log10(p.adjust).
ColorectumSERGO analysis - Figure of enriched GO biological processes: Top 15 enriched GO BP terms are showed in the bar plot of each disease state in each tissue. Each row represents a significant GO biological process which is colored according to the -log10(p.adjust).
ColorectumMSSGO analysis - Figure of enriched GO biological processes: Top 15 enriched GO BP terms are showed in the bar plot of each disease state in each tissue. Each row represents a significant GO biological process which is colored according to the -log10(p.adjust).
ColorectumMSI-HGO analysis - Figure of enriched GO biological processes: Top 15 enriched GO BP terms are showed in the bar plot of each disease state in each tissue. Each row represents a significant GO biological process which is colored according to the -log10(p.adjust).
ColorectumFAPGO analysis - Figure of enriched GO biological processes: Top 15 enriched GO BP terms are showed in the bar plot of each disease state in each tissue. Each row represents a significant GO biological process which is colored according to the -log10(p.adjust).
∗Top 15 enriched GO BP terms are showed in the bar plot of each disease state in each tissue. Each row represents a significant GO biological process which is colored according to the -log10(p.adjust).
Page: 1 2 3 4 5 6 7 8 9 

check button Enriched GO biological processes.
GO IDTissueDisease StageDescriptionGene RatioBg Ratiopvaluep.adjustCount
GO:002240710CervixCCregulation of cell-cell adhesion103/2311448/187231.78e-102.87e-08103
GO:004578510CervixCCpositive regulation of cell adhesion101/2311437/187231.96e-103.08e-08101
GO:00071598CervixCCleukocyte cell-cell adhesion85/2311371/187238.27e-097.07e-0785
GO:19030378CervixCCregulation of leukocyte cell-cell adhesion77/2311336/187234.08e-082.54e-0677
GO:00224099CervixCCpositive regulation of cell-cell adhesion61/2311284/187239.30e-062.11e-0461
GO:19030397CervixCCpositive regulation of leukocyte cell-cell adhesion53/2311239/187231.37e-052.74e-0453
GO:0045785ColorectumADpositive regulation of cell adhesion122/3918437/187232.65e-043.28e-03122
GO:00457852ColorectumMSSpositive regulation of cell adhesion110/3467437/187232.94e-043.87e-03110
GO:00457853ColorectumMSI-Hpositive regulation of cell adhesion48/1319437/187231.47e-032.23e-0248
GO:00457854ColorectumFAPpositive regulation of cell adhesion92/2622437/187233.09e-057.04e-0492
GO:00069701ColorectumFAPresponse to osmotic stress25/262284/187231.43e-042.24e-0325
GO:0048016ColorectumFAPinositol phosphate-mediated signaling16/262255/187232.78e-032.15e-0216
GO:00457855ColorectumCRCpositive regulation of cell adhesion81/2078437/187232.28e-061.10e-0481
GO:0097720ColorectumCRCcalcineurin-mediated signaling13/207848/187231.72e-031.77e-0213
GO:0033173ColorectumCRCcalcineurin-NFAT signaling cascade12/207843/187231.93e-031.96e-0212
GO:00480161ColorectumCRCinositol phosphate-mediated signaling14/207855/187232.21e-032.15e-0214
GO:0070884ColorectumCRCregulation of calcineurin-NFAT signaling cascade10/207834/187232.96e-032.66e-0210
GO:0106056ColorectumCRCregulation of calcineurin-mediated signaling10/207835/187233.74e-033.14e-0210
GO:0022407ColorectumCRCregulation of cell-cell adhesion67/2078448/187236.86e-034.81e-0267
GO:004578516EndometriumAEHpositive regulation of cell adhesion96/2100437/187235.50e-117.18e-0996
Page: 1 2 3 4 5 6 7 8 9 

check button Enriched KEGG pathways.
Pathway IDTissueDisease StageDescriptionGene RatioBg Ratiopvaluep.adjustqvalueCount
Page: 1 

Top

Cell-cell communication analysis

check buttonIdentification of potential cell-cell interactions between two cell types and their ligand-receptor pairs for different disease states
LigandReceptorLRpairPathwayTissueDisease Stage
Page: 1 

Top

Single-cell gene regulatory network inference analysis

check buttonFind out the significant the regulons (TFs) and the target genes of each regulon across cell types for different disease states
TFCell TypeTissueDisease StageTarget GeneRSSRegulon Activity
NFAT5KEREsophagusHGINMALAT1,PARD6B,NEAT1, etc.2.81e-01The dot plots of a searched regulon are shown for all cell subpopulations in each disease state of each tissue based on the regulon specific score inferred using pySCENIC and by calculating the average expression.
NFAT5INMONLungAAHSAMSN1,SRGN,JARID2, etc.1.02e-01The dot plots of a searched regulon are shown for all cell subpopulations in each disease state of each tissue based on the regulon specific score inferred using pySCENIC and by calculating the average expression.
∗The dot plots of a searched regulon are shown for all cell subpopulations in each disease state of each tissue based on the regulon specific score inferred using pySCENIC and by calculating the average expression.
Page: 1 

Top

Somatic mutation of malignant transformation related genes

check buttonAnnotation of somatic variants for genes involved in malignant transformation
Hugo SymbolVariant ClassVariant ClassificationdbSNP RSHGVScHGVSpHGVSp ShortSWISSPROTBIOTYPESIFTPolyPhenTumor Sample BarcodeTissueHistologySexAgeStageTherapy TypesDrugsOutcome
NFAT5SNVMissense_Mutationc.2602G>Cp.Glu868Glnp.E868QO94916protein_codingdeleterious_low_confidence(0)benign(0.309)TCGA-A2-A0YK-01Breastbreast invasive carcinomaFemale<65I/IIChemotherapycytoxanSD
NFAT5SNVMissense_Mutationrs201563281c.4295N>Tp.Ser1432Leup.S1432LO94916protein_codingdeleterious(0.01)benign(0.028)TCGA-BH-A0HF-01Breastbreast invasive carcinomaFemale>=65I/IIHormone TherapyarimidexSD
NFAT5SNVMissense_Mutationc.2134N>Tp.Ala712Serp.A712SO94916protein_codingtolerated(0.62)benign(0.012)TCGA-BH-A1F6-01Breastbreast invasive carcinomaFemale<65III/IVUnknownUnknownSD
NFAT5SNVMissense_Mutationnovelc.1514N>Gp.Ser505Cysp.S505CO94916protein_codingdeleterious(0.04)probably_damaging(0.993)TCGA-D8-A1J8-01Breastbreast invasive carcinomaFemale>=65I/IIHormone TherapynolvadexSD
NFAT5SNVMissense_Mutationc.1693G>Tp.Ala565Serp.A565SO94916protein_codingtolerated(0.69)benign(0.01)TCGA-E2-A10C-01Breastbreast invasive carcinomaFemale<65I/IIChemotherapycytoxanSD
NFAT5SNVMissense_Mutationc.386N>Tp.Ala129Valp.A129VO94916protein_codingtolerated(0.08)benign(0.069)TCGA-E2-A1LH-01Breastbreast invasive carcinomaFemale<65I/IIChemotherapyadriamycinSD
NFAT5SNVMissense_Mutationnovelc.826C>Gp.Gln276Glup.Q276EO94916protein_codingtolerated(0.51)benign(0.034)TCGA-E9-A3Q9-01Breastbreast invasive carcinomaFemale>=65III/IVChemotherapycyclophosphaneCR
NFAT5insertionFrame_Shift_Insnovelc.2793dupAp.Glu932ArgfsTer33p.E932Rfs*33O94916protein_codingTCGA-A8-A07B-01Breastbreast invasive carcinomaFemale>=65I/IIUnknownUnknownSD
NFAT5insertionFrame_Shift_Insnovelc.3763_3764insCACAGp.Ile1256GlnfsTer3p.I1256Qfs*3O94916protein_codingTCGA-A8-A09D-01Breastbreast invasive carcinomaFemale<65I/IIChemotherapydoxorubicinCR
NFAT5SNVMissense_Mutationnovelc.3418A>Gp.Thr1140Alap.T1140AO94916protein_codingdeleterious(0.03)benign(0)TCGA-2W-A8YY-01Cervixcervical & endocervical cancerFemale<65I/IIChemotherapycisplatinCR
Page: 1 2 3 4 5 6 7 8 9 10 11 

Top

Related drugs of malignant transformation related genes

check buttonIdentification of chemicals and drugs interact with genes involved in malignant transfromation
(DGIdb 4.0)
Entrez IDSymbolCategoryInteraction TypesDrug Claim NameDrug NamePMIDs
Page: 1