
|
|||||
|
 | |
| |
| |
| |
| |
| |
|
Gene: NEURL1 |
Gene summary for NEURL1 |
| Gene information | Species | Human | Gene symbol | NEURL1 | Gene ID | 9148 |
| Gene name | neuralized E3 ubiquitin protein ligase 1 | |
| Gene Alias | NEUR1 | |
| Cytomap | 10q24.33 | |
| Gene Type | protein-coding | GO ID | GO:0000003 | UniProtAcc | B4DS86 |
Top |
Malignant transformation analysis |
| Identification of the aberrant gene expression in precancerous and cancerous lesions by comparing the gene expression of stem-like cells in diseased tissues with normal stem cells |
| Entrez ID | Symbol | Replicates | Species | Organ | Tissue | Adj P-value | Log2FC | Malignancy |
| 9148 | NEURL1 | HTA11_78_2000001011 | Human | Colorectum | AD | 7.21e-05 | 3.12e-01 | -0.1088 |
| 9148 | NEURL1 | HTA11_696_2000001011 | Human | Colorectum | AD | 7.35e-12 | 4.84e-01 | -0.1464 |
| 9148 | NEURL1 | HTA11_866_2000001011 | Human | Colorectum | AD | 4.30e-06 | 4.64e-01 | -0.1001 |
| 9148 | NEURL1 | HTA11_99999965062_69753 | Human | Colorectum | MSI-H | 9.98e-11 | 1.22e+00 | 0.3487 |
| 9148 | NEURL1 | P21T-E | Human | Esophagus | ESCC | 3.02e-26 | 5.22e-01 | 0.1617 |
| 9148 | NEURL1 | P26T-E | Human | Esophagus | ESCC | 4.12e-11 | 2.70e-01 | 0.1276 |
| 9148 | NEURL1 | P28T-E | Human | Esophagus | ESCC | 1.76e-12 | 2.82e-01 | 0.1149 |
| 9148 | NEURL1 | P31T-E | Human | Esophagus | ESCC | 3.50e-02 | 9.37e-02 | 0.1251 |
| 9148 | NEURL1 | P49T-E | Human | Esophagus | ESCC | 4.64e-06 | 3.45e-01 | 0.1768 |
| 9148 | NEURL1 | P57T-E | Human | Esophagus | ESCC | 8.40e-04 | 1.68e-01 | 0.0926 |
| 9148 | NEURL1 | P74T-E | Human | Esophagus | ESCC | 3.81e-05 | 1.80e-01 | 0.1479 |
| 9148 | NEURL1 | P80T-E | Human | Esophagus | ESCC | 1.02e-63 | 1.69e+00 | 0.155 |
| 9148 | NEURL1 | P83T-E | Human | Esophagus | ESCC | 4.97e-05 | 1.66e-01 | 0.1738 |
| 9148 | NEURL1 | P107T-E | Human | Esophagus | ESCC | 1.48e-31 | 5.94e-01 | 0.171 |
| 9148 | NEURL1 | P130T-E | Human | Esophagus | ESCC | 4.41e-07 | 2.65e-01 | 0.1676 |
| 9148 | NEURL1 | HTA12-26-1 | Human | Pancreas | PDAC | 2.06e-05 | 5.56e-01 | 0.3728 |
| 9148 | NEURL1 | HTA12-29-1 | Human | Pancreas | PDAC | 8.84e-16 | 5.22e-01 | 0.3722 |
| Page: 1 |
| Tissue | Expression Dynamics | Abbreviation |
| Colorectum (GSE201348) |  | FAP: Familial adenomatous polyposis |
| CRC: Colorectal cancer | ||
| Colorectum (HTA11) |  | AD: Adenomas |
| SER: Sessile serrated lesions | ||
| MSI-H: Microsatellite-high colorectal cancer | ||
| MSS: Microsatellite stable colorectal cancer | ||
| Esophagus | 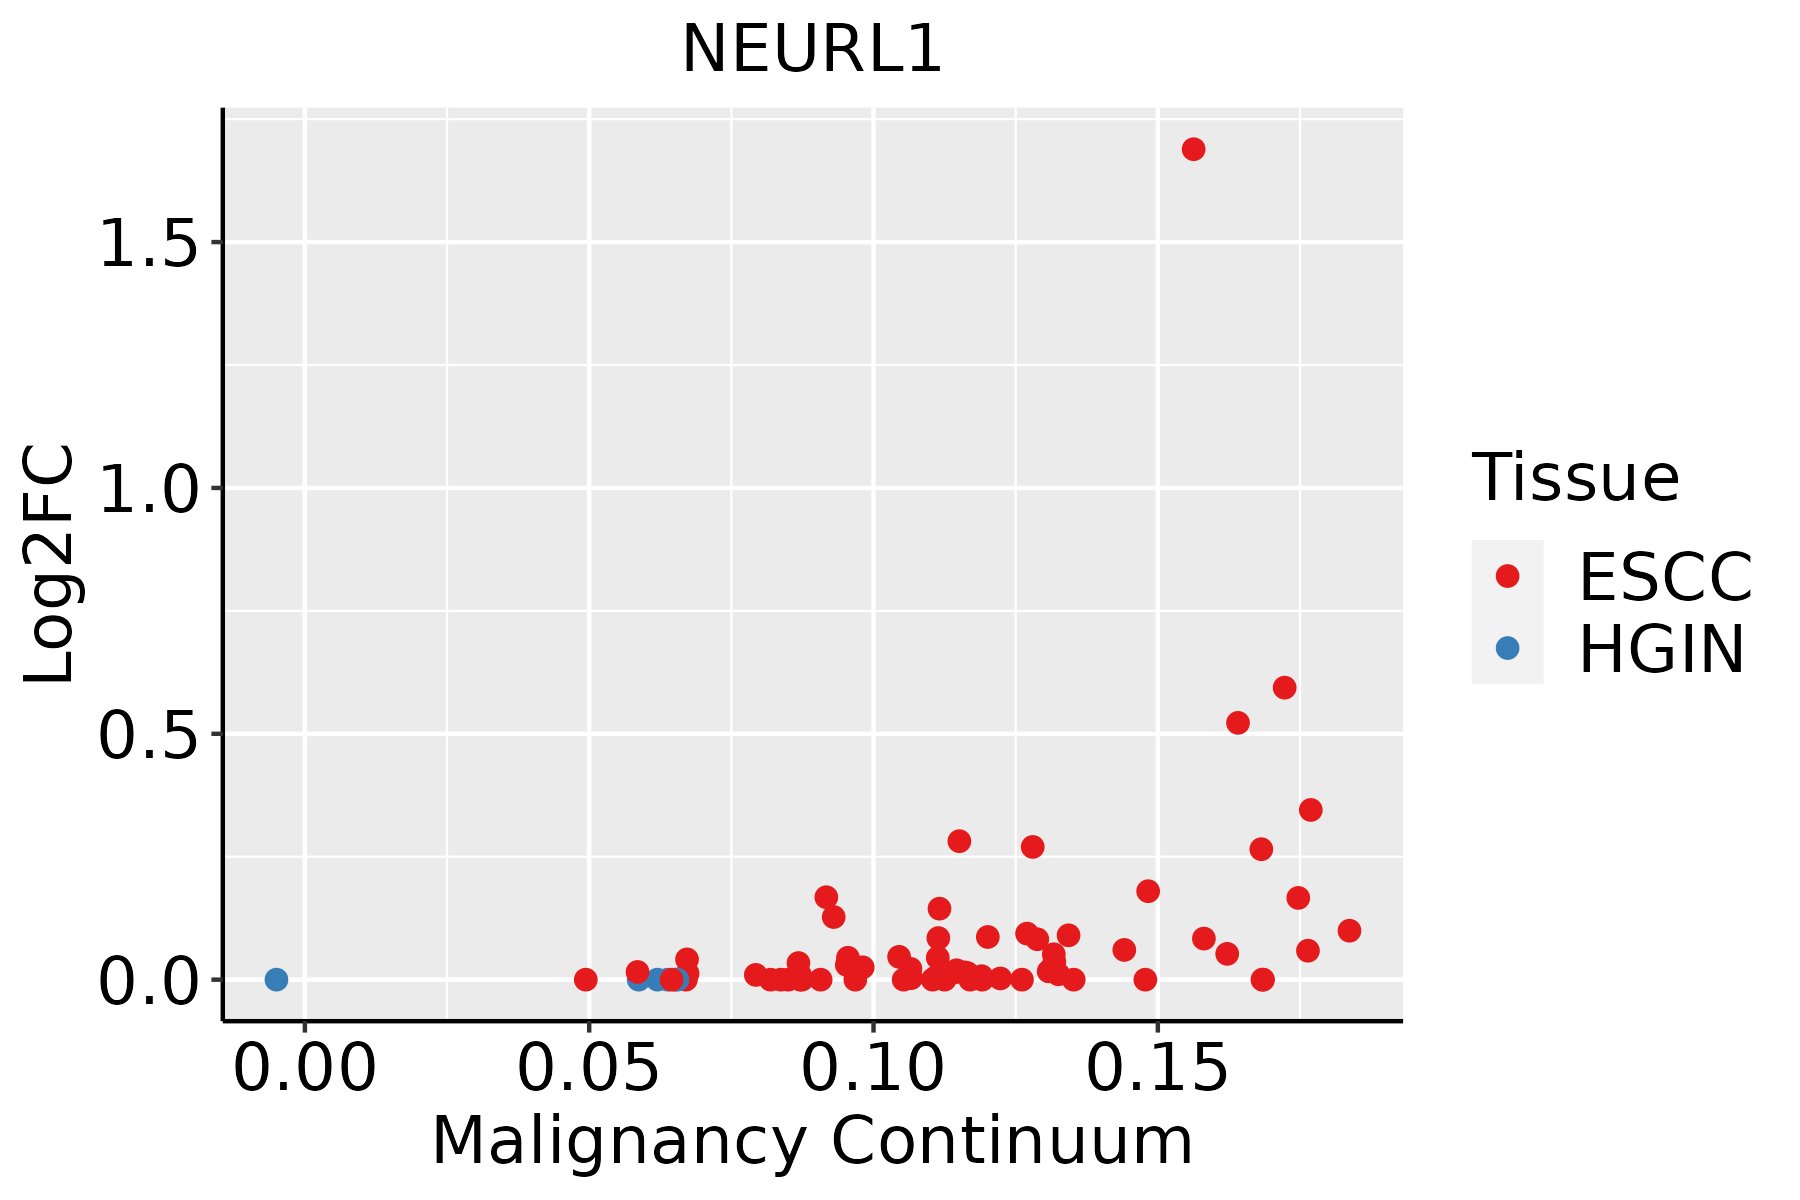 | ESCC: Esophageal squamous cell carcinoma |
| HGIN: High-grade intraepithelial neoplasias | ||
| LGIN: Low-grade intraepithelial neoplasias |
| ∗log2FC in expression of this searched gene in stem-like cells from each diseased tissue sample relative to stem-like cells in normal samples in each tissue plotted against the malignancy continuum. Samples are colored based on if they are from different disease stage. |
Top |
Malignant transformation related pathway analysis |
| Find out the enriched GO biological processes and KEGG pathways involved in transition from healthy to precancer to cancer |
| Tissue | Disease Stage | Enriched GO biological Processes |
| Colorectum | AD |  |
| Colorectum | SER |  |
| Colorectum | MSS |  |
| Colorectum | MSI-H |  |
| Colorectum | FAP |  |
| ∗Top 15 enriched GO BP terms are showed in the bar plot of each disease state in each tissue. Each row represents a significant GO biological process which is colored according to the -log10(p.adjust). |
| Page: 1 2 3 4 5 6 7 8 9 |
| GO ID | Tissue | Disease Stage | Description | Gene Ratio | Bg Ratio | pvalue | p.adjust | Count |
| GO:0072594 | Colorectum | AD | establishment of protein localization to organelle | 148/3918 | 422/18723 | 7.95e-12 | 1.04e-09 | 148 |
| GO:0048732 | Colorectum | AD | gland development | 149/3918 | 436/18723 | 6.07e-11 | 6.33e-09 | 149 |
| GO:0038127 | Colorectum | AD | ERBB signaling pathway | 55/3918 | 121/18723 | 1.19e-09 | 8.85e-08 | 55 |
| GO:0007173 | Colorectum | AD | epidermal growth factor receptor signaling pathway | 50/3918 | 108/18723 | 3.08e-09 | 2.07e-07 | 50 |
| GO:0006417 | Colorectum | AD | regulation of translation | 141/3918 | 468/18723 | 1.32e-06 | 4.22e-05 | 141 |
| GO:0030879 | Colorectum | AD | mammary gland development | 53/3918 | 137/18723 | 1.46e-06 | 4.58e-05 | 53 |
| GO:1901184 | Colorectum | AD | regulation of ERBB signaling pathway | 34/3918 | 79/18723 | 7.46e-06 | 1.82e-04 | 34 |
| GO:0042058 | Colorectum | AD | regulation of epidermal growth factor receptor signaling pathway | 31/3918 | 73/18723 | 2.56e-05 | 4.89e-04 | 31 |
| GO:0031346 | Colorectum | AD | positive regulation of cell projection organization | 104/3918 | 353/18723 | 8.26e-05 | 1.30e-03 | 104 |
| GO:0033674 | Colorectum | AD | positive regulation of kinase activity | 131/3918 | 467/18723 | 1.28e-04 | 1.85e-03 | 131 |
| GO:0050878 | Colorectum | AD | regulation of body fluid levels | 108/3918 | 379/18723 | 2.54e-04 | 3.20e-03 | 108 |
| GO:0010720 | Colorectum | AD | positive regulation of cell development | 87/3918 | 298/18723 | 4.17e-04 | 4.71e-03 | 87 |
| GO:0045860 | Colorectum | AD | positive regulation of protein kinase activity | 107/3918 | 386/18723 | 8.01e-04 | 7.92e-03 | 107 |
| GO:0007589 | Colorectum | AD | body fluid secretion | 33/3918 | 93/18723 | 8.26e-04 | 8.13e-03 | 33 |
| GO:0050767 | Colorectum | AD | regulation of neurogenesis | 99/3918 | 364/18723 | 2.35e-03 | 1.82e-02 | 99 |
| GO:0016358 | Colorectum | AD | dendrite development | 69/3918 | 243/18723 | 3.32e-03 | 2.42e-02 | 69 |
| GO:0050808 | Colorectum | AD | synapse organization | 112/3918 | 426/18723 | 4.25e-03 | 2.92e-02 | 112 |
| GO:0007595 | Colorectum | AD | lactation | 18/3918 | 47/18723 | 4.81e-03 | 3.25e-02 | 18 |
| GO:0050807 | Colorectum | AD | regulation of synapse organization | 60/3918 | 211/18723 | 5.67e-03 | 3.64e-02 | 60 |
| GO:0007219 | Colorectum | AD | Notch signaling pathway | 50/3918 | 172/18723 | 6.92e-03 | 4.26e-02 | 50 |
| Page: 1 2 3 4 |
| Pathway ID | Tissue | Disease Stage | Description | Gene Ratio | Bg Ratio | pvalue | p.adjust | qvalue | Count |
| Page: 1 |
Top |
Cell-cell communication analysis |
| Identification of potential cell-cell interactions between two cell types and their ligand-receptor pairs for different disease states |
| Ligand | Receptor | LRpair | Pathway | Tissue | Disease Stage |
| Page: 1 |
Top |
Single-cell gene regulatory network inference analysis |
| Find out the significant the regulons (TFs) and the target genes of each regulon across cell types for different disease states |
| TF | Cell Type | Tissue | Disease Stage | Target Gene | RSS | Regulon Activity |
| ∗The dot plots of a searched regulon are shown for all cell subpopulations in each disease state of each tissue based on the regulon specific score inferred using pySCENIC and by calculating the average expression. |
| Page: 1 |
Top |
Somatic mutation of malignant transformation related genes |
| Annotation of somatic variants for genes involved in malignant transformation |
| Hugo Symbol | Variant Class | Variant Classification | dbSNP RS | HGVSc | HGVSp | HGVSp Short | SWISSPROT | BIOTYPE | SIFT | PolyPhen | Tumor Sample Barcode | Tissue | Histology | Sex | Age | Stage | Therapy Types | Drugs | Outcome |
| NEURL1 | SNV | Missense_Mutation | novel | c.233N>C | p.Leu78Pro | p.L78P | O76050 | protein_coding | tolerated(0.28) | probably_damaging(0.949) | TCGA-A8-A095-01 | Breast | breast invasive carcinoma | Female | <65 | I/II | Chemotherapy | 5-fluorouracil | CR |
| NEURL1 | SNV | Missense_Mutation | c.1285N>T | p.Pro429Ser | p.P429S | O76050 | protein_coding | tolerated(0.16) | probably_damaging(0.996) | TCGA-AD-6889-01 | Colorectum | colon adenocarcinoma | Male | >=65 | I/II | Chemotherapy | xeloda | PD | |
| NEURL1 | SNV | Missense_Mutation | rs755198069 | c.1523N>T | p.Ser508Leu | p.S508L | O76050 | protein_coding | deleterious(0.02) | probably_damaging(0.992) | TCGA-AD-A5EJ-01 | Colorectum | colon adenocarcinoma | Female | >=65 | I/II | Unknown | Unknown | SD |
| NEURL1 | SNV | Missense_Mutation | rs200676641 | c.1643N>A | p.Arg548His | p.R548H | O76050 | protein_coding | deleterious(0) | possibly_damaging(0.841) | TCGA-CK-4951-01 | Colorectum | colon adenocarcinoma | Female | >=65 | I/II | Unknown | Unknown | PD |
| NEURL1 | SNV | Missense_Mutation | rs61871259 | c.292N>T | p.Arg98Cys | p.R98C | O76050 | protein_coding | deleterious(0) | probably_damaging(0.999) | TCGA-G4-6309-01 | Colorectum | colon adenocarcinoma | Female | <65 | III/IV | Chemotherapy | xeloda | PD |
| NEURL1 | SNV | Missense_Mutation | novel | c.1372N>C | p.Ser458Pro | p.S458P | O76050 | protein_coding | tolerated(0.07) | benign(0.018) | TCGA-A5-A0G2-01 | Endometrium | uterine corpus endometrioid carcinoma | Female | <65 | III/IV | Unknown | Unknown | SD |
| NEURL1 | SNV | Missense_Mutation | rs539510212 | c.424N>A | p.Ala142Thr | p.A142T | O76050 | protein_coding | deleterious(0) | probably_damaging(0.997) | TCGA-AJ-A2QO-01 | Endometrium | uterine corpus endometrioid carcinoma | Female | >=65 | I/II | Unknown | Unknown | SD |
| NEURL1 | SNV | Missense_Mutation | novel | c.1543G>A | p.Gly515Ser | p.G515S | O76050 | protein_coding | tolerated(0.18) | benign(0.195) | TCGA-AP-A1DK-01 | Endometrium | uterine corpus endometrioid carcinoma | Female | <65 | I/II | Unknown | Unknown | SD |
| NEURL1 | SNV | Missense_Mutation | novel | c.554C>T | p.Ser185Leu | p.S185L | O76050 | protein_coding | tolerated(0.32) | benign(0.348) | TCGA-AP-A1DV-01 | Endometrium | uterine corpus endometrioid carcinoma | Female | <65 | I/II | Unknown | Unknown | SD |
| NEURL1 | SNV | Missense_Mutation | rs200676641 | c.1643G>A | p.Arg548His | p.R548H | O76050 | protein_coding | deleterious(0) | possibly_damaging(0.841) | TCGA-AX-A06F-01 | Endometrium | uterine corpus endometrioid carcinoma | Female | <65 | III/IV | Chemotherapy | carboplatin | SD |
| Page: 1 2 3 4 |
Top |
Related drugs of malignant transformation related genes |
| Identification of chemicals and drugs interact with genes involved in malignant transfromation |
| (DGIdb 4.0) |
| Entrez ID | Symbol | Category | Interaction Types | Drug Claim Name | Drug Name | PMIDs |
| Page: 1 |

Copyright 2023-Present -The University of Texas Health Science Center at Houston |