
|
|||||
|
 | |
| |
| |
| |
| |
| |
|
Gene: NEU4 |
Gene summary for NEU4 |
| Gene information | Species | Human | Gene symbol | NEU4 | Gene ID | 129807 |
| Gene name | neuraminidase 4 | |
| Gene Alias | NEU4 | |
| Cytomap | 2q37.3 | |
| Gene Type | protein-coding | GO ID | GO:0001573 | UniProtAcc | B3KR54 |
Top |
Malignant transformation analysis |
| Identification of the aberrant gene expression in precancerous and cancerous lesions by comparing the gene expression of stem-like cells in diseased tissues with normal stem cells |
| Entrez ID | Symbol | Replicates | Species | Organ | Tissue | Adj P-value | Log2FC | Malignancy |
| 129807 | NEU4 | HTA11_2112_2000001011 | Human | Colorectum | SER | 4.97e-02 | 4.28e-01 | -0.2196 |
| 129807 | NEU4 | HTA11_83_2000001011 | Human | Colorectum | SER | 6.04e-06 | 4.13e-01 | -0.1526 |
| 129807 | NEU4 | HTA11_696_2000001011 | Human | Colorectum | AD | 3.61e-11 | 3.67e-01 | -0.1464 |
| 129807 | NEU4 | HTA11_2992_2000001011 | Human | Colorectum | SER | 2.67e-06 | 4.13e-01 | -0.1706 |
| 129807 | NEU4 | HTA11_5212_2000001011 | Human | Colorectum | AD | 1.13e-04 | 4.26e-01 | -0.2061 |
| 129807 | NEU4 | HTA11_10623_2000001011 | Human | Colorectum | AD | 1.41e-02 | 2.48e-01 | -0.0177 |
| 129807 | NEU4 | HCC1_Meng | Human | Liver | HCC | 1.10e-38 | 1.43e-01 | 0.0246 |
| 129807 | NEU4 | HCC1 | Human | Liver | HCC | 8.31e-03 | 8.95e-01 | 0.5336 |
| 129807 | NEU4 | HCC2 | Human | Liver | HCC | 2.30e-15 | 2.59e+00 | 0.5341 |
| 129807 | NEU4 | Pt14.a | Human | Liver | HCC | 6.27e-08 | 5.42e-01 | 0.0169 |
| 129807 | NEU4 | S028 | Human | Liver | HCC | 3.15e-19 | 7.57e-01 | 0.2503 |
| Page: 1 |
| Tissue | Expression Dynamics | Abbreviation |
| Colorectum (GSE201348) |  | FAP: Familial adenomatous polyposis |
| CRC: Colorectal cancer | ||
| Colorectum (HTA11) |  | AD: Adenomas |
| SER: Sessile serrated lesions | ||
| MSI-H: Microsatellite-high colorectal cancer | ||
| MSS: Microsatellite stable colorectal cancer | ||
| Liver | 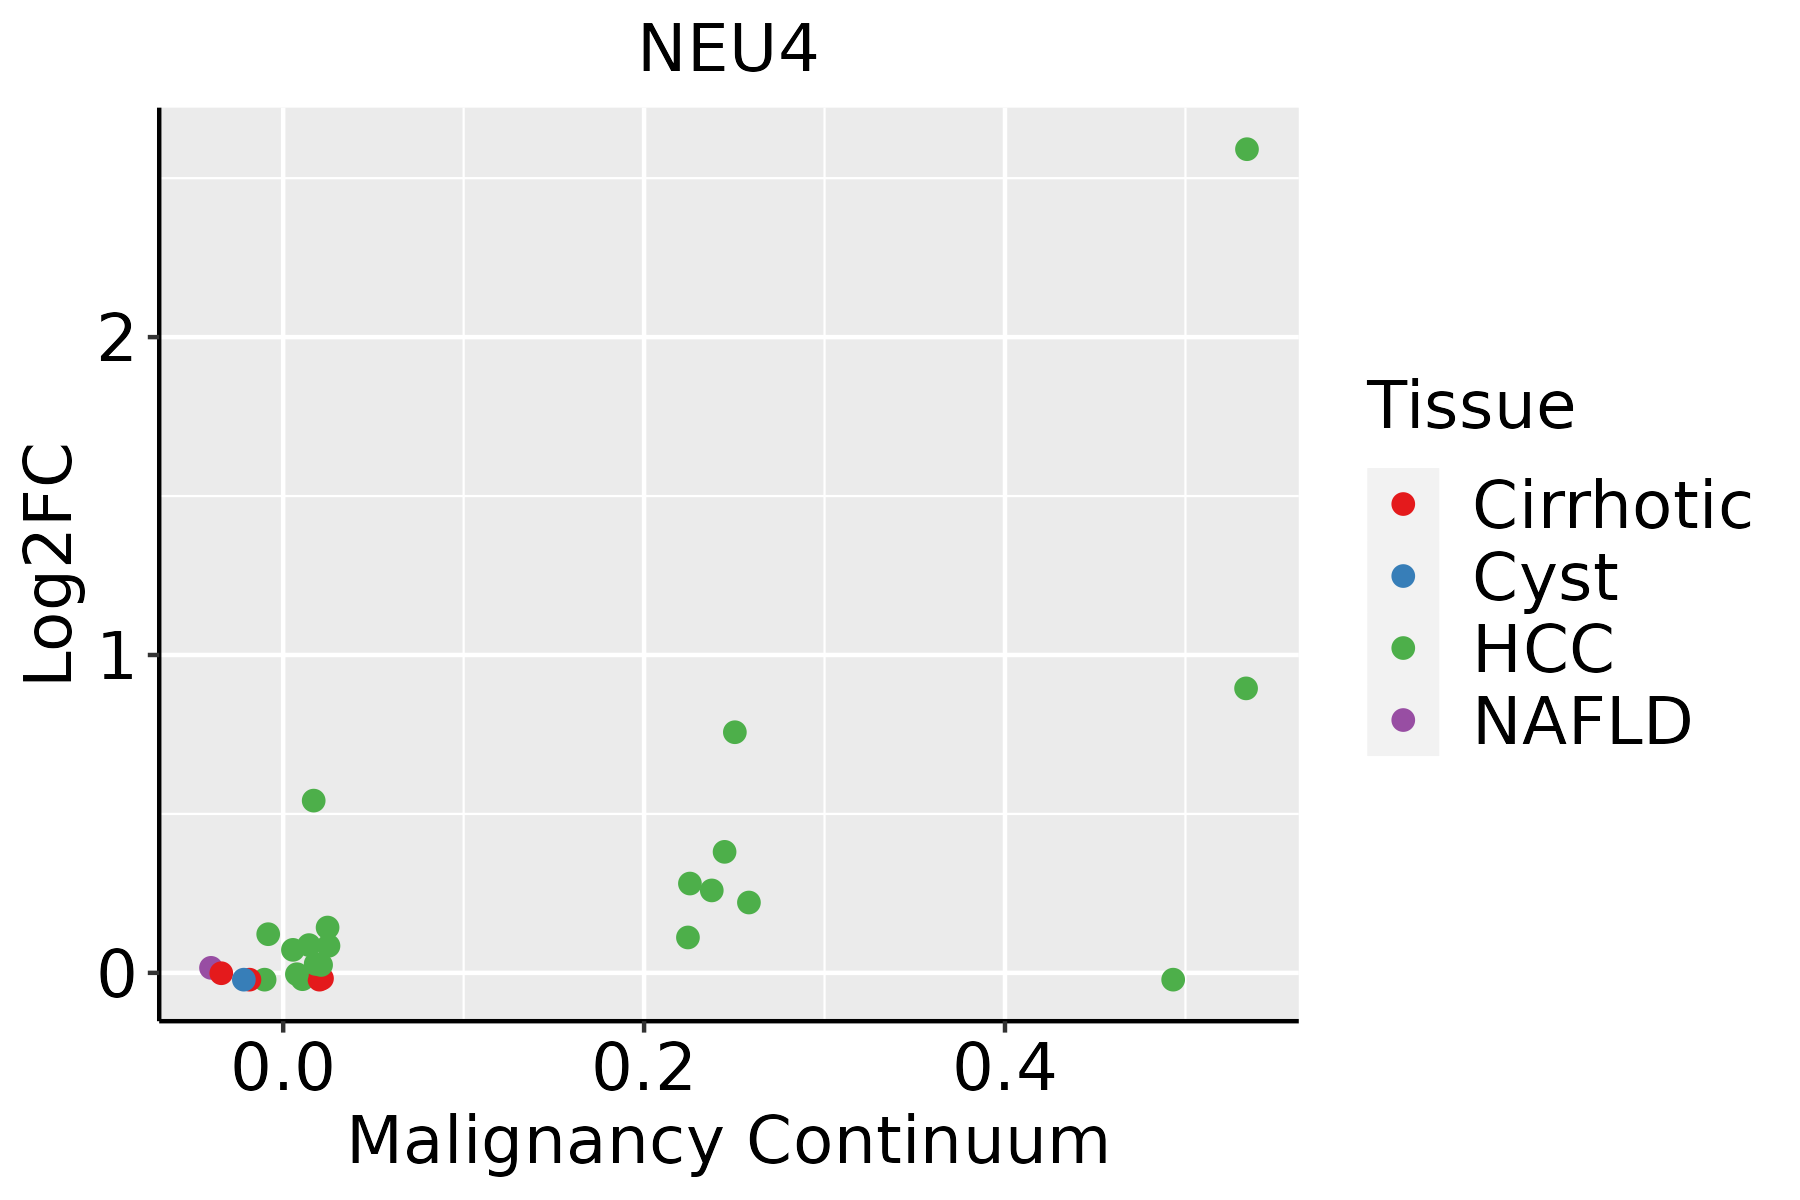 | HCC: Hepatocellular carcinoma |
| NAFLD: Non-alcoholic fatty liver disease |
| ∗log2FC in expression of this searched gene in stem-like cells from each diseased tissue sample relative to stem-like cells in normal samples in each tissue plotted against the malignancy continuum. Samples are colored based on if they are from different disease stage. |
Top |
Malignant transformation related pathway analysis |
| Find out the enriched GO biological processes and KEGG pathways involved in transition from healthy to precancer to cancer |
| Tissue | Disease Stage | Enriched GO biological Processes |
| Colorectum | AD |  |
| Colorectum | SER |  |
| Colorectum | MSS |  |
| Colorectum | MSI-H |  |
| Colorectum | FAP |  |
| ∗Top 15 enriched GO BP terms are showed in the bar plot of each disease state in each tissue. Each row represents a significant GO biological process which is colored according to the -log10(p.adjust). |
| Page: 1 2 3 4 5 6 7 8 9 |
| GO ID | Tissue | Disease Stage | Description | Gene Ratio | Bg Ratio | pvalue | p.adjust | Count |
| GO:0016052 | Colorectum | AD | carbohydrate catabolic process | 56/3918 | 154/18723 | 7.01e-06 | 1.73e-04 | 56 |
| GO:0010975 | Colorectum | AD | regulation of neuron projection development | 129/3918 | 445/18723 | 2.88e-05 | 5.37e-04 | 129 |
| GO:0016042 | Colorectum | AD | lipid catabolic process | 97/3918 | 320/18723 | 4.31e-05 | 7.56e-04 | 97 |
| GO:0044242 | Colorectum | AD | cellular lipid catabolic process | 66/3918 | 214/18723 | 3.96e-04 | 4.50e-03 | 66 |
| GO:0031345 | Colorectum | AD | negative regulation of cell projection organization | 58/3918 | 186/18723 | 6.37e-04 | 6.58e-03 | 58 |
| GO:0010977 | Colorectum | AD | negative regulation of neuron projection development | 43/3918 | 137/18723 | 2.60e-03 | 1.97e-02 | 43 |
| GO:00160421 | Colorectum | SER | lipid catabolic process | 77/2897 | 320/18723 | 3.52e-05 | 9.18e-04 | 77 |
| GO:00442421 | Colorectum | SER | cellular lipid catabolic process | 51/2897 | 214/18723 | 8.60e-04 | 1.05e-02 | 51 |
| GO:00109751 | Colorectum | SER | regulation of neuron projection development | 92/2897 | 445/18723 | 1.85e-03 | 1.89e-02 | 92 |
| GO:00160521 | Colorectum | SER | carbohydrate catabolic process | 38/2897 | 154/18723 | 1.92e-03 | 1.93e-02 | 38 |
| GO:00313451 | Colorectum | SER | negative regulation of cell projection organization | 42/2897 | 186/18723 | 6.51e-03 | 4.66e-02 | 42 |
| GO:004424222 | Liver | HCC | cellular lipid catabolic process | 134/7958 | 214/18723 | 2.07e-09 | 5.79e-08 | 134 |
| GO:001605222 | Liver | HCC | carbohydrate catabolic process | 99/7958 | 154/18723 | 3.79e-08 | 8.30e-07 | 99 |
| GO:001604221 | Liver | HCC | lipid catabolic process | 175/7958 | 320/18723 | 6.50e-06 | 7.88e-05 | 175 |
| GO:00066431 | Liver | HCC | membrane lipid metabolic process | 115/7958 | 203/18723 | 3.17e-05 | 3.22e-04 | 115 |
| GO:1901136 | Liver | HCC | carbohydrate derivative catabolic process | 98/7958 | 172/18723 | 8.71e-05 | 7.62e-04 | 98 |
| GO:0006665 | Liver | HCC | sphingolipid metabolic process | 85/7958 | 155/18723 | 1.27e-03 | 6.92e-03 | 85 |
| GO:001097511 | Liver | HCC | regulation of neuron projection development | 220/7958 | 445/18723 | 1.68e-03 | 8.78e-03 | 220 |
| GO:0009100 | Liver | HCC | glycoprotein metabolic process | 193/7958 | 387/18723 | 1.89e-03 | 9.62e-03 | 193 |
| GO:0006664 | Liver | HCC | glycolipid metabolic process | 57/7958 | 100/18723 | 2.40e-03 | 1.17e-02 | 57 |
| Page: 1 2 |
| Pathway ID | Tissue | Disease Stage | Description | Gene Ratio | Bg Ratio | pvalue | p.adjust | qvalue | Count |
| hsa00600 | Liver | HCC | Sphingolipid metabolism | 34/4020 | 53/8465 | 1.06e-02 | 2.71e-02 | 1.51e-02 | 34 |
| hsa006001 | Liver | HCC | Sphingolipid metabolism | 34/4020 | 53/8465 | 1.06e-02 | 2.71e-02 | 1.51e-02 | 34 |
| Page: 1 |
Top |
Cell-cell communication analysis |
| Identification of potential cell-cell interactions between two cell types and their ligand-receptor pairs for different disease states |
| Ligand | Receptor | LRpair | Pathway | Tissue | Disease Stage |
| Page: 1 |
Top |
Single-cell gene regulatory network inference analysis |
| Find out the significant the regulons (TFs) and the target genes of each regulon across cell types for different disease states |
| TF | Cell Type | Tissue | Disease Stage | Target Gene | RSS | Regulon Activity |
| ∗The dot plots of a searched regulon are shown for all cell subpopulations in each disease state of each tissue based on the regulon specific score inferred using pySCENIC and by calculating the average expression. |
| Page: 1 |
Top |
Somatic mutation of malignant transformation related genes |
| Annotation of somatic variants for genes involved in malignant transformation |
| Hugo Symbol | Variant Class | Variant Classification | dbSNP RS | HGVSc | HGVSp | HGVSp Short | SWISSPROT | BIOTYPE | SIFT | PolyPhen | Tumor Sample Barcode | Tissue | Histology | Sex | Age | Stage | Therapy Types | Drugs | Outcome |
| NEU4 | SNV | Missense_Mutation | novel | c.1199G>A | p.Arg400Lys | p.R400K | Q8WWR8 | protein_coding | tolerated(0.68) | benign(0.007) | TCGA-A2-A3XV-01 | Breast | breast invasive carcinoma | Female | <65 | I/II | Chemotherapy | carboplatin | CR |
| NEU4 | SNV | Missense_Mutation | rs370002261 | c.667C>T | p.Arg223Cys | p.R223C | Q8WWR8 | protein_coding | deleterious(0.02) | benign(0.083) | TCGA-AR-A2LO-01 | Breast | breast invasive carcinoma | Female | <65 | I/II | Chemotherapy | adriamycin | SD |
| NEU4 | SNV | Missense_Mutation | novel | c.545C>T | p.Ser182Leu | p.S182L | Q8WWR8 | protein_coding | deleterious(0) | probably_damaging(0.996) | TCGA-DS-A1OB-01 | Cervix | cervical & endocervical cancer | Female | <65 | I/II | Chemotherapy | carboplatin | PD |
| NEU4 | insertion | Frame_Shift_Ins | novel | c.325_326insAGCCCCCGGCCAGCGT | p.Gly109GlufsTer21 | p.G109Efs*21 | Q8WWR8 | protein_coding | TCGA-DS-A1OB-01 | Cervix | cervical & endocervical cancer | Female | <65 | I/II | Chemotherapy | carboplatin | PD | ||
| NEU4 | SNV | Missense_Mutation | rs370244576 | c.406N>T | p.Arg136Cys | p.R136C | Q8WWR8 | protein_coding | deleterious(0) | probably_damaging(0.999) | TCGA-A6-6651-01 | Colorectum | colon adenocarcinoma | Female | <65 | III/IV | Ancillary | leucovorin | SD |
| NEU4 | SNV | Missense_Mutation | rs780590587 | c.278N>T | p.Ala93Val | p.A93V | Q8WWR8 | protein_coding | tolerated(0.05) | benign(0.027) | TCGA-AZ-4615-01 | Colorectum | colon adenocarcinoma | Male | >=65 | III/IV | Chemotherapy | xeloda | PD |
| NEU4 | SNV | Missense_Mutation | rs537701318 | c.1195N>T | p.Arg399Cys | p.R399C | Q8WWR8 | protein_coding | deleterious(0.01) | possibly_damaging(0.84) | TCGA-QL-A97D-01 | Colorectum | colon adenocarcinoma | Female | >=65 | I/II | Unknown | Unknown | SD |
| NEU4 | SNV | Missense_Mutation | rs374258246 | c.719C>T | p.Ala240Val | p.A240V | Q8WWR8 | protein_coding | tolerated(0.48) | benign(0.013) | TCGA-EI-6917-01 | Colorectum | rectum adenocarcinoma | Male | <65 | III/IV | Chemotherapy | 5fluorouracil+oxaciplatina+l-folinian | SD |
| NEU4 | SNV | Missense_Mutation | rs377551488 | c.634N>A | p.Ala212Thr | p.A212T | Q8WWR8 | protein_coding | tolerated(0.38) | benign(0.079) | TCGA-F5-6811-01 | Colorectum | rectum adenocarcinoma | Female | >=65 | I/II | Unknown | Unknown | SD |
| NEU4 | SNV | Missense_Mutation | novel | c.82N>T | p.Arg28Trp | p.R28W | Q8WWR8 | protein_coding | deleterious(0) | probably_damaging(0.947) | TCGA-F5-6814-01 | Colorectum | rectum adenocarcinoma | Male | <65 | I/II | Unknown | Unknown | SD |
| Page: 1 2 3 4 5 |
Top |
Related drugs of malignant transformation related genes |
| Identification of chemicals and drugs interact with genes involved in malignant transfromation |
| (DGIdb 4.0) |
| Entrez ID | Symbol | Category | Interaction Types | Drug Claim Name | Drug Name | PMIDs |
| Page: 1 |

Copyright 2023-Present -The University of Texas Health Science Center at Houston |