
|
|||||
|
 | |
| |
| |
| |
| |
| |
|
Gene: NEU3 |
Gene summary for NEU3 |
| Gene information | Species | Human | Gene symbol | NEU3 | Gene ID | 10825 |
| Gene name | neuraminidase 3 | |
| Gene Alias | SIAL3 | |
| Cytomap | 11q13.4 | |
| Gene Type | protein-coding | GO ID | GO:0001573 | UniProtAcc | A0A024R5N6 |
Top |
Malignant transformation analysis |
| Identification of the aberrant gene expression in precancerous and cancerous lesions by comparing the gene expression of stem-like cells in diseased tissues with normal stem cells |
| Entrez ID | Symbol | Replicates | Species | Organ | Tissue | Adj P-value | Log2FC | Malignancy |
| 10825 | NEU3 | HCC1_Meng | Human | Liver | HCC | 6.62e-12 | -1.06e-02 | 0.0246 |
| 10825 | NEU3 | HCC1 | Human | Liver | HCC | 3.41e-07 | 5.78e-01 | 0.5336 |
| 10825 | NEU3 | HCC2 | Human | Liver | HCC | 1.16e-11 | 1.55e+00 | 0.5341 |
| Page: 1 |
| Tissue | Expression Dynamics | Abbreviation |
| Liver | 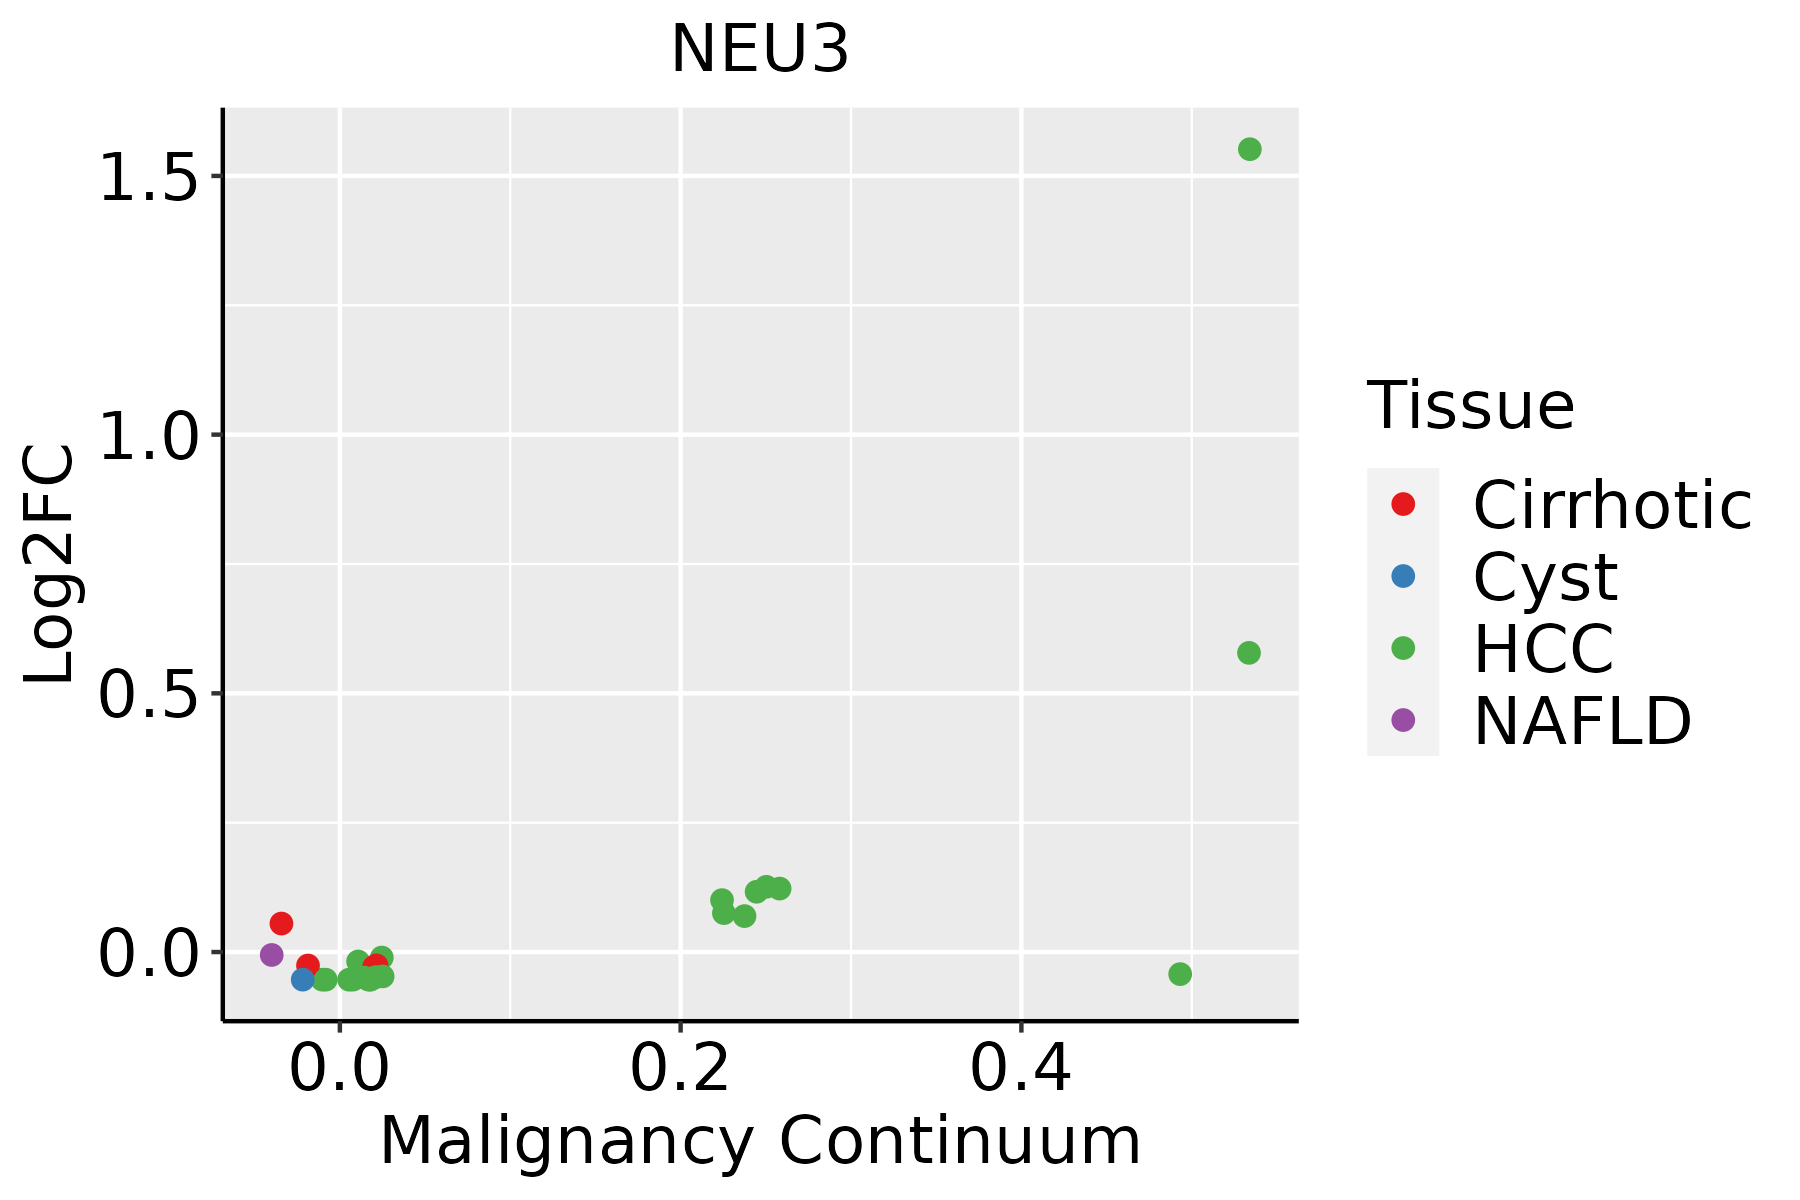 | HCC: Hepatocellular carcinoma |
| NAFLD: Non-alcoholic fatty liver disease |
| ∗log2FC in expression of this searched gene in stem-like cells from each diseased tissue sample relative to stem-like cells in normal samples in each tissue plotted against the malignancy continuum. Samples are colored based on if they are from different disease stage. |
Top |
Malignant transformation related pathway analysis |
| Find out the enriched GO biological processes and KEGG pathways involved in transition from healthy to precancer to cancer |
| Tissue | Disease Stage | Enriched GO biological Processes |
| Colorectum | AD |  |
| Colorectum | SER |  |
| Colorectum | MSS |  |
| Colorectum | MSI-H |  |
| Colorectum | FAP |  |
| ∗Top 15 enriched GO BP terms are showed in the bar plot of each disease state in each tissue. Each row represents a significant GO biological process which is colored according to the -log10(p.adjust). |
| Page: 1 2 3 4 5 6 7 8 9 |
| GO ID | Tissue | Disease Stage | Description | Gene Ratio | Bg Ratio | pvalue | p.adjust | Count |
| GO:004424222 | Liver | HCC | cellular lipid catabolic process | 134/7958 | 214/18723 | 2.07e-09 | 5.79e-08 | 134 |
| GO:001605222 | Liver | HCC | carbohydrate catabolic process | 99/7958 | 154/18723 | 3.79e-08 | 8.30e-07 | 99 |
| GO:001604221 | Liver | HCC | lipid catabolic process | 175/7958 | 320/18723 | 6.50e-06 | 7.88e-05 | 175 |
| GO:00066431 | Liver | HCC | membrane lipid metabolic process | 115/7958 | 203/18723 | 3.17e-05 | 3.22e-04 | 115 |
| GO:003812721 | Liver | HCC | ERBB signaling pathway | 73/7958 | 121/18723 | 5.65e-05 | 5.26e-04 | 73 |
| GO:000689821 | Liver | HCC | receptor-mediated endocytosis | 134/7958 | 244/18723 | 5.73e-05 | 5.31e-04 | 134 |
| GO:1901136 | Liver | HCC | carbohydrate derivative catabolic process | 98/7958 | 172/18723 | 8.71e-05 | 7.62e-04 | 98 |
| GO:003010021 | Liver | HCC | regulation of endocytosis | 117/7958 | 211/18723 | 9.56e-05 | 8.32e-04 | 117 |
| GO:000717321 | Liver | HCC | epidermal growth factor receptor signaling pathway | 65/7958 | 108/18723 | 1.56e-04 | 1.25e-03 | 65 |
| GO:007258311 | Liver | HCC | clathrin-dependent endocytosis | 31/7958 | 47/18723 | 9.90e-04 | 5.71e-03 | 31 |
| GO:0006665 | Liver | HCC | sphingolipid metabolic process | 85/7958 | 155/18723 | 1.27e-03 | 6.92e-03 | 85 |
| GO:19011844 | Liver | HCC | regulation of ERBB signaling pathway | 47/7958 | 79/18723 | 1.71e-03 | 8.91e-03 | 47 |
| GO:0006664 | Liver | HCC | glycolipid metabolic process | 57/7958 | 100/18723 | 2.40e-03 | 1.17e-02 | 57 |
| GO:1903509 | Liver | HCC | liposaccharide metabolic process | 57/7958 | 101/18723 | 3.25e-03 | 1.49e-02 | 57 |
| GO:00420584 | Liver | HCC | regulation of epidermal growth factor receptor signaling pathway | 43/7958 | 73/18723 | 3.43e-03 | 1.55e-02 | 43 |
| GO:004825921 | Liver | HCC | regulation of receptor-mediated endocytosis | 60/7958 | 110/18723 | 7.12e-03 | 2.84e-02 | 60 |
| Page: 1 |
| Pathway ID | Tissue | Disease Stage | Description | Gene Ratio | Bg Ratio | pvalue | p.adjust | qvalue | Count |
| hsa00511 | Liver | HCC | Other glycan degradation | 15/4020 | 18/8465 | 1.96e-03 | 6.91e-03 | 3.84e-03 | 15 |
| hsa00600 | Liver | HCC | Sphingolipid metabolism | 34/4020 | 53/8465 | 1.06e-02 | 2.71e-02 | 1.51e-02 | 34 |
| hsa005111 | Liver | HCC | Other glycan degradation | 15/4020 | 18/8465 | 1.96e-03 | 6.91e-03 | 3.84e-03 | 15 |
| hsa006001 | Liver | HCC | Sphingolipid metabolism | 34/4020 | 53/8465 | 1.06e-02 | 2.71e-02 | 1.51e-02 | 34 |
| Page: 1 |
Top |
Cell-cell communication analysis |
| Identification of potential cell-cell interactions between two cell types and their ligand-receptor pairs for different disease states |
| Ligand | Receptor | LRpair | Pathway | Tissue | Disease Stage |
| Page: 1 |
Top |
Single-cell gene regulatory network inference analysis |
| Find out the significant the regulons (TFs) and the target genes of each regulon across cell types for different disease states |
| TF | Cell Type | Tissue | Disease Stage | Target Gene | RSS | Regulon Activity |
| ∗The dot plots of a searched regulon are shown for all cell subpopulations in each disease state of each tissue based on the regulon specific score inferred using pySCENIC and by calculating the average expression. |
| Page: 1 |
Top |
Somatic mutation of malignant transformation related genes |
| Annotation of somatic variants for genes involved in malignant transformation |
| Hugo Symbol | Variant Class | Variant Classification | dbSNP RS | HGVSc | HGVSp | HGVSp Short | SWISSPROT | BIOTYPE | SIFT | PolyPhen | Tumor Sample Barcode | Tissue | Histology | Sex | Age | Stage | Therapy Types | Drugs | Outcome |
| NEU3 | SNV | Missense_Mutation | c.154G>A | p.Asp52Asn | p.D52N | Q9UQ49 | protein_coding | tolerated(0.82) | benign(0) | TCGA-AC-A23H-01 | Breast | breast invasive carcinoma | Female | >=65 | I/II | Unknown | Unknown | PD | |
| NEU3 | SNV | Missense_Mutation | rs777354093 | c.1211N>T | p.Ser404Phe | p.S404F | Q9UQ49 | protein_coding | deleterious(0) | probably_damaging(1) | TCGA-BH-A0B6-01 | Breast | breast invasive carcinoma | Female | <65 | I/II | Unknown | Unknown | SD |
| NEU3 | insertion | Frame_Shift_Ins | novel | c.1144_1145insTTTTTTTTTTCTTTCTTTCTTTCTTTGTAAAAATATTT | p.Gln382LeufsTer73 | p.Q382Lfs*73 | Q9UQ49 | protein_coding | TCGA-A2-A0EM-01 | Breast | breast invasive carcinoma | Female | >=65 | I/II | Hormone Therapy | tamoxiphen | SD | ||
| NEU3 | deletion | Frame_Shift_Del | novel | c.280delN | p.Leu95Ter | p.L95* | Q9UQ49 | protein_coding | TCGA-D8-A27V-01 | Breast | breast invasive carcinoma | Female | <65 | I/II | Hormone Therapy | tamoxiphen | SD | ||
| NEU3 | SNV | Missense_Mutation | novel | c.424N>T | p.Gly142Cys | p.G142C | Q9UQ49 | protein_coding | deleterious(0) | probably_damaging(0.964) | TCGA-AA-3867-01 | Colorectum | colon adenocarcinoma | Male | >=65 | III/IV | Unknown | Unknown | PD |
| NEU3 | SNV | Missense_Mutation | rs377168820 | c.173N>A | p.Arg58Gln | p.R58Q | Q9UQ49 | protein_coding | deleterious(0) | probably_damaging(0.999) | TCGA-AA-3930-01 | Colorectum | colon adenocarcinoma | Male | >=65 | III/IV | Chemotherapy | capecitabine | PD |
| NEU3 | SNV | Missense_Mutation | rs377057355 | c.421C>T | p.Arg141Trp | p.R141W | Q9UQ49 | protein_coding | tolerated(0.09) | benign(0.031) | TCGA-AA-3939-01 | Colorectum | colon adenocarcinoma | Male | >=65 | I/II | Unknown | Unknown | SD |
| NEU3 | SNV | Missense_Mutation | c.301G>A | p.Val101Ile | p.V101I | Q9UQ49 | protein_coding | deleterious(0.04) | probably_damaging(0.934) | TCGA-AU-3779-01 | Colorectum | colon adenocarcinoma | Female | >=65 | I/II | Unknown | Unknown | SD | |
| NEU3 | SNV | Missense_Mutation | c.473G>A | p.Arg158His | p.R158H | Q9UQ49 | protein_coding | deleterious(0.02) | probably_damaging(0.977) | TCGA-CK-4951-01 | Colorectum | colon adenocarcinoma | Female | >=65 | I/II | Unknown | Unknown | PD | |
| NEU3 | SNV | Missense_Mutation | rs371627063 | c.706A>G | p.Ile236Val | p.I236V | Q9UQ49 | protein_coding | tolerated(0.11) | benign(0.101) | TCGA-D5-6927-01 | Colorectum | colon adenocarcinoma | Male | <65 | I/II | Unknown | Unknown | SD |
| Page: 1 2 3 4 5 |
Top |
Related drugs of malignant transformation related genes |
| Identification of chemicals and drugs interact with genes involved in malignant transfromation |
| (DGIdb 4.0) |
| Entrez ID | Symbol | Category | Interaction Types | Drug Claim Name | Drug Name | PMIDs |
| 10825 | NEU3 | ENZYME, EXTERNAL SIDE OF PLASMA MEMBRANE | OSELTAMIVIR | OSELTAMIVIR | 18694948 |
| Page: 1 |

Copyright 2023-Present -The University of Texas Health Science Center at Houston |