
|
|||||
|
 | |
| |
| |
| |
| |
| |
|
Gene: NET1 |
Gene summary for NET1 |
| Gene information | Species | Human | Gene symbol | NET1 | Gene ID | 10276 |
| Gene name | neuroepithelial cell transforming 1 | |
| Gene Alias | ARHGEF8 | |
| Cytomap | 10p15.1 | |
| Gene Type | protein-coding | GO ID | GO:0000302 | UniProtAcc | Q5SQI5 |
Top |
Malignant transformation analysis |
| Identification of the aberrant gene expression in precancerous and cancerous lesions by comparing the gene expression of stem-like cells in diseased tissues with normal stem cells |
| Entrez ID | Symbol | Replicates | Species | Organ | Tissue | Adj P-value | Log2FC | Malignancy |
| 10276 | NET1 | HTA11_78_2000001011 | Human | Colorectum | AD | 2.98e-02 | 4.19e-01 | -0.1088 |
| 10276 | NET1 | HTA11_347_2000001011 | Human | Colorectum | AD | 5.80e-06 | 4.27e-01 | -0.1954 |
| 10276 | NET1 | HTA11_99999965104_69814 | Human | Colorectum | MSS | 9.84e-03 | 4.40e-01 | 0.281 |
| 10276 | NET1 | A015-C-203 | Human | Colorectum | FAP | 7.33e-11 | -8.05e-02 | -0.1294 |
| 10276 | NET1 | A001-C-108 | Human | Colorectum | FAP | 2.89e-05 | -1.21e-01 | -0.0272 |
| 10276 | NET1 | A002-C-205 | Human | Colorectum | FAP | 1.05e-06 | -1.67e-01 | -0.1236 |
| 10276 | NET1 | A015-C-006 | Human | Colorectum | FAP | 2.78e-05 | -2.22e-01 | -0.0994 |
| 10276 | NET1 | A015-C-106 | Human | Colorectum | FAP | 7.08e-06 | -1.05e-01 | -0.0511 |
| 10276 | NET1 | A002-C-114 | Human | Colorectum | FAP | 4.73e-06 | -2.71e-01 | -0.1561 |
| 10276 | NET1 | A015-C-104 | Human | Colorectum | FAP | 8.20e-14 | -1.98e-01 | -0.1899 |
| 10276 | NET1 | A001-C-014 | Human | Colorectum | FAP | 9.93e-05 | -1.02e-01 | 0.0135 |
| 10276 | NET1 | A002-C-016 | Human | Colorectum | FAP | 6.89e-06 | -1.49e-01 | 0.0521 |
| 10276 | NET1 | A015-C-002 | Human | Colorectum | FAP | 2.44e-02 | -2.21e-01 | -0.0763 |
| 10276 | NET1 | A001-C-203 | Human | Colorectum | FAP | 1.77e-05 | -8.66e-02 | -0.0481 |
| 10276 | NET1 | A002-C-116 | Human | Colorectum | FAP | 5.91e-14 | -1.57e-01 | -0.0452 |
| 10276 | NET1 | A014-C-008 | Human | Colorectum | FAP | 5.39e-04 | -2.59e-01 | -0.191 |
| 10276 | NET1 | A018-E-020 | Human | Colorectum | FAP | 2.87e-05 | -1.45e-02 | -0.2034 |
| 10276 | NET1 | F034 | Human | Colorectum | FAP | 4.34e-11 | -2.64e-01 | -0.0665 |
| 10276 | NET1 | CRC-3-11773 | Human | Colorectum | CRC | 5.18e-05 | -1.83e-01 | 0.2564 |
| 10276 | NET1 | LZE4T | Human | Esophagus | ESCC | 4.83e-05 | 6.08e-01 | 0.0811 |
| Page: 1 2 3 4 5 6 7 |
| Tissue | Expression Dynamics | Abbreviation |
| Colorectum (GSE201348) | 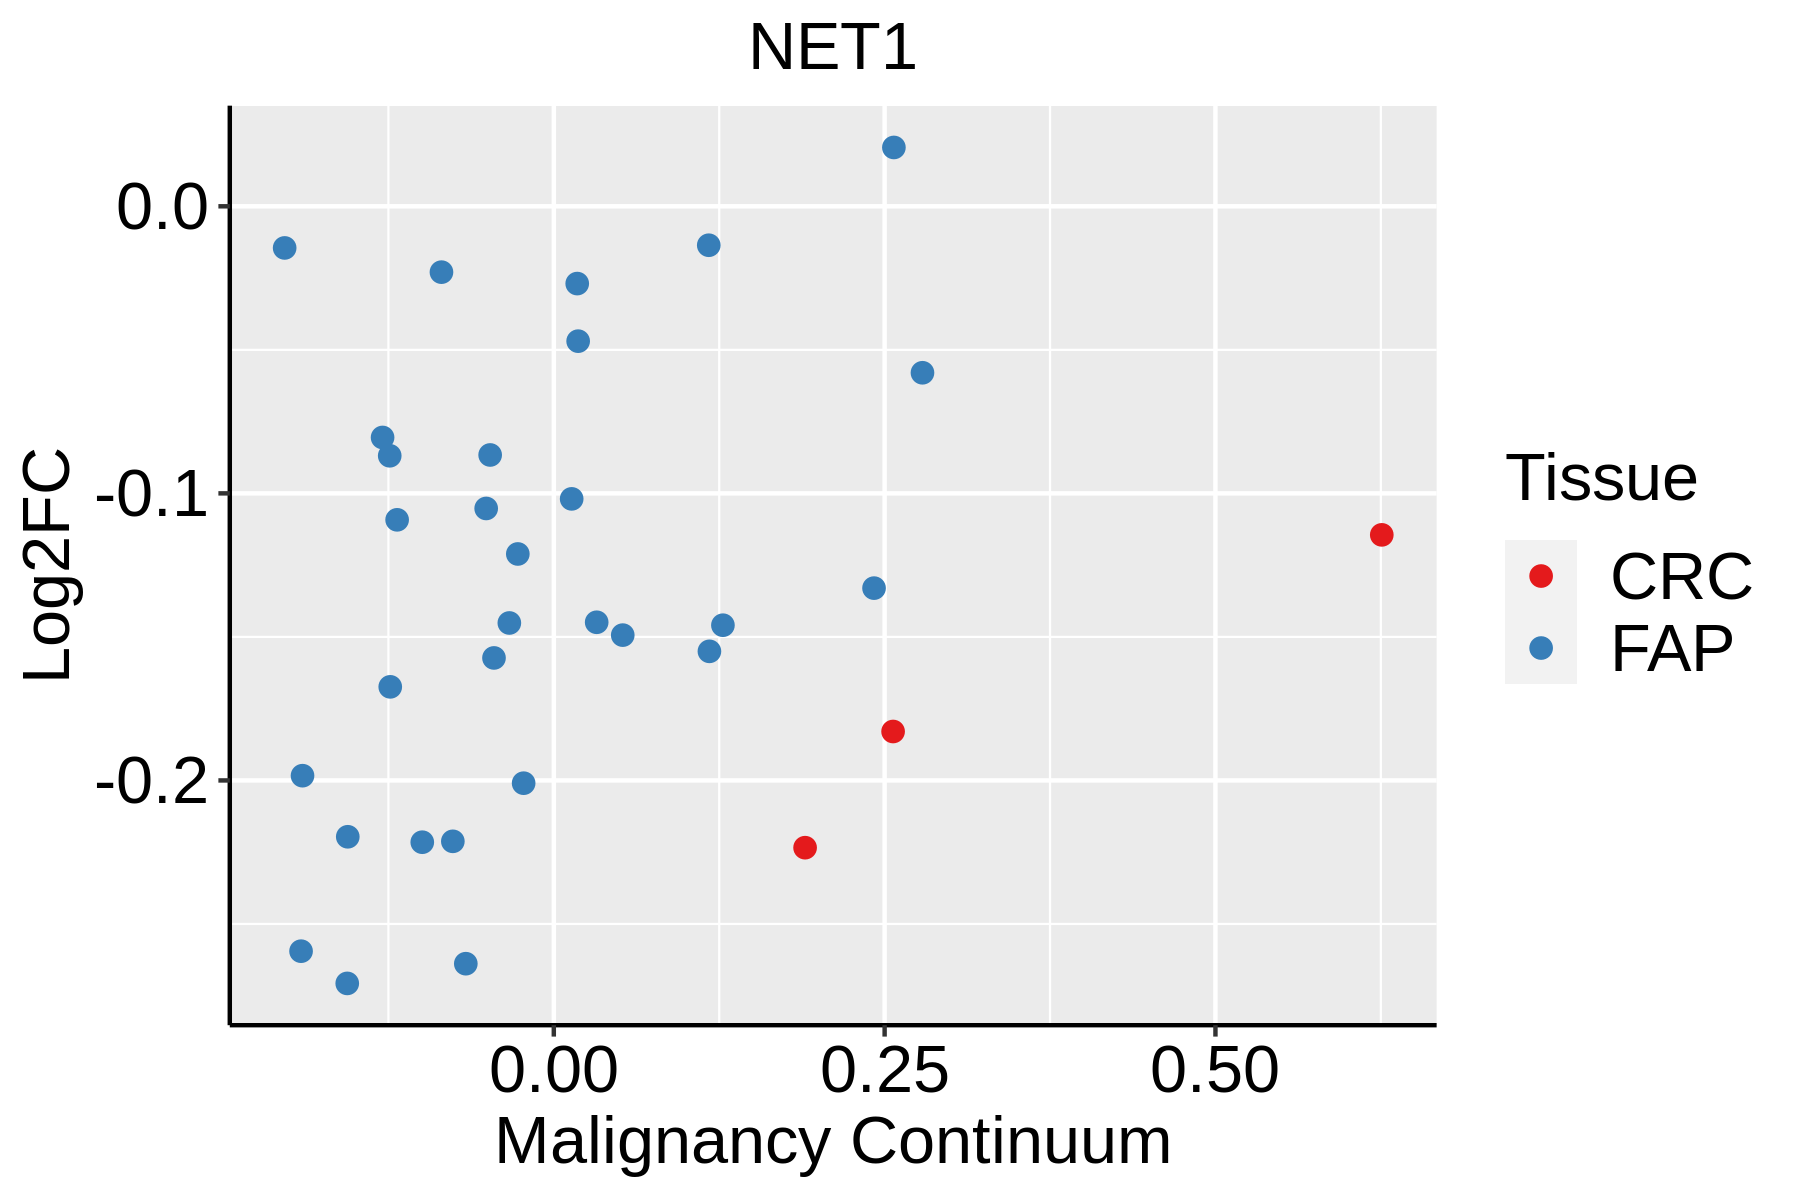 | FAP: Familial adenomatous polyposis |
| CRC: Colorectal cancer | ||
| Colorectum (HTA11) | 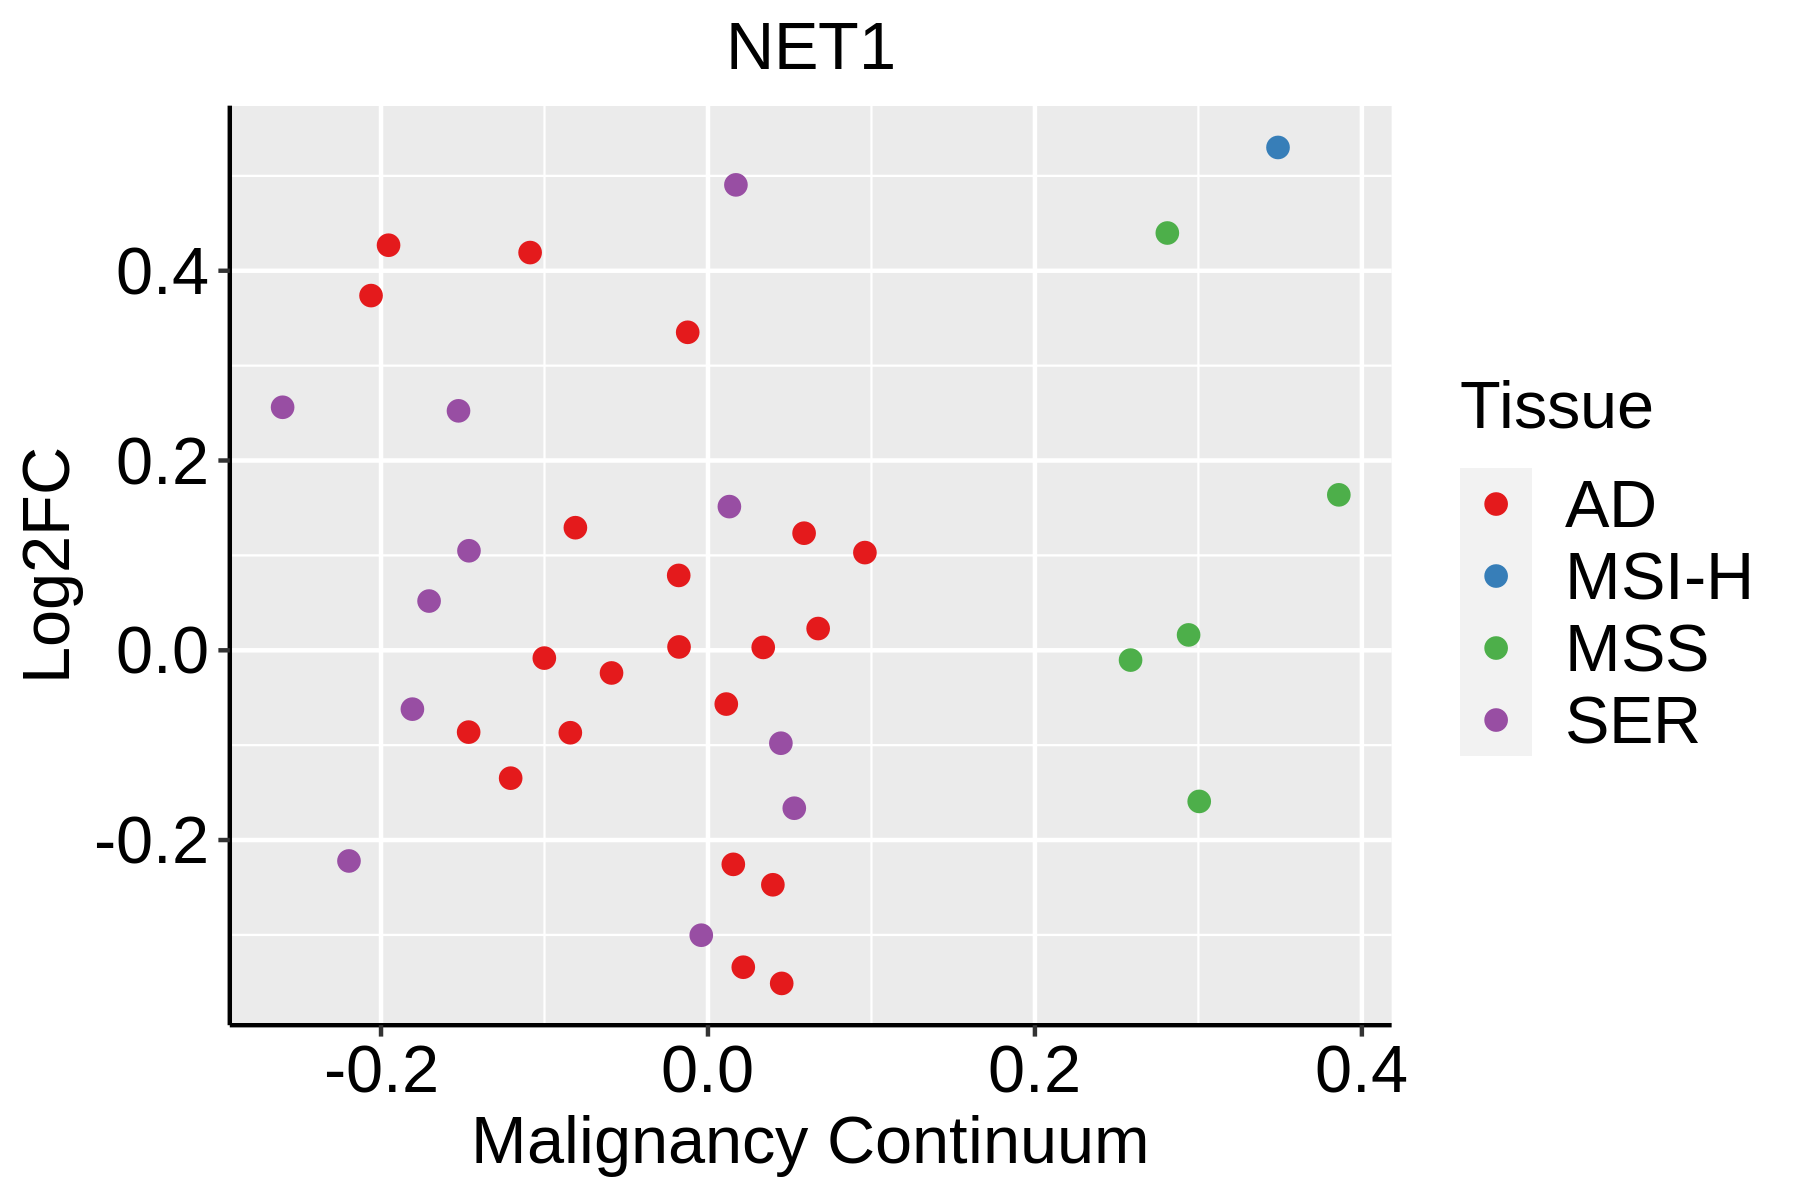 | AD: Adenomas |
| SER: Sessile serrated lesions | ||
| MSI-H: Microsatellite-high colorectal cancer | ||
| MSS: Microsatellite stable colorectal cancer | ||
| Esophagus | 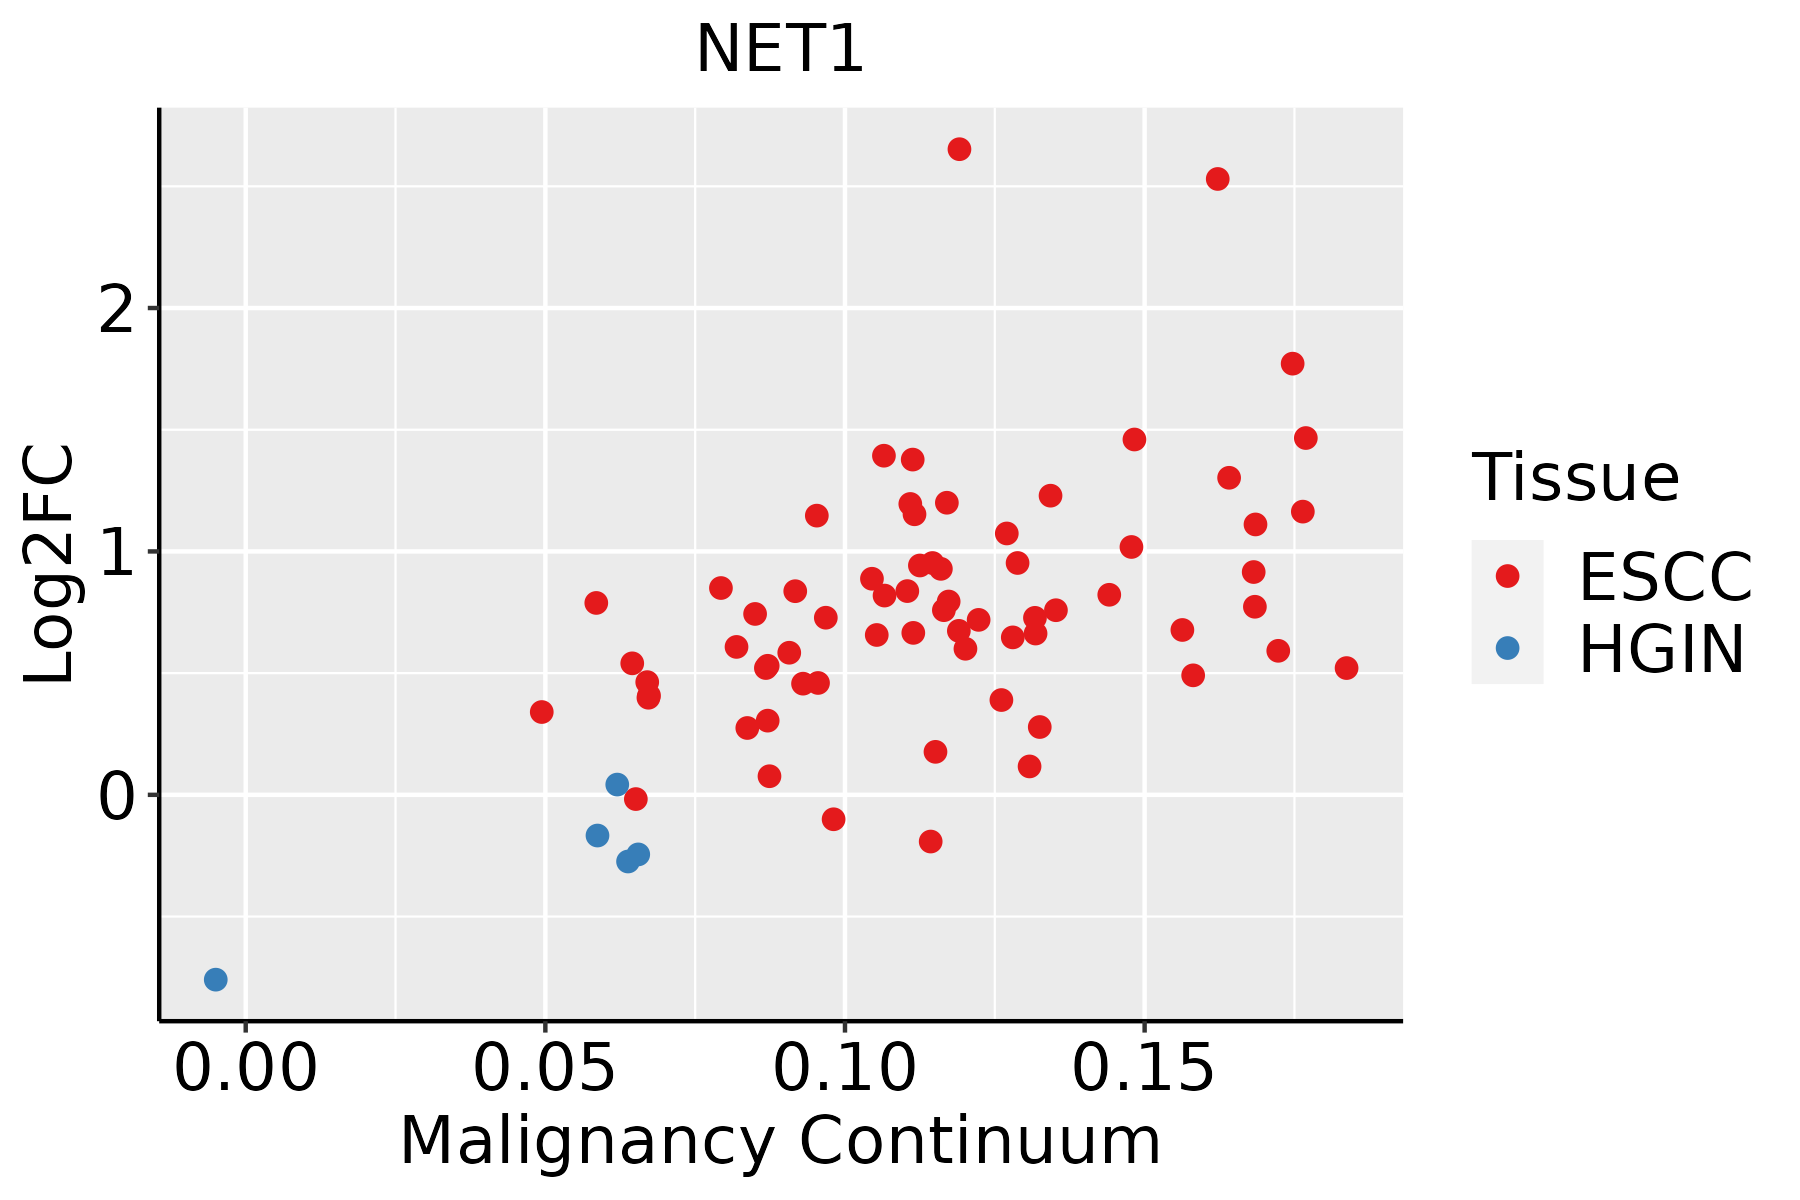 | ESCC: Esophageal squamous cell carcinoma |
| HGIN: High-grade intraepithelial neoplasias | ||
| LGIN: Low-grade intraepithelial neoplasias | ||
| Liver | 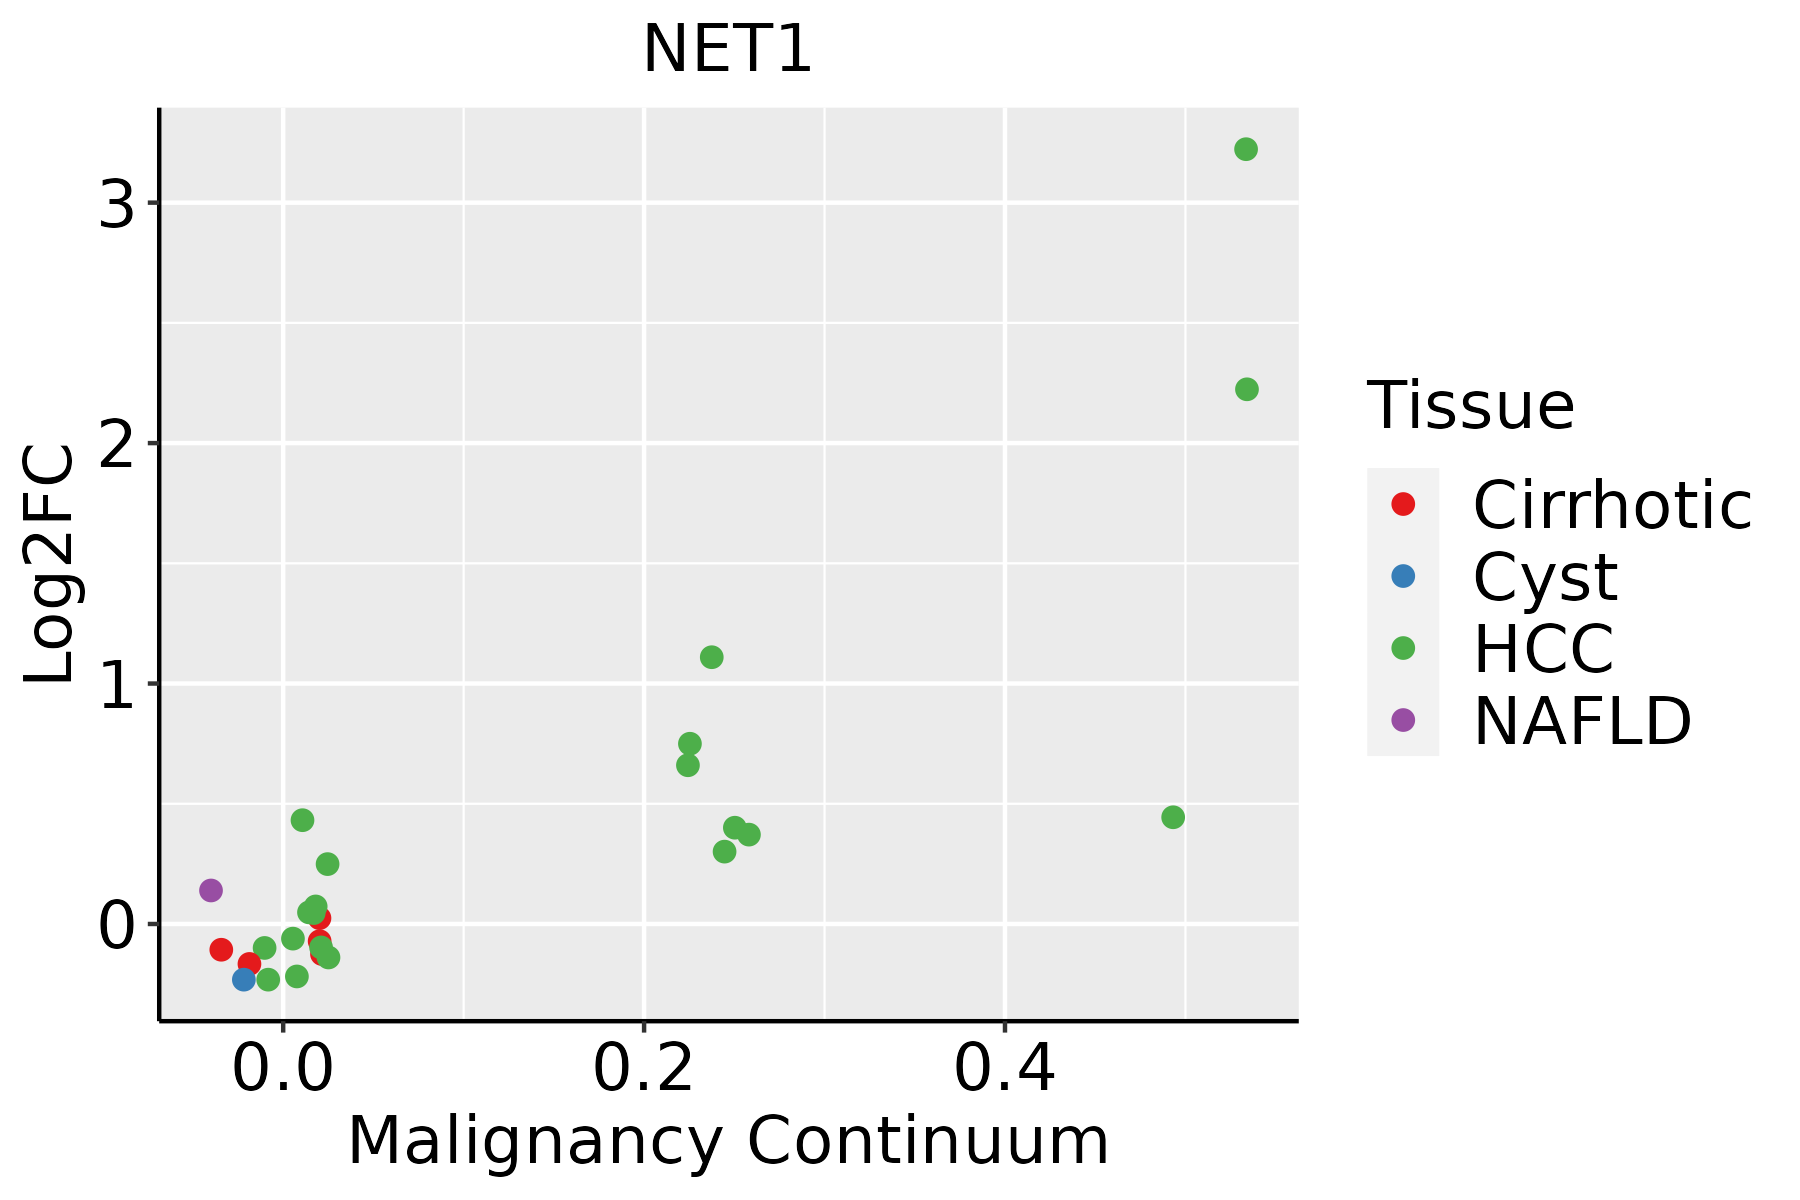 | HCC: Hepatocellular carcinoma |
| NAFLD: Non-alcoholic fatty liver disease | ||
| Oral Cavity |  | EOLP: Erosive Oral lichen planus |
| LP: leukoplakia | ||
| NEOLP: Non-erosive oral lichen planus | ||
| OSCC: Oral squamous cell carcinoma | ||
| Prostate | 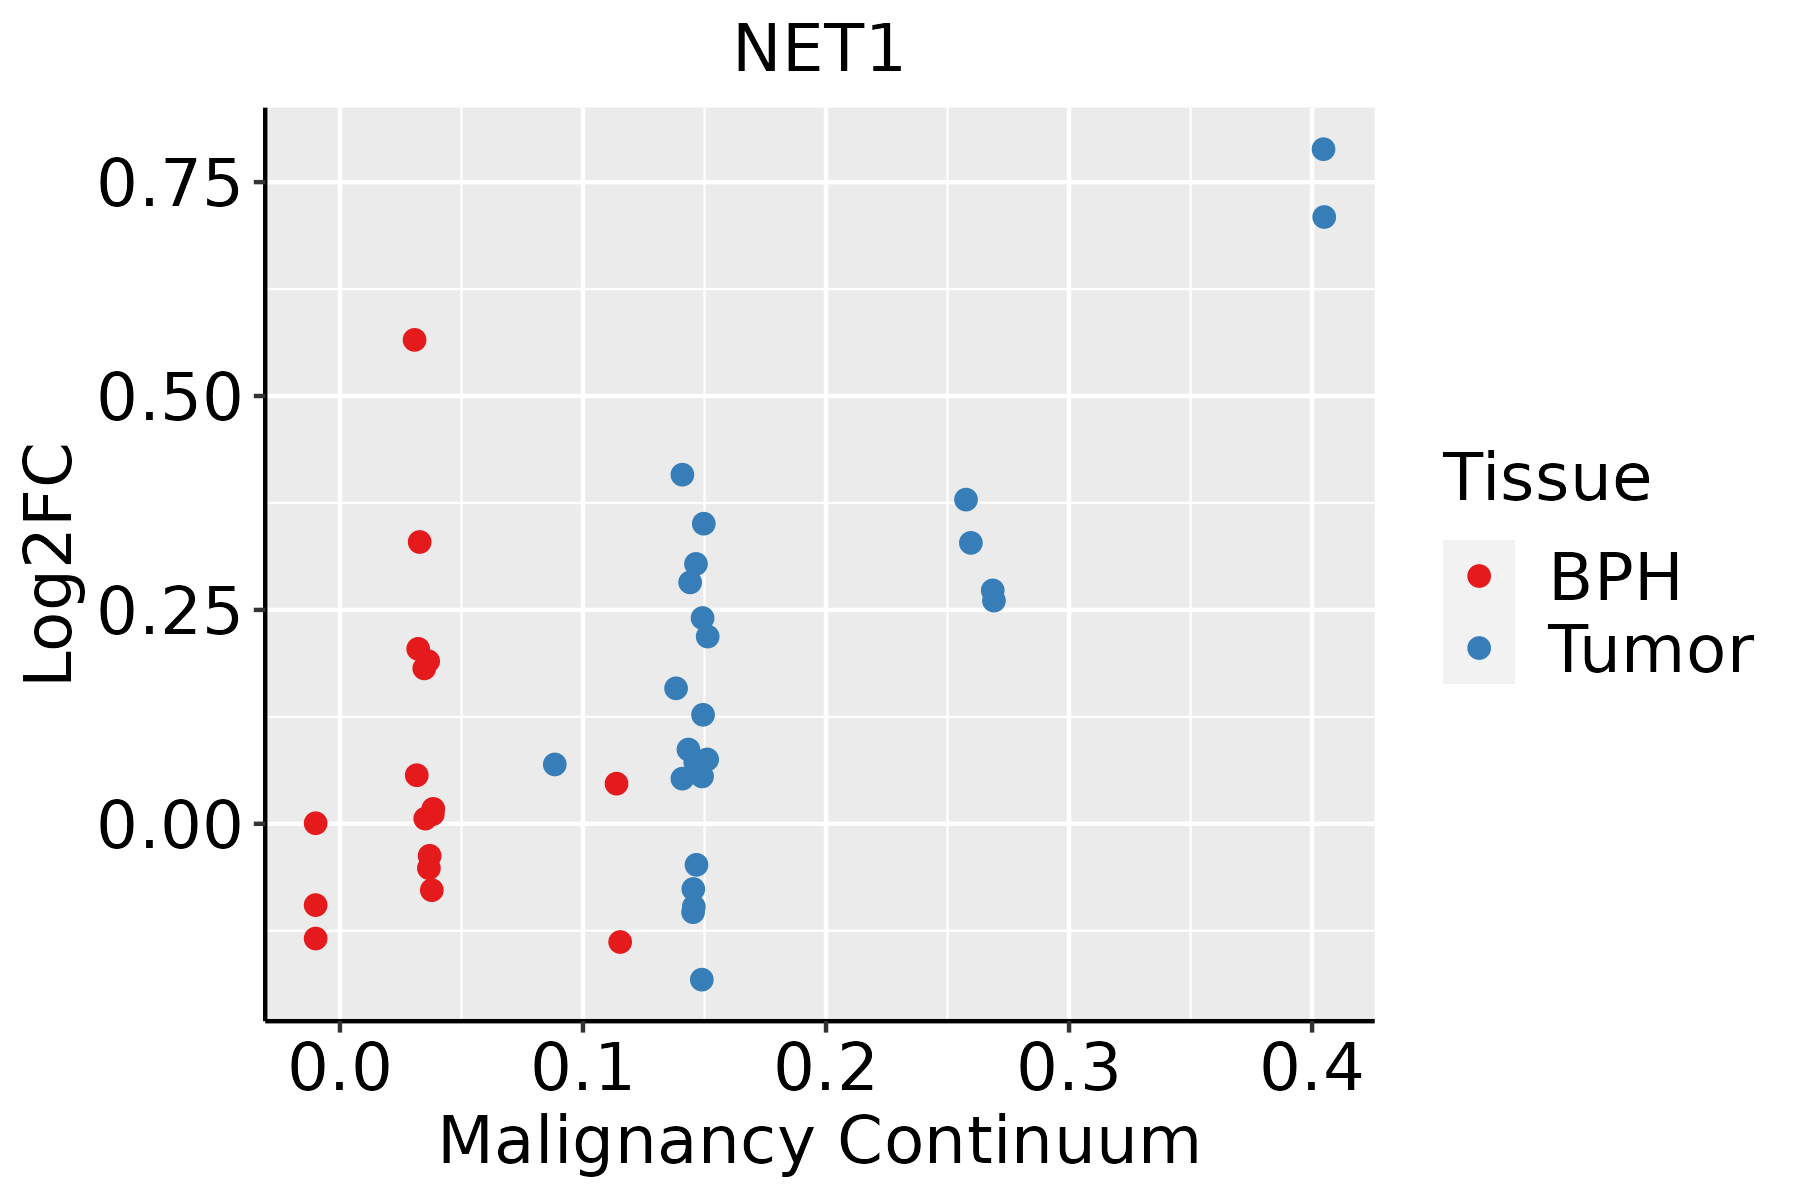 | BPH: Benign Prostatic Hyperplasia |
| Skin | 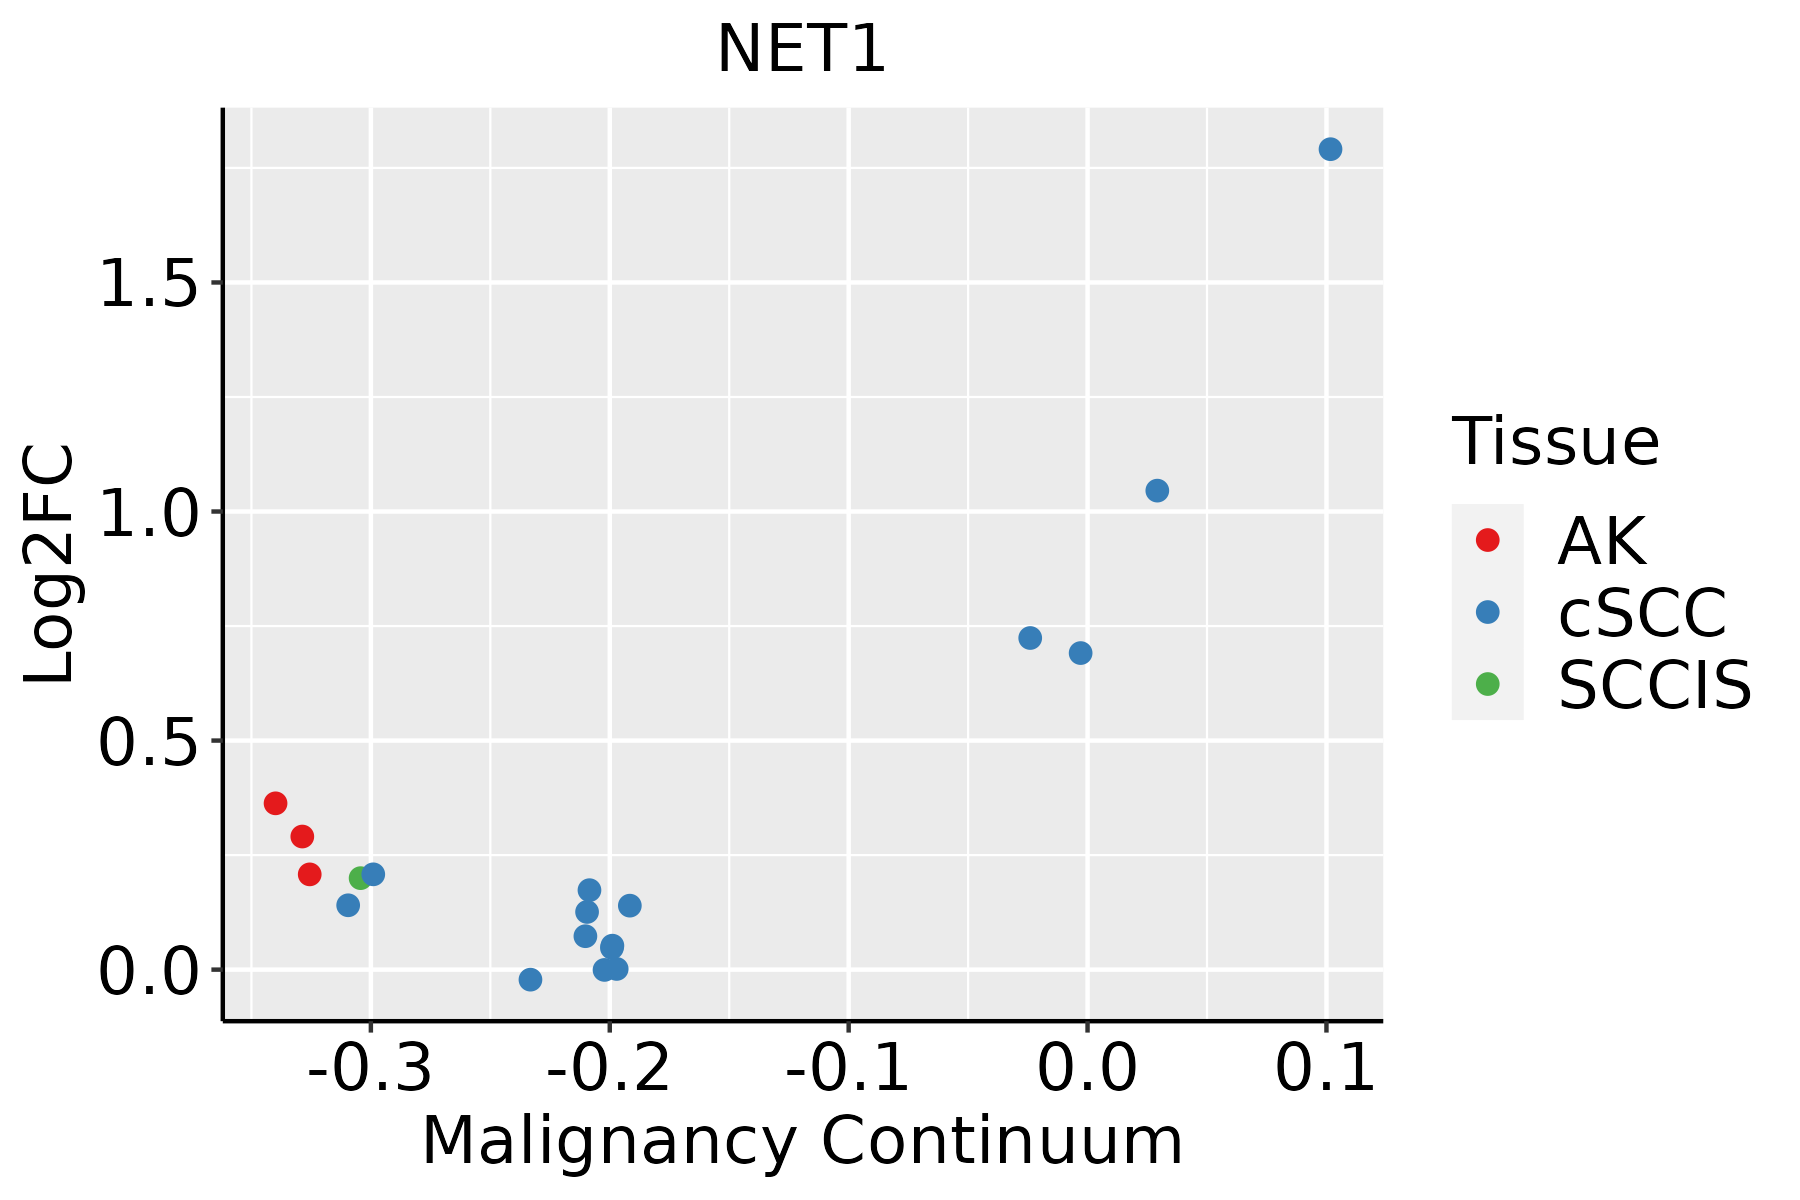 | AK: Actinic keratosis |
| cSCC: Cutaneous squamous cell carcinoma | ||
| SCCIS:squamous cell carcinoma in situ | ||
| Thyroid |  | ATC: Anaplastic thyroid cancer |
| HT: Hashimoto's thyroiditis | ||
| PTC: Papillary thyroid cancer |
| ∗log2FC in expression of this searched gene in stem-like cells from each diseased tissue sample relative to stem-like cells in normal samples in each tissue plotted against the malignancy continuum. Samples are colored based on if they are from different disease stage. |
Top |
Malignant transformation related pathway analysis |
| Find out the enriched GO biological processes and KEGG pathways involved in transition from healthy to precancer to cancer |
| Tissue | Disease Stage | Enriched GO biological Processes |
| Colorectum | AD |  |
| Colorectum | SER |  |
| Colorectum | MSS |  |
| Colorectum | MSI-H |  |
| Colorectum | FAP |  |
| ∗Top 15 enriched GO BP terms are showed in the bar plot of each disease state in each tissue. Each row represents a significant GO biological process which is colored according to the -log10(p.adjust). |
| Page: 1 2 3 4 5 6 7 8 9 |
| GO ID | Tissue | Disease Stage | Description | Gene Ratio | Bg Ratio | pvalue | p.adjust | Count |
| GO:0006979 | Colorectum | AD | response to oxidative stress | 145/3918 | 446/18723 | 5.16e-09 | 3.23e-07 | 145 |
| GO:0062197 | Colorectum | AD | cellular response to chemical stress | 109/3918 | 337/18723 | 5.33e-07 | 1.95e-05 | 109 |
| GO:0000302 | Colorectum | AD | response to reactive oxygen species | 78/3918 | 222/18723 | 6.17e-07 | 2.21e-05 | 78 |
| GO:0043087 | Colorectum | AD | regulation of GTPase activity | 110/3918 | 348/18723 | 1.64e-06 | 5.03e-05 | 110 |
| GO:0034599 | Colorectum | AD | cellular response to oxidative stress | 94/3918 | 288/18723 | 2.03e-06 | 6.02e-05 | 94 |
| GO:0016049 | Colorectum | AD | cell growth | 143/3918 | 482/18723 | 2.83e-06 | 8.09e-05 | 143 |
| GO:0001558 | Colorectum | AD | regulation of cell growth | 124/3918 | 414/18723 | 7.67e-06 | 1.86e-04 | 124 |
| GO:0007265 | Colorectum | AD | Ras protein signal transduction | 104/3918 | 337/18723 | 1.01e-05 | 2.35e-04 | 104 |
| GO:0051056 | Colorectum | AD | regulation of small GTPase mediated signal transduction | 94/3918 | 302/18723 | 1.81e-05 | 3.76e-04 | 94 |
| GO:0042542 | Colorectum | AD | response to hydrogen peroxide | 52/3918 | 146/18723 | 2.83e-05 | 5.30e-04 | 52 |
| GO:0034614 | Colorectum | AD | cellular response to reactive oxygen species | 50/3918 | 155/18723 | 6.25e-04 | 6.49e-03 | 50 |
| GO:0043547 | Colorectum | AD | positive regulation of GTPase activity | 75/3918 | 255/18723 | 7.95e-04 | 7.91e-03 | 75 |
| GO:0046578 | Colorectum | AD | regulation of Ras protein signal transduction | 56/3918 | 189/18723 | 2.85e-03 | 2.14e-02 | 56 |
| GO:0007266 | Colorectum | AD | Rho protein signal transduction | 42/3918 | 137/18723 | 4.64e-03 | 3.16e-02 | 42 |
| GO:00069792 | Colorectum | MSS | response to oxidative stress | 128/3467 | 446/18723 | 7.65e-08 | 3.81e-06 | 128 |
| GO:00621972 | Colorectum | MSS | cellular response to chemical stress | 102/3467 | 337/18723 | 9.73e-08 | 4.71e-06 | 102 |
| GO:00345992 | Colorectum | MSS | cellular response to oxidative stress | 88/3467 | 288/18723 | 4.58e-07 | 1.77e-05 | 88 |
| GO:00430872 | Colorectum | MSS | regulation of GTPase activity | 101/3467 | 348/18723 | 1.00e-06 | 3.46e-05 | 101 |
| GO:00003022 | Colorectum | MSS | response to reactive oxygen species | 67/3467 | 222/18723 | 1.60e-05 | 3.60e-04 | 67 |
| GO:00160492 | Colorectum | MSS | cell growth | 123/3467 | 482/18723 | 7.15e-05 | 1.21e-03 | 123 |
| Page: 1 2 3 4 5 6 7 8 9 10 11 12 13 14 15 16 |
| Pathway ID | Tissue | Disease Stage | Description | Gene Ratio | Bg Ratio | pvalue | p.adjust | qvalue | Count |
| Page: 1 |
Top |
Cell-cell communication analysis |
| Identification of potential cell-cell interactions between two cell types and their ligand-receptor pairs for different disease states |
| Ligand | Receptor | LRpair | Pathway | Tissue | Disease Stage |
| Page: 1 |
Top |
Single-cell gene regulatory network inference analysis |
| Find out the significant the regulons (TFs) and the target genes of each regulon across cell types for different disease states |
| TF | Cell Type | Tissue | Disease Stage | Target Gene | RSS | Regulon Activity |
| ∗The dot plots of a searched regulon are shown for all cell subpopulations in each disease state of each tissue based on the regulon specific score inferred using pySCENIC and by calculating the average expression. |
| Page: 1 |
Top |
Somatic mutation of malignant transformation related genes |
| Annotation of somatic variants for genes involved in malignant transformation |
| Hugo Symbol | Variant Class | Variant Classification | dbSNP RS | HGVSc | HGVSp | HGVSp Short | SWISSPROT | BIOTYPE | SIFT | PolyPhen | Tumor Sample Barcode | Tissue | Histology | Sex | Age | Stage | Therapy Types | Drugs | Outcome |
| NET1 | SNV | Missense_Mutation | novel | c.500N>T | p.Ser167Phe | p.S167F | Q7Z628 | protein_coding | deleterious(0.03) | benign(0.396) | TCGA-A2-A0CR-01 | Breast | breast invasive carcinoma | Female | <65 | I/II | Chemotherapy | adriamycin | CR |
| NET1 | SNV | Missense_Mutation | c.727N>A | p.Asp243Asn | p.D243N | Q7Z628 | protein_coding | tolerated(0.09) | benign(0.015) | TCGA-A2-A0CX-01 | Breast | breast invasive carcinoma | Female | <65 | I/II | Chemotherapy | adriamycin | SD | |
| NET1 | SNV | Missense_Mutation | rs773238555 | c.1081G>A | p.Glu361Lys | p.E361K | Q7Z628 | protein_coding | tolerated(0.19) | benign(0.075) | TCGA-AC-A23H-01 | Breast | breast invasive carcinoma | Female | >=65 | I/II | Unknown | Unknown | PD |
| NET1 | SNV | Missense_Mutation | c.199N>G | p.Arg67Gly | p.R67G | Q7Z628 | protein_coding | deleterious(0) | possibly_damaging(0.528) | TCGA-AN-A0XN-01 | Breast | breast invasive carcinoma | Female | >=65 | III/IV | Unknown | Unknown | SD | |
| NET1 | SNV | Missense_Mutation | c.296N>T | p.Thr99Met | p.T99M | Q7Z628 | protein_coding | deleterious(0) | possibly_damaging(0.879) | TCGA-BH-A0WA-01 | Breast | breast invasive carcinoma | Female | >=65 | I/II | Unknown | Unknown | SD | |
| NET1 | SNV | Missense_Mutation | c.272G>C | p.Arg91Thr | p.R91T | Q7Z628 | protein_coding | deleterious(0) | probably_damaging(0.996) | TCGA-LP-A4AX-01 | Cervix | cervical & endocervical cancer | Female | <65 | I/II | Unknown | Unknown | SD | |
| NET1 | SNV | Missense_Mutation | c.449G>C | p.Arg150Thr | p.R150T | Q7Z628 | protein_coding | deleterious(0) | probably_damaging(0.917) | TCGA-MY-A5BD-01 | Cervix | cervical & endocervical cancer | Female | <65 | I/II | Chemotherapy | cisplatin | CR | |
| NET1 | SNV | Missense_Mutation | c.868N>A | p.Leu290Ile | p.L290I | Q7Z628 | protein_coding | deleterious(0) | probably_damaging(0.993) | TCGA-A6-2686-01 | Colorectum | colon adenocarcinoma | Female | >=65 | I/II | Unknown | Unknown | SD | |
| NET1 | SNV | Missense_Mutation | c.1038N>G | p.Ile346Met | p.I346M | Q7Z628 | protein_coding | deleterious(0.01) | possibly_damaging(0.487) | TCGA-A6-A565-01 | Colorectum | colon adenocarcinoma | Female | <65 | III/IV | Unspecific | 5FU | PD | |
| NET1 | SNV | Missense_Mutation | c.1019N>G | p.Glu340Gly | p.E340G | Q7Z628 | protein_coding | deleterious(0.04) | benign(0.073) | TCGA-AA-3663-01 | Colorectum | colon adenocarcinoma | Male | <65 | I/II | Unknown | Unknown | SD |
| Page: 1 2 3 4 5 6 |
Top |
Related drugs of malignant transformation related genes |
| Identification of chemicals and drugs interact with genes involved in malignant transfromation |
| (DGIdb 4.0) |
| Entrez ID | Symbol | Category | Interaction Types | Drug Claim Name | Drug Name | PMIDs |
| Page: 1 |

Copyright 2023-Present -The University of Texas Health Science Center at Houston |