
|
|||||
|
 | |
| |
| |
| |
| |
| |
|
Gene: NEO1 |
Gene summary for NEO1 |
| Gene information | Species | Human | Gene symbol | NEO1 | Gene ID | 4756 |
| Gene name | neogenin 1 | |
| Gene Alias | IGDCC2 | |
| Cytomap | 15q24.1 | |
| Gene Type | protein-coding | GO ID | GO:0000902 | UniProtAcc | Q59FP8 |
Top |
Malignant transformation analysis |
| Identification of the aberrant gene expression in precancerous and cancerous lesions by comparing the gene expression of stem-like cells in diseased tissues with normal stem cells |
| Entrez ID | Symbol | Replicates | Species | Organ | Tissue | Adj P-value | Log2FC | Malignancy |
| 4756 | NEO1 | HTA11_3410_2000001011 | Human | Colorectum | AD | 5.52e-60 | -9.82e-01 | 0.0155 |
| 4756 | NEO1 | HTA11_2487_2000001011 | Human | Colorectum | SER | 1.04e-13 | -6.72e-01 | -0.1808 |
| 4756 | NEO1 | HTA11_2951_2000001011 | Human | Colorectum | AD | 2.51e-16 | -1.04e+00 | 0.0216 |
| 4756 | NEO1 | HTA11_1938_2000001011 | Human | Colorectum | AD | 1.05e-31 | -1.32e+00 | -0.0811 |
| 4756 | NEO1 | HTA11_347_2000001011 | Human | Colorectum | AD | 2.95e-08 | 5.47e-01 | -0.1954 |
| 4756 | NEO1 | HTA11_3361_2000001011 | Human | Colorectum | AD | 4.22e-19 | -7.83e-01 | -0.1207 |
| 4756 | NEO1 | HTA11_1391_2000001011 | Human | Colorectum | AD | 2.33e-48 | -1.09e+00 | -0.059 |
| 4756 | NEO1 | HTA11_5212_2000001011 | Human | Colorectum | AD | 4.28e-03 | -3.52e-01 | -0.2061 |
| 4756 | NEO1 | HTA11_5216_2000001011 | Human | Colorectum | SER | 1.38e-07 | -6.85e-01 | -0.1462 |
| 4756 | NEO1 | HTA11_9341_2000001011 | Human | Colorectum | SER | 2.18e-02 | -6.49e-01 | -0.00410000000000005 |
| 4756 | NEO1 | HTA11_866_3004761011 | Human | Colorectum | AD | 1.41e-13 | -6.17e-01 | 0.096 |
| 4756 | NEO1 | HTA11_4255_2000001011 | Human | Colorectum | SER | 2.83e-05 | -5.44e-01 | 0.0446 |
| 4756 | NEO1 | HTA11_9408_2000001011 | Human | Colorectum | AD | 1.37e-10 | -1.08e+00 | 0.0451 |
| 4756 | NEO1 | HTA11_8622_2000001021 | Human | Colorectum | SER | 2.24e-06 | -6.92e-01 | 0.0528 |
| 4756 | NEO1 | HTA11_10711_2000001011 | Human | Colorectum | AD | 6.15e-23 | -9.75e-01 | 0.0338 |
| 4756 | NEO1 | HTA11_7696_3000711011 | Human | Colorectum | AD | 1.06e-88 | -1.28e+00 | 0.0674 |
| 4756 | NEO1 | HTA11_6818_2000001011 | Human | Colorectum | AD | 4.14e-07 | -5.67e-01 | 0.0112 |
| 4756 | NEO1 | HTA11_11156_2000001011 | Human | Colorectum | AD | 4.72e-03 | -5.78e-01 | 0.0397 |
| 4756 | NEO1 | HTA11_6818_2000001021 | Human | Colorectum | AD | 3.36e-31 | -1.11e+00 | 0.0588 |
| 4756 | NEO1 | HTA11_99999970781_79442 | Human | Colorectum | MSS | 4.13e-35 | -7.66e-01 | 0.294 |
| Page: 1 2 3 4 5 6 7 8 |
| Tissue | Expression Dynamics | Abbreviation |
| Colorectum (GSE201348) | 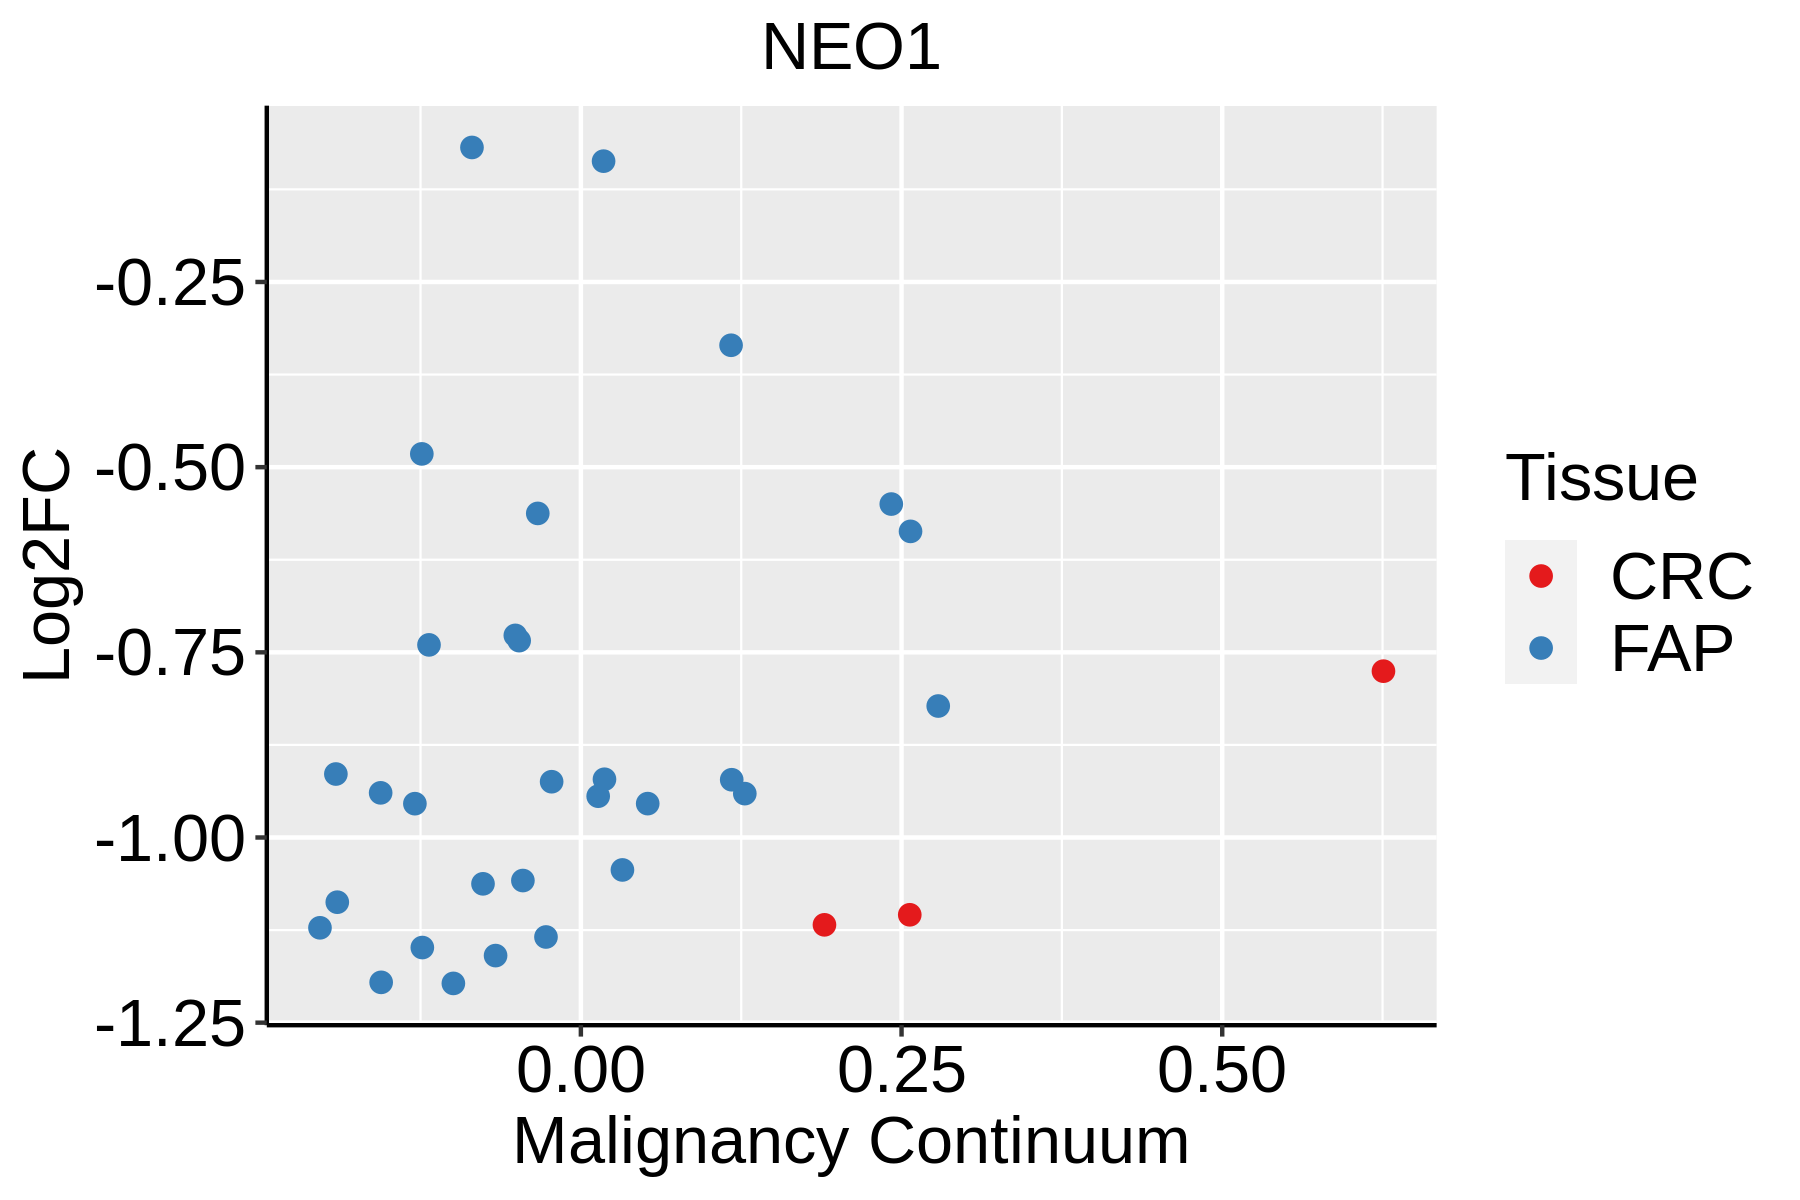 | FAP: Familial adenomatous polyposis |
| CRC: Colorectal cancer | ||
| Colorectum (HTA11) |  | AD: Adenomas |
| SER: Sessile serrated lesions | ||
| MSI-H: Microsatellite-high colorectal cancer | ||
| MSS: Microsatellite stable colorectal cancer | ||
| Endometrium |  | AEH: Atypical endometrial hyperplasia |
| EEC: Endometrioid Cancer | ||
| Esophagus | 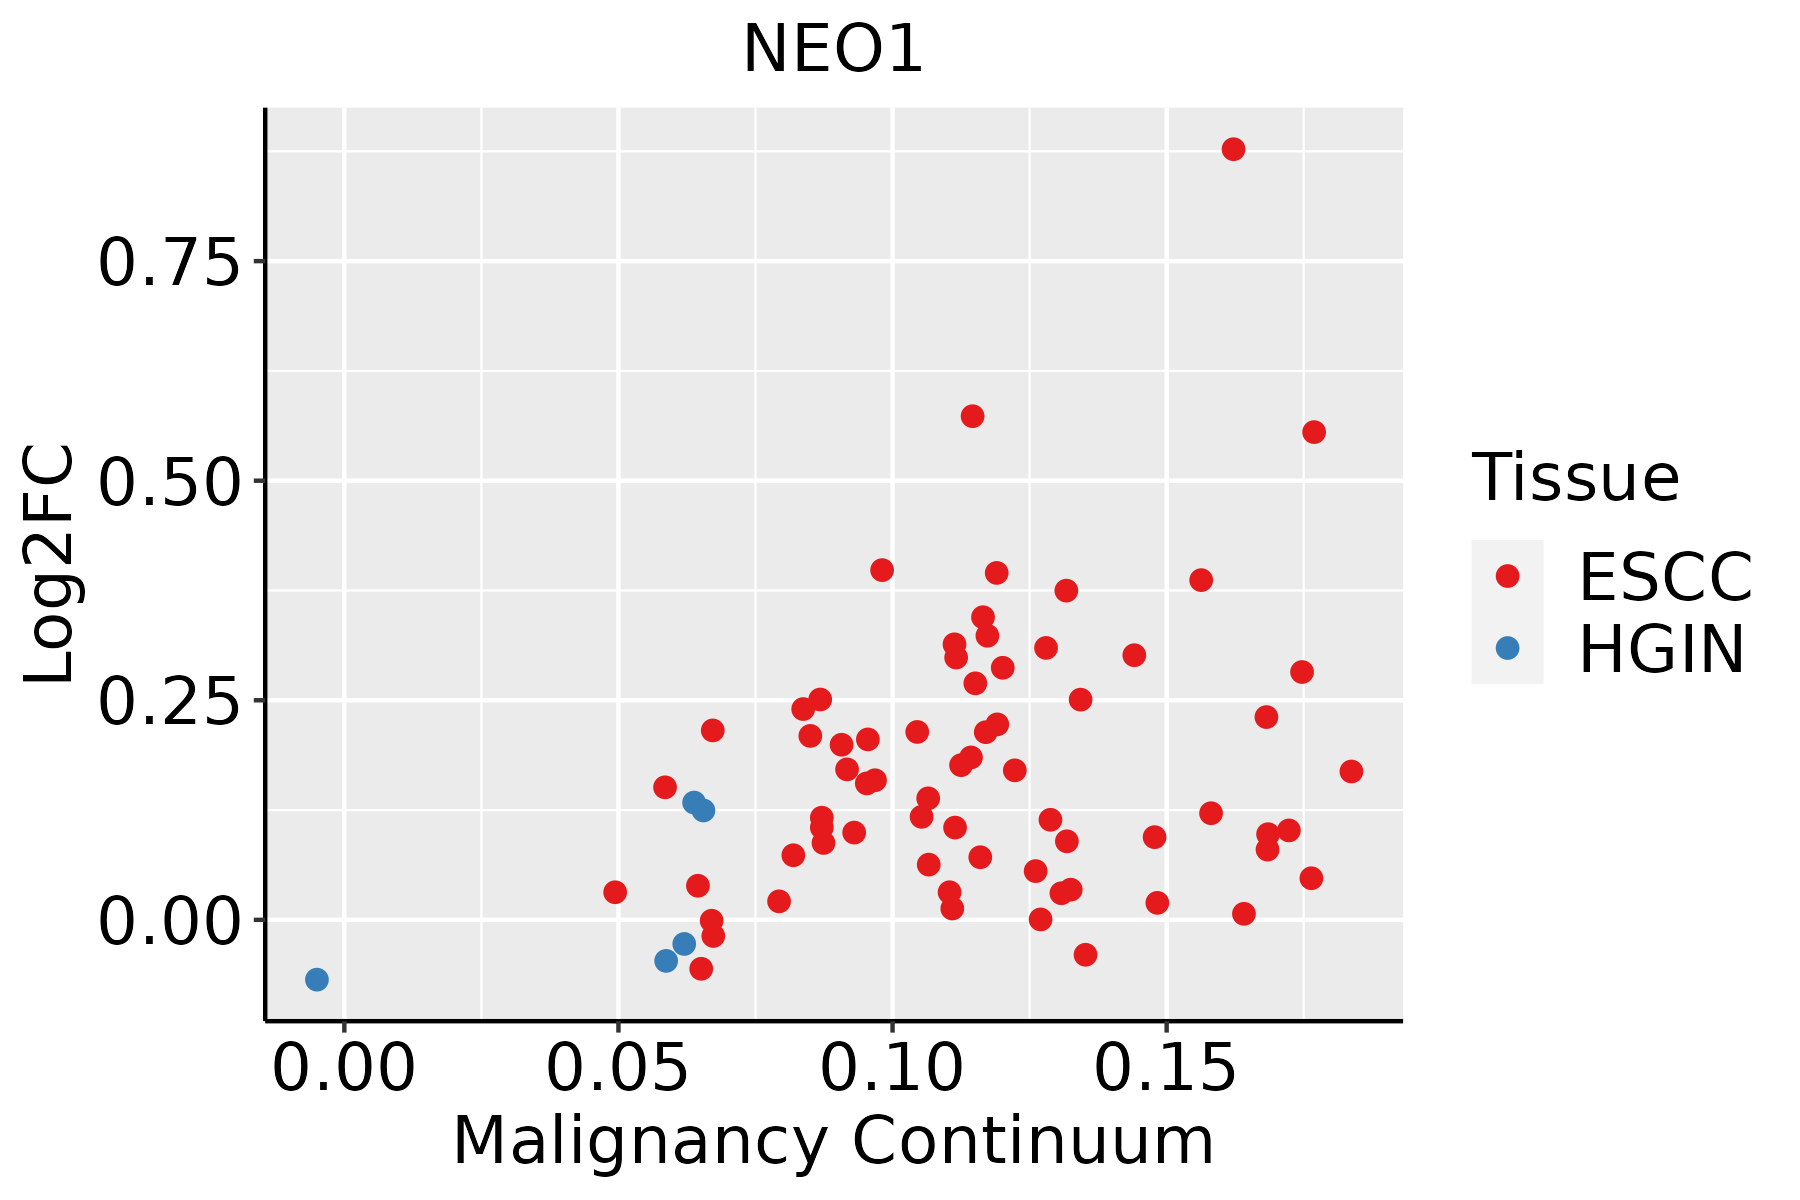 | ESCC: Esophageal squamous cell carcinoma |
| HGIN: High-grade intraepithelial neoplasias | ||
| LGIN: Low-grade intraepithelial neoplasias | ||
| Prostate |  | BPH: Benign Prostatic Hyperplasia |
| Thyroid | 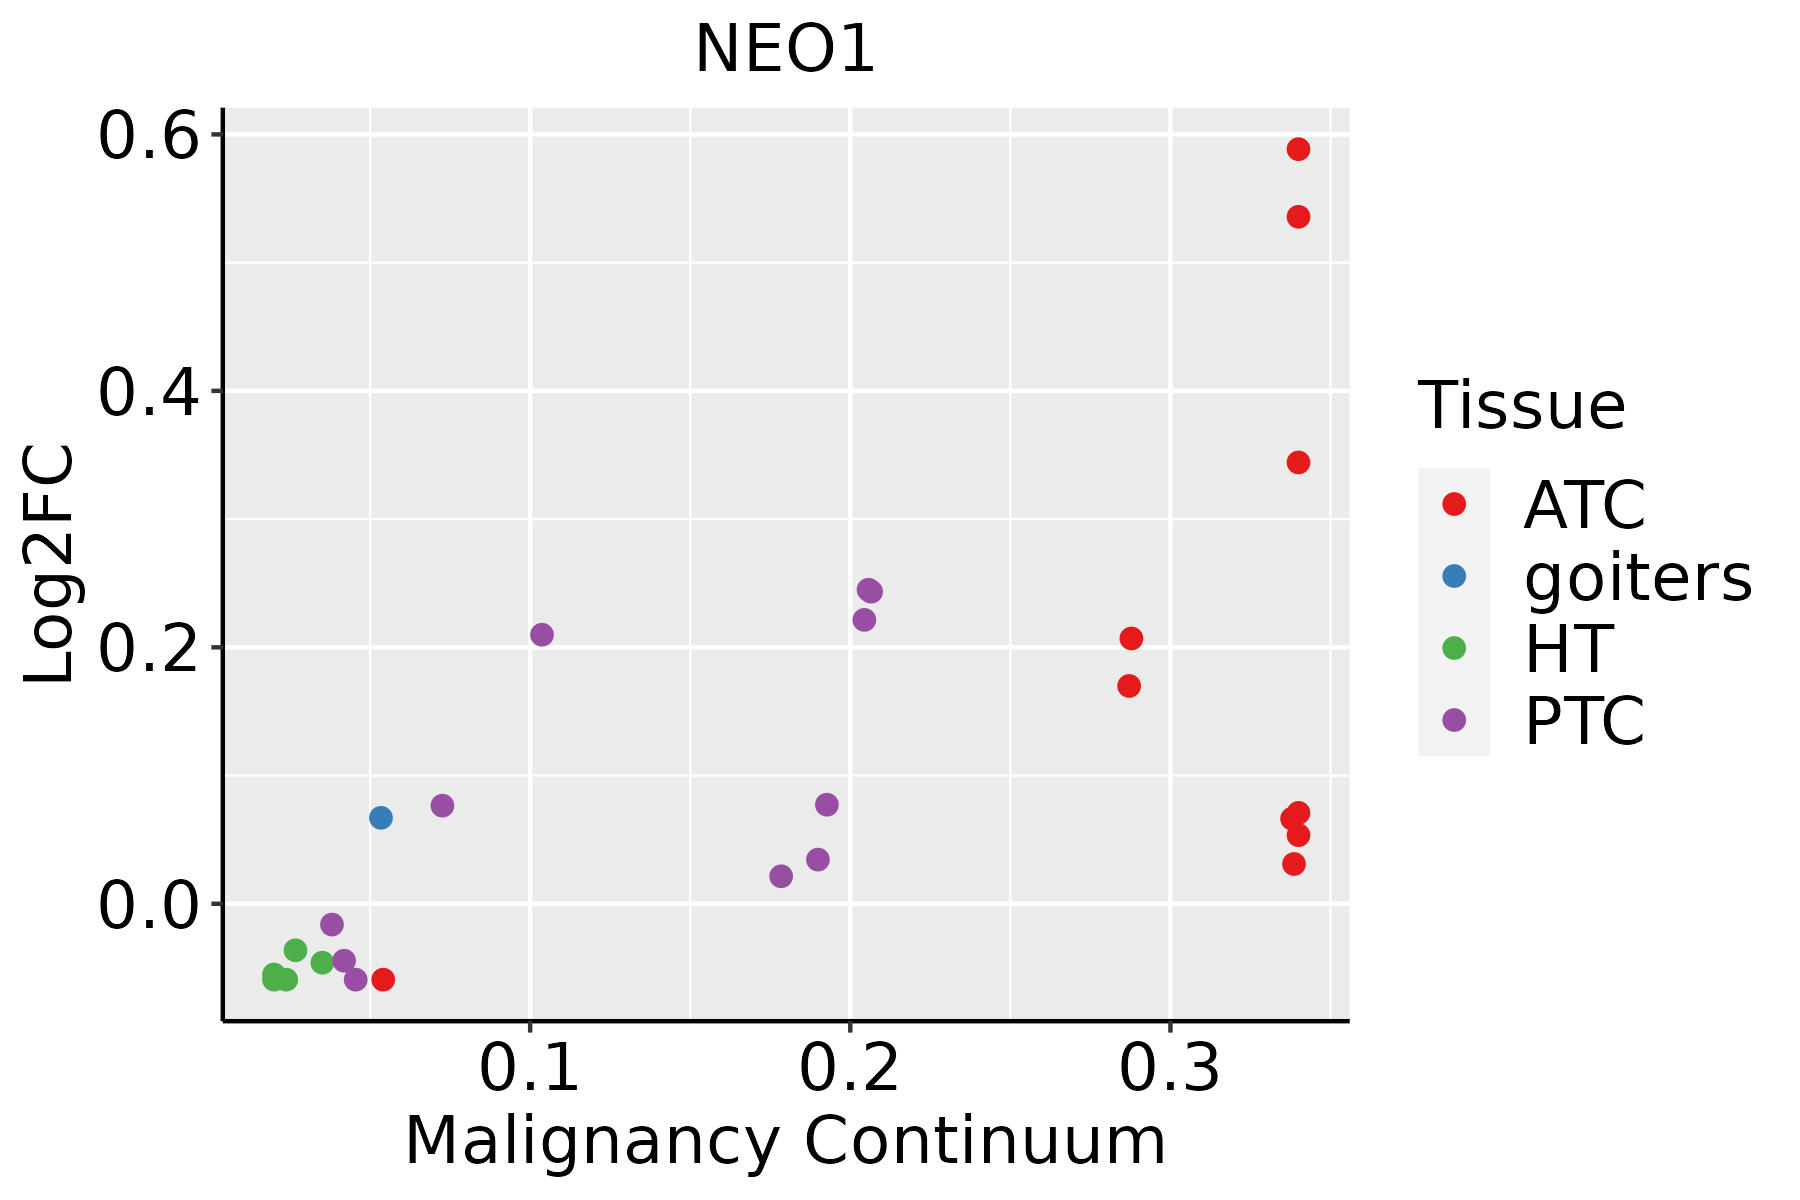 | ATC: Anaplastic thyroid cancer |
| HT: Hashimoto's thyroiditis | ||
| PTC: Papillary thyroid cancer |
| ∗log2FC in expression of this searched gene in stem-like cells from each diseased tissue sample relative to stem-like cells in normal samples in each tissue plotted against the malignancy continuum. Samples are colored based on if they are from different disease stage. |
Top |
Malignant transformation related pathway analysis |
| Find out the enriched GO biological processes and KEGG pathways involved in transition from healthy to precancer to cancer |
| Tissue | Disease Stage | Enriched GO biological Processes |
| Colorectum | AD |  |
| Colorectum | SER |  |
| Colorectum | MSS |  |
| Colorectum | MSI-H |  |
| Colorectum | FAP |  |
| ∗Top 15 enriched GO BP terms are showed in the bar plot of each disease state in each tissue. Each row represents a significant GO biological process which is colored according to the -log10(p.adjust). |
| Page: 1 2 3 4 5 6 7 8 9 |
| GO ID | Tissue | Disease Stage | Description | Gene Ratio | Bg Ratio | pvalue | p.adjust | Count |
| GO:0055076 | Colorectum | AD | transition metal ion homeostasis | 53/3918 | 138/18723 | 1.89e-06 | 5.65e-05 | 53 |
| GO:0007409 | Colorectum | AD | axonogenesis | 122/3918 | 418/18723 | 3.36e-05 | 6.15e-04 | 122 |
| GO:0061564 | Colorectum | AD | axon development | 132/3918 | 467/18723 | 8.40e-05 | 1.31e-03 | 132 |
| GO:0055072 | Colorectum | AD | iron ion homeostasis | 32/3918 | 85/18723 | 2.97e-04 | 3.60e-03 | 32 |
| GO:0007178 | Colorectum | AD | transmembrane receptor protein serine/threonine kinase signaling pathway | 99/3918 | 355/18723 | 9.92e-04 | 9.28e-03 | 99 |
| GO:0007411 | Colorectum | AD | axon guidance | 64/3918 | 227/18723 | 5.41e-03 | 3.55e-02 | 64 |
| GO:0097485 | Colorectum | AD | neuron projection guidance | 64/3918 | 228/18723 | 6.02e-03 | 3.78e-02 | 64 |
| GO:00550761 | Colorectum | SER | transition metal ion homeostasis | 41/2897 | 138/18723 | 1.66e-05 | 5.05e-04 | 41 |
| GO:00550721 | Colorectum | SER | iron ion homeostasis | 24/2897 | 85/18723 | 1.91e-03 | 1.93e-02 | 24 |
| GO:00074111 | Colorectum | SER | axon guidance | 51/2897 | 227/18723 | 3.29e-03 | 2.82e-02 | 51 |
| GO:00974851 | Colorectum | SER | neuron projection guidance | 51/2897 | 228/18723 | 3.61e-03 | 3.03e-02 | 51 |
| GO:00615641 | Colorectum | SER | axon development | 94/2897 | 467/18723 | 3.78e-03 | 3.13e-02 | 94 |
| GO:00074091 | Colorectum | SER | axonogenesis | 84/2897 | 418/18723 | 6.20e-03 | 4.49e-02 | 84 |
| GO:00550762 | Colorectum | MSS | transition metal ion homeostasis | 45/3467 | 138/18723 | 4.99e-05 | 9.02e-04 | 45 |
| GO:00074092 | Colorectum | MSS | axonogenesis | 105/3467 | 418/18723 | 4.32e-04 | 5.23e-03 | 105 |
| GO:00550722 | Colorectum | MSS | iron ion homeostasis | 29/3467 | 85/18723 | 4.44e-04 | 5.32e-03 | 29 |
| GO:00615642 | Colorectum | MSS | axon development | 115/3467 | 467/18723 | 5.33e-04 | 6.00e-03 | 115 |
| GO:00071781 | Colorectum | MSS | transmembrane receptor protein serine/threonine kinase signaling pathway | 86/3467 | 355/18723 | 4.04e-03 | 2.95e-02 | 86 |
| GO:00615643 | Colorectum | FAP | axon development | 106/2622 | 467/18723 | 1.98e-07 | 1.21e-05 | 106 |
| GO:00074093 | Colorectum | FAP | axonogenesis | 97/2622 | 418/18723 | 2.20e-07 | 1.30e-05 | 97 |
| Page: 1 2 3 4 5 |
| Pathway ID | Tissue | Disease Stage | Description | Gene Ratio | Bg Ratio | pvalue | p.adjust | qvalue | Count |
| hsa04360 | Colorectum | AD | Axon guidance | 61/2092 | 182/8465 | 4.36e-03 | 2.17e-02 | 1.38e-02 | 61 |
| hsa043601 | Colorectum | AD | Axon guidance | 61/2092 | 182/8465 | 4.36e-03 | 2.17e-02 | 1.38e-02 | 61 |
| hsa04350 | Colorectum | SER | TGF-beta signaling pathway | 31/1580 | 108/8465 | 7.00e-03 | 3.77e-02 | 2.74e-02 | 31 |
| hsa043501 | Colorectum | SER | TGF-beta signaling pathway | 31/1580 | 108/8465 | 7.00e-03 | 3.77e-02 | 2.74e-02 | 31 |
| hsa043602 | Colorectum | MSS | Axon guidance | 54/1875 | 182/8465 | 1.03e-02 | 3.69e-02 | 2.26e-02 | 54 |
| hsa043603 | Colorectum | MSS | Axon guidance | 54/1875 | 182/8465 | 1.03e-02 | 3.69e-02 | 2.26e-02 | 54 |
| hsa043604 | Colorectum | FAP | Axon guidance | 47/1404 | 182/8465 | 9.09e-04 | 5.20e-03 | 3.16e-03 | 47 |
| hsa043605 | Colorectum | FAP | Axon guidance | 47/1404 | 182/8465 | 9.09e-04 | 5.20e-03 | 3.16e-03 | 47 |
| hsa043606 | Colorectum | CRC | Axon guidance | 43/1091 | 182/8465 | 4.38e-05 | 8.70e-04 | 5.90e-04 | 43 |
| hsa043607 | Colorectum | CRC | Axon guidance | 43/1091 | 182/8465 | 4.38e-05 | 8.70e-04 | 5.90e-04 | 43 |
| hsa043504 | Endometrium | AEH | TGF-beta signaling pathway | 26/1197 | 108/8465 | 3.82e-03 | 2.18e-02 | 1.59e-02 | 26 |
| hsa0436010 | Endometrium | AEH | Axon guidance | 39/1197 | 182/8465 | 4.47e-03 | 2.46e-02 | 1.80e-02 | 39 |
| hsa0435011 | Endometrium | AEH | TGF-beta signaling pathway | 26/1197 | 108/8465 | 3.82e-03 | 2.18e-02 | 1.59e-02 | 26 |
| hsa0436013 | Endometrium | AEH | Axon guidance | 39/1197 | 182/8465 | 4.47e-03 | 2.46e-02 | 1.80e-02 | 39 |
| hsa043502 | Endometrium | EEC | TGF-beta signaling pathway | 26/1237 | 108/8465 | 5.95e-03 | 3.12e-02 | 2.33e-02 | 26 |
| hsa0436022 | Endometrium | EEC | Axon guidance | 39/1237 | 182/8465 | 7.78e-03 | 3.66e-02 | 2.73e-02 | 39 |
| hsa043503 | Endometrium | EEC | TGF-beta signaling pathway | 26/1237 | 108/8465 | 5.95e-03 | 3.12e-02 | 2.33e-02 | 26 |
| hsa0436032 | Endometrium | EEC | Axon guidance | 39/1237 | 182/8465 | 7.78e-03 | 3.66e-02 | 2.73e-02 | 39 |
| hsa043507 | Esophagus | ESCC | TGF-beta signaling pathway | 69/4205 | 108/8465 | 1.92e-03 | 5.54e-03 | 2.84e-03 | 69 |
| hsa0436016 | Esophagus | ESCC | Axon guidance | 108/4205 | 182/8465 | 5.13e-03 | 1.30e-02 | 6.67e-03 | 108 |
| Page: 1 2 |
Top |
Cell-cell communication analysis |
| Identification of potential cell-cell interactions between two cell types and their ligand-receptor pairs for different disease states |
| Ligand | Receptor | LRpair | Pathway | Tissue | Disease Stage |
| Page: 1 |
Top |
Single-cell gene regulatory network inference analysis |
| Find out the significant the regulons (TFs) and the target genes of each regulon across cell types for different disease states |
| TF | Cell Type | Tissue | Disease Stage | Target Gene | RSS | Regulon Activity |
| ∗The dot plots of a searched regulon are shown for all cell subpopulations in each disease state of each tissue based on the regulon specific score inferred using pySCENIC and by calculating the average expression. |
| Page: 1 |
Top |
Somatic mutation of malignant transformation related genes |
| Annotation of somatic variants for genes involved in malignant transformation |
| Hugo Symbol | Variant Class | Variant Classification | dbSNP RS | HGVSc | HGVSp | HGVSp Short | SWISSPROT | BIOTYPE | SIFT | PolyPhen | Tumor Sample Barcode | Tissue | Histology | Sex | Age | Stage | Therapy Types | Drugs | Outcome |
| NEO1 | SNV | Missense_Mutation | c.2509N>A | p.Asp837Asn | p.D837N | Q92859 | protein_coding | deleterious(0) | probably_damaging(0.991) | TCGA-AR-A0TX-01 | Breast | breast invasive carcinoma | Female | <65 | I/II | Unknown | Unknown | SD | |
| NEO1 | SNV | Missense_Mutation | c.979N>A | p.Glu327Lys | p.E327K | Q92859 | protein_coding | tolerated(0.2) | benign(0.007) | TCGA-BH-A18P-01 | Breast | breast invasive carcinoma | Female | <65 | I/II | Unknown | Unknown | PD | |
| NEO1 | SNV | Missense_Mutation | c.1000N>C | p.Glu334Gln | p.E334Q | Q92859 | protein_coding | tolerated(0.3) | benign(0.079) | TCGA-C8-A27B-01 | Breast | breast invasive carcinoma | Female | <65 | I/II | Chemotherapy | 5-fluorouracil | CR | |
| NEO1 | SNV | Missense_Mutation | c.412A>C | p.Thr138Pro | p.T138P | Q92859 | protein_coding | deleterious(0.04) | possibly_damaging(0.826) | TCGA-E2-A14W-01 | Breast | breast invasive carcinoma | Male | >=65 | I/II | Chemotherapy | cytoxan | SD | |
| NEO1 | deletion | Frame_Shift_Del | novel | c.4196delN | p.Thr1399LysfsTer7 | p.T1399Kfs*7 | Q92859 | protein_coding | TCGA-EW-A2FV-01 | Breast | breast invasive carcinoma | Female | <65 | III/IV | Chemotherapy | docetaxel | SD | ||
| NEO1 | SNV | Missense_Mutation | novel | c.3699G>A | p.Met1233Ile | p.M1233I | Q92859 | protein_coding | tolerated(0.11) | benign(0.316) | TCGA-C5-A1BQ-01 | Cervix | cervical & endocervical cancer | Female | >=65 | III/IV | Chemotherapy | cisplatin | CR |
| NEO1 | SNV | Missense_Mutation | c.2834C>T | p.Ala945Val | p.A945V | Q92859 | protein_coding | tolerated(0.2) | possibly_damaging(0.528) | TCGA-DR-A0ZM-01 | Cervix | cervical & endocervical cancer | Female | <65 | III/IV | Unspecific | Cisplatin | SD | |
| NEO1 | SNV | Missense_Mutation | rs142333707 | c.1373N>T | p.Thr458Met | p.T458M | Q92859 | protein_coding | deleterious(0.03) | possibly_damaging(0.872) | TCGA-EA-A3HS-01 | Cervix | cervical & endocervical cancer | Female | <65 | I/II | Unknown | Unknown | SD |
| NEO1 | SNV | Missense_Mutation | c.400N>A | p.Glu134Lys | p.E134K | Q92859 | protein_coding | tolerated(0.1) | benign(0.201) | TCGA-IR-A3LK-01 | Cervix | cervical & endocervical cancer | Female | >=65 | I/II | Chemotherapy | cisplatin | PD | |
| NEO1 | SNV | Missense_Mutation | c.191N>T | p.Ser64Leu | p.S64L | Q92859 | protein_coding | deleterious(0.04) | benign(0.102) | TCGA-JX-A3Q0-01 | Cervix | cervical & endocervical cancer | Female | <65 | III/IV | Unknown | Unknown | SD |
| Page: 1 2 3 4 5 6 7 8 9 10 11 12 13 14 |
Top |
Related drugs of malignant transformation related genes |
| Identification of chemicals and drugs interact with genes involved in malignant transfromation |
| (DGIdb 4.0) |
| Entrez ID | Symbol | Category | Interaction Types | Drug Claim Name | Drug Name | PMIDs |
| Page: 1 |

Copyright 2023-Present -The University of Texas Health Science Center at Houston |