
|
|||||
|
 | |
| |
| |
| |
| |
| |
|
Gene: NENF |
Gene summary for NENF |
| Gene information | Species | Human | Gene symbol | NENF | Gene ID | 29937 |
| Gene name | neudesin neurotrophic factor | |
| Gene Alias | CIR2 | |
| Cytomap | 1q32.3 | |
| Gene Type | protein-coding | GO ID | GO:0000165 | UniProtAcc | Q9UMX5 |
Top |
Malignant transformation analysis |
| Identification of the aberrant gene expression in precancerous and cancerous lesions by comparing the gene expression of stem-like cells in diseased tissues with normal stem cells |
| Entrez ID | Symbol | Replicates | Species | Organ | Tissue | Adj P-value | Log2FC | Malignancy |
| 29937 | NENF | GSM4909282 | Human | Breast | IDC | 3.33e-07 | 3.64e-01 | -0.0288 |
| 29937 | NENF | GSM4909293 | Human | Breast | IDC | 5.82e-06 | 3.22e-01 | 0.1581 |
| 29937 | NENF | GSM4909294 | Human | Breast | IDC | 5.72e-08 | -3.39e-01 | 0.2022 |
| 29937 | NENF | GSM4909296 | Human | Breast | IDC | 1.05e-32 | -6.01e-01 | 0.1524 |
| 29937 | NENF | GSM4909297 | Human | Breast | IDC | 1.87e-19 | -4.33e-01 | 0.1517 |
| 29937 | NENF | GSM4909301 | Human | Breast | IDC | 5.76e-04 | -2.90e-01 | 0.1577 |
| 29937 | NENF | GSM4909302 | Human | Breast | IDC | 1.09e-05 | 2.75e-01 | 0.1545 |
| 29937 | NENF | GSM4909306 | Human | Breast | IDC | 2.27e-31 | 6.50e-01 | 0.1564 |
| 29937 | NENF | GSM4909308 | Human | Breast | IDC | 1.30e-04 | 2.88e-01 | 0.158 |
| 29937 | NENF | GSM4909311 | Human | Breast | IDC | 1.11e-43 | -4.78e-01 | 0.1534 |
| 29937 | NENF | GSM4909312 | Human | Breast | IDC | 3.61e-21 | -4.35e-01 | 0.1552 |
| 29937 | NENF | GSM4909313 | Human | Breast | IDC | 8.68e-04 | 3.51e-02 | 0.0391 |
| 29937 | NENF | GSM4909319 | Human | Breast | IDC | 1.36e-56 | -6.75e-02 | 0.1563 |
| 29937 | NENF | GSM4909320 | Human | Breast | IDC | 1.22e-09 | 3.30e-01 | 0.1575 |
| 29937 | NENF | GSM4909321 | Human | Breast | IDC | 4.78e-29 | 3.78e-01 | 0.1559 |
| 29937 | NENF | brca2 | Human | Breast | Precancer | 5.34e-03 | 3.33e-02 | -0.024 |
| 29937 | NENF | M2 | Human | Breast | IDC | 1.23e-02 | -4.29e-02 | 0.21 |
| 29937 | NENF | NCCBC14 | Human | Breast | DCIS | 1.74e-11 | -1.86e-01 | 0.2021 |
| 29937 | NENF | NCCBC2 | Human | Breast | DCIS | 5.21e-04 | -4.42e-01 | 0.1554 |
| 29937 | NENF | NCCBC3 | Human | Breast | DCIS | 1.87e-03 | -1.13e-01 | 0.1198 |
| Page: 1 2 3 4 5 6 7 8 9 10 11 |
| Tissue | Expression Dynamics | Abbreviation |
| Breast | 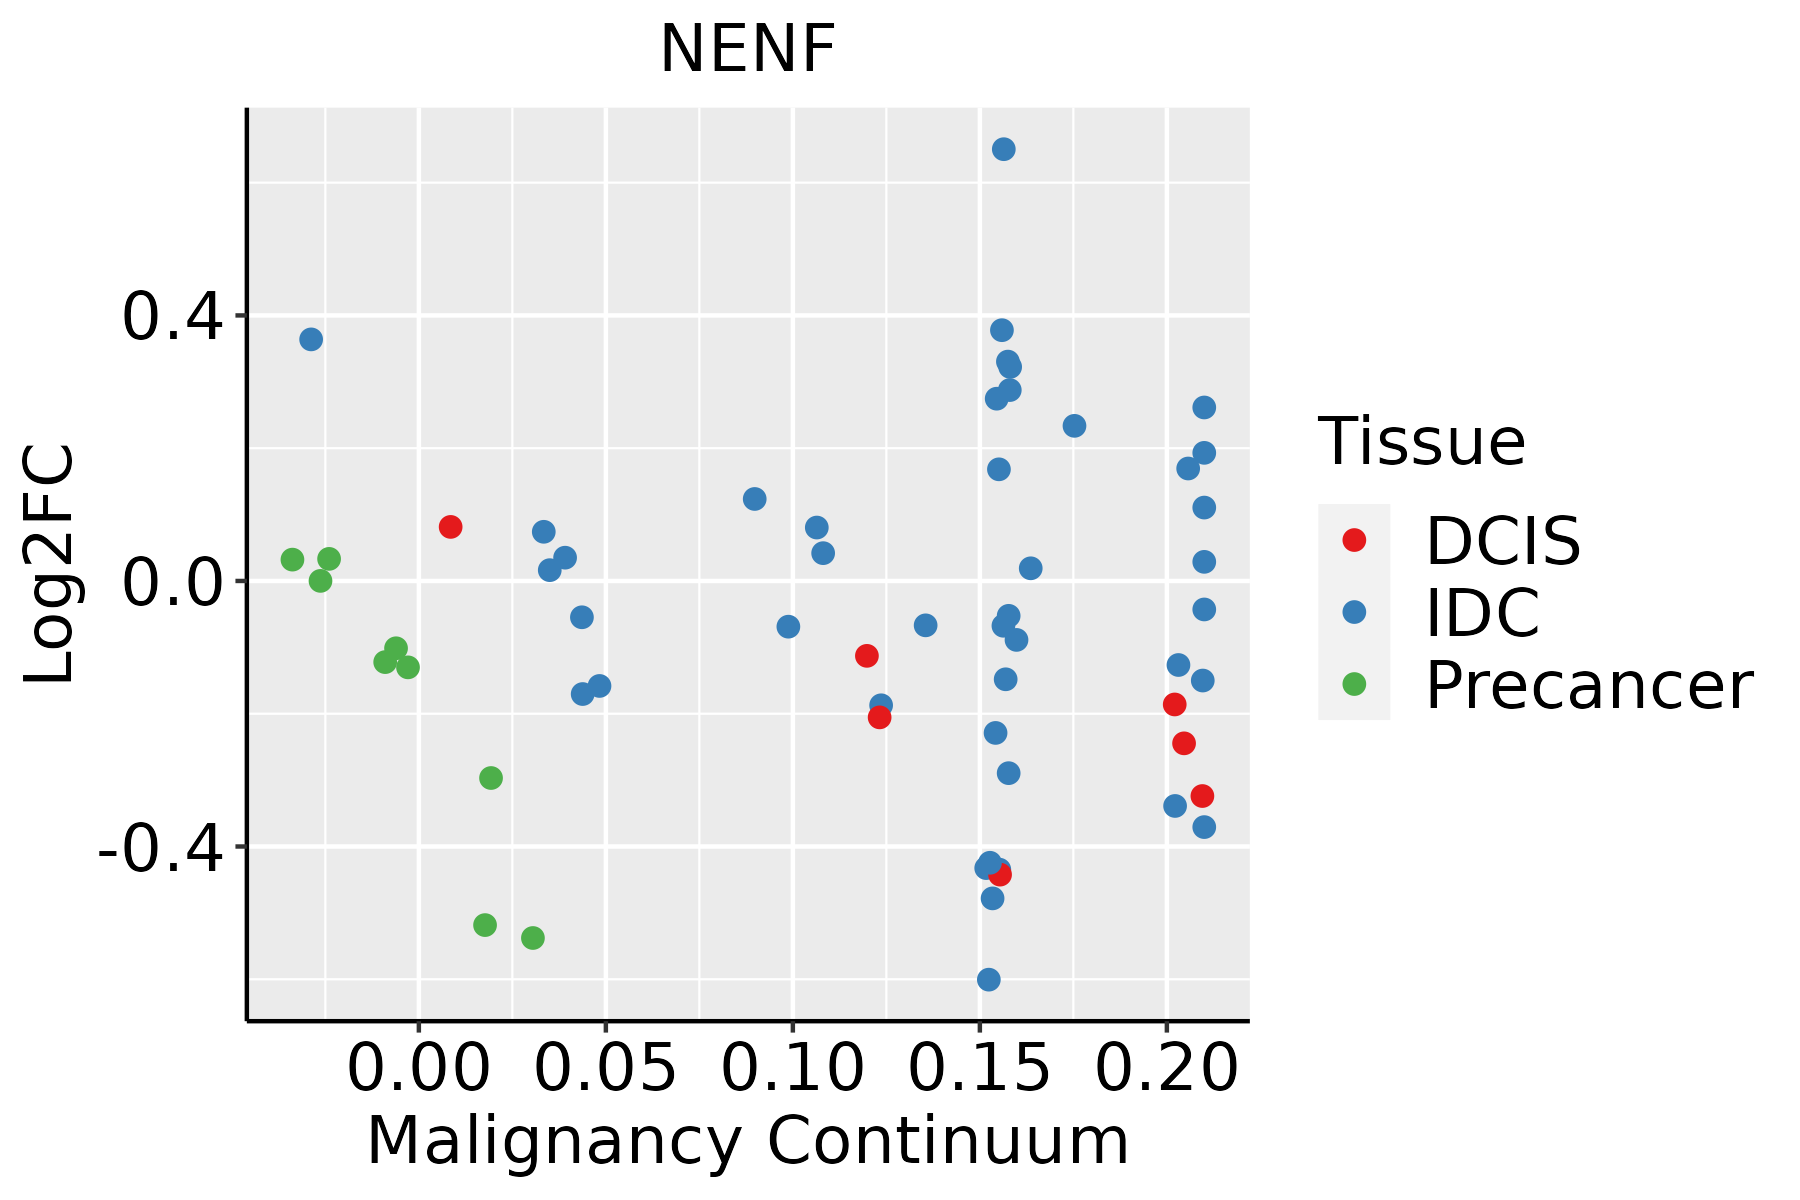 | IDC: Invasive ductal carcinoma |
| DCIS: Ductal carcinoma in situ | ||
| Precancer(BRCA1-mut): Precancerous lesion from BRCA1 mutation carriers | ||
| Colorectum (GSE201348) |  | FAP: Familial adenomatous polyposis |
| CRC: Colorectal cancer | ||
| Colorectum (HTA11) |  | AD: Adenomas |
| SER: Sessile serrated lesions | ||
| MSI-H: Microsatellite-high colorectal cancer | ||
| MSS: Microsatellite stable colorectal cancer | ||
| Endometrium | 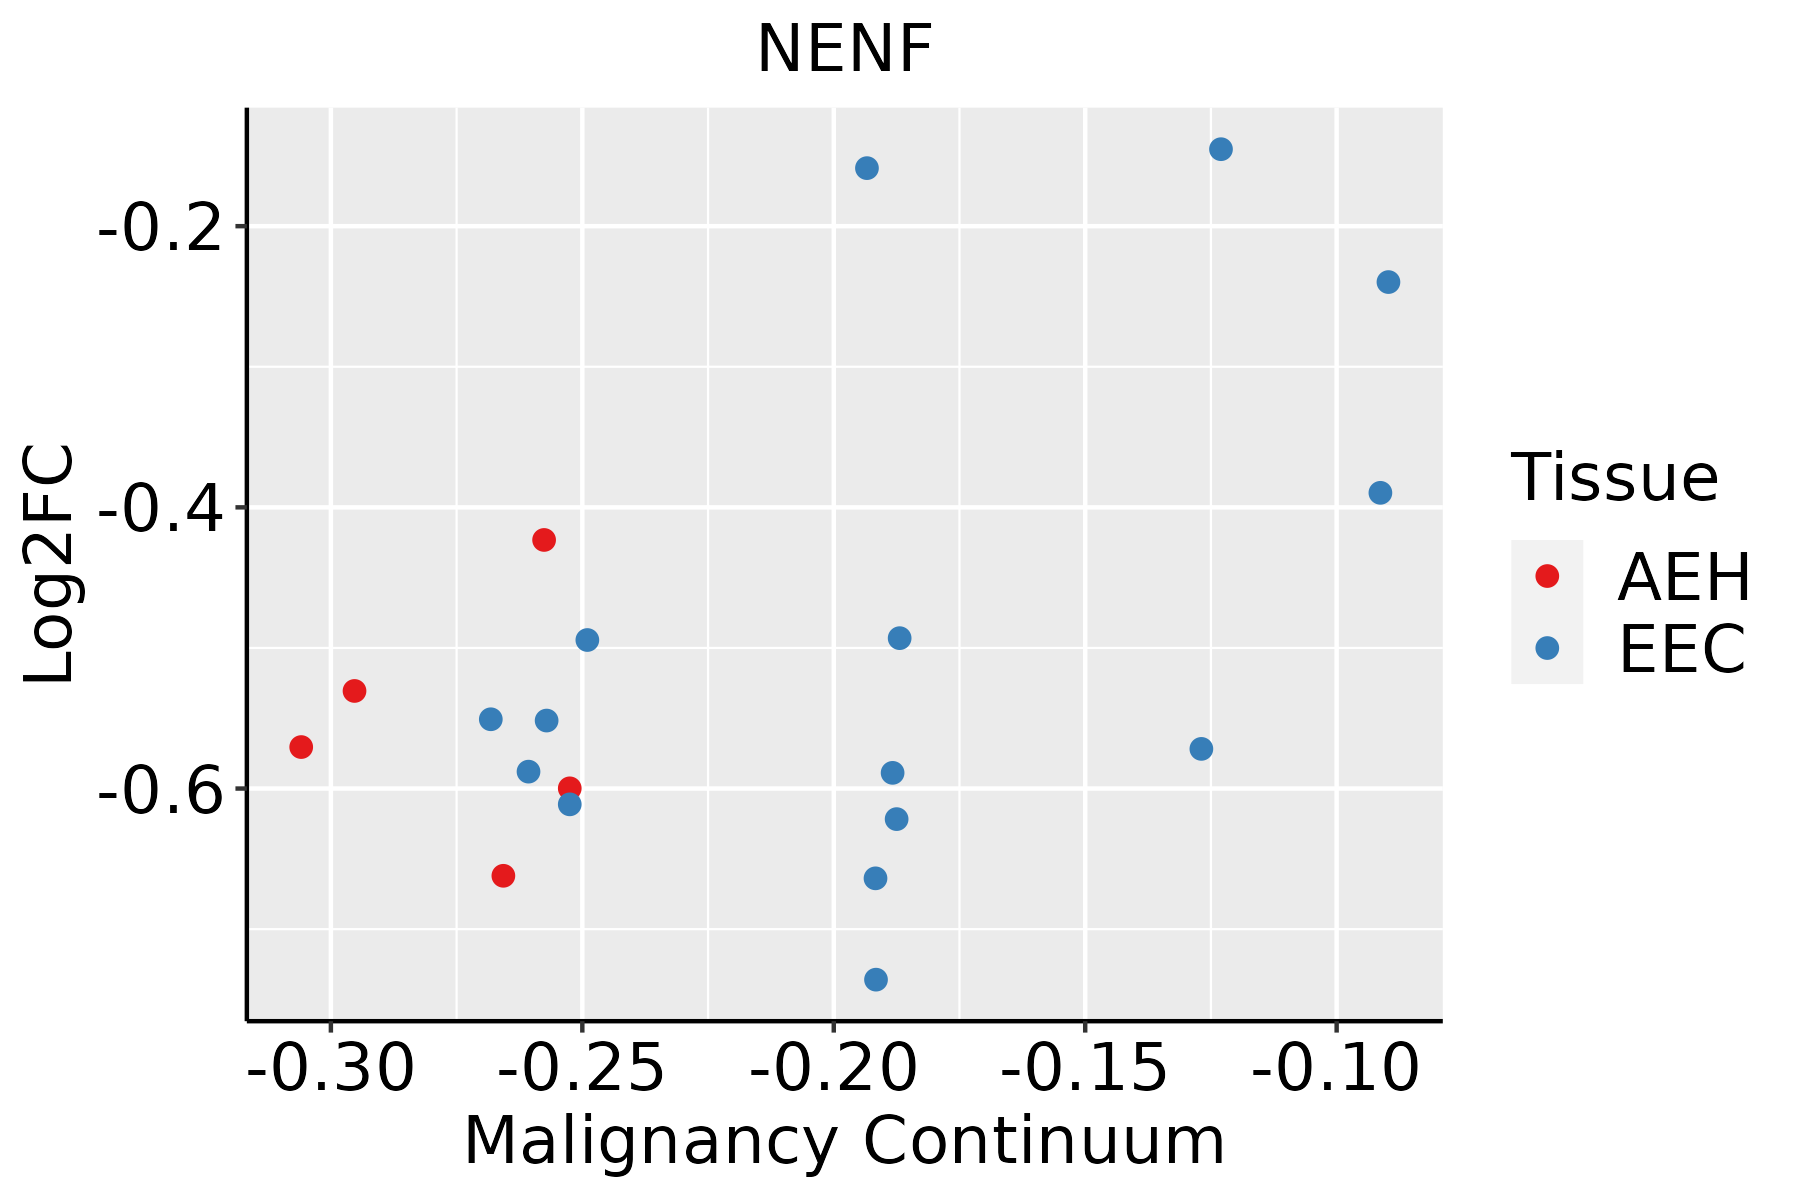 | AEH: Atypical endometrial hyperplasia |
| EEC: Endometrioid Cancer | ||
| Esophagus | 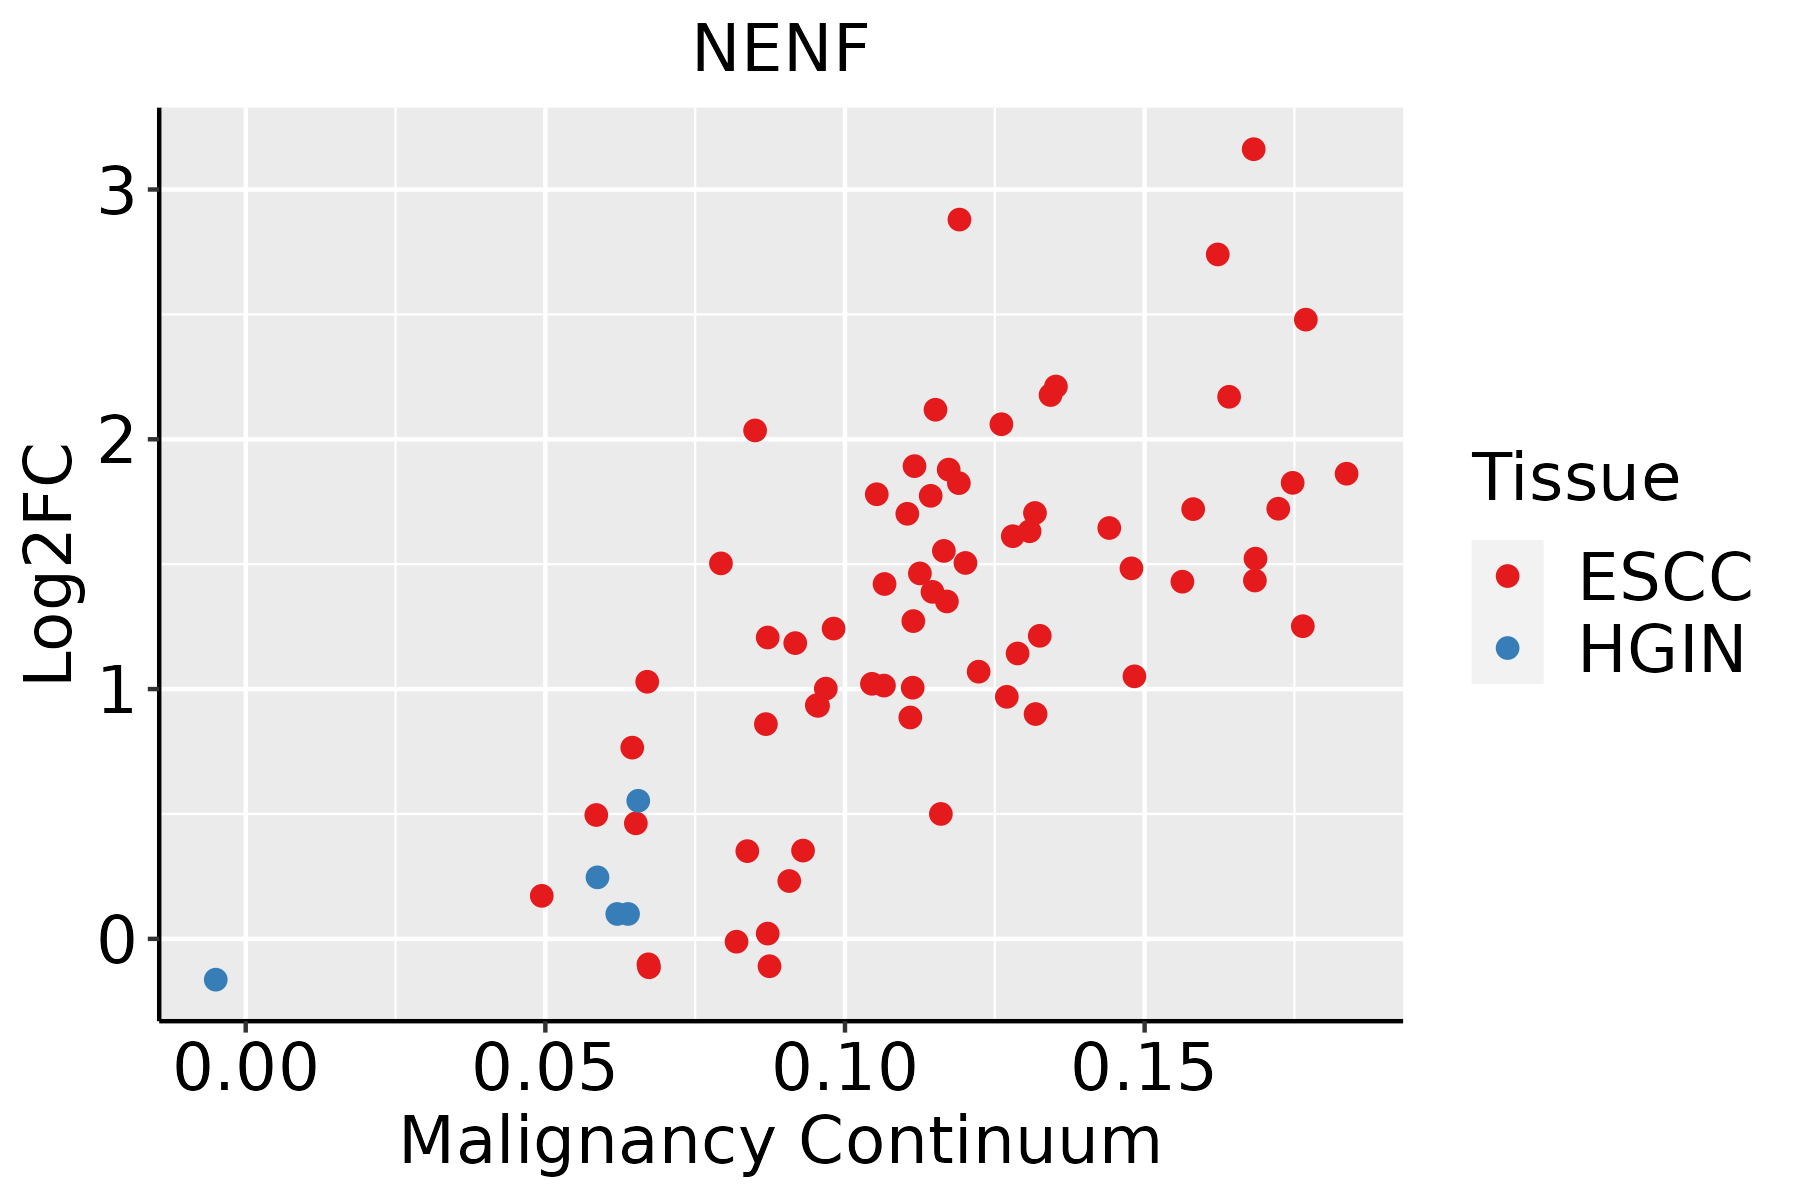 | ESCC: Esophageal squamous cell carcinoma |
| HGIN: High-grade intraepithelial neoplasias | ||
| LGIN: Low-grade intraepithelial neoplasias | ||
| Liver |  | HCC: Hepatocellular carcinoma |
| NAFLD: Non-alcoholic fatty liver disease | ||
| Oral Cavity | 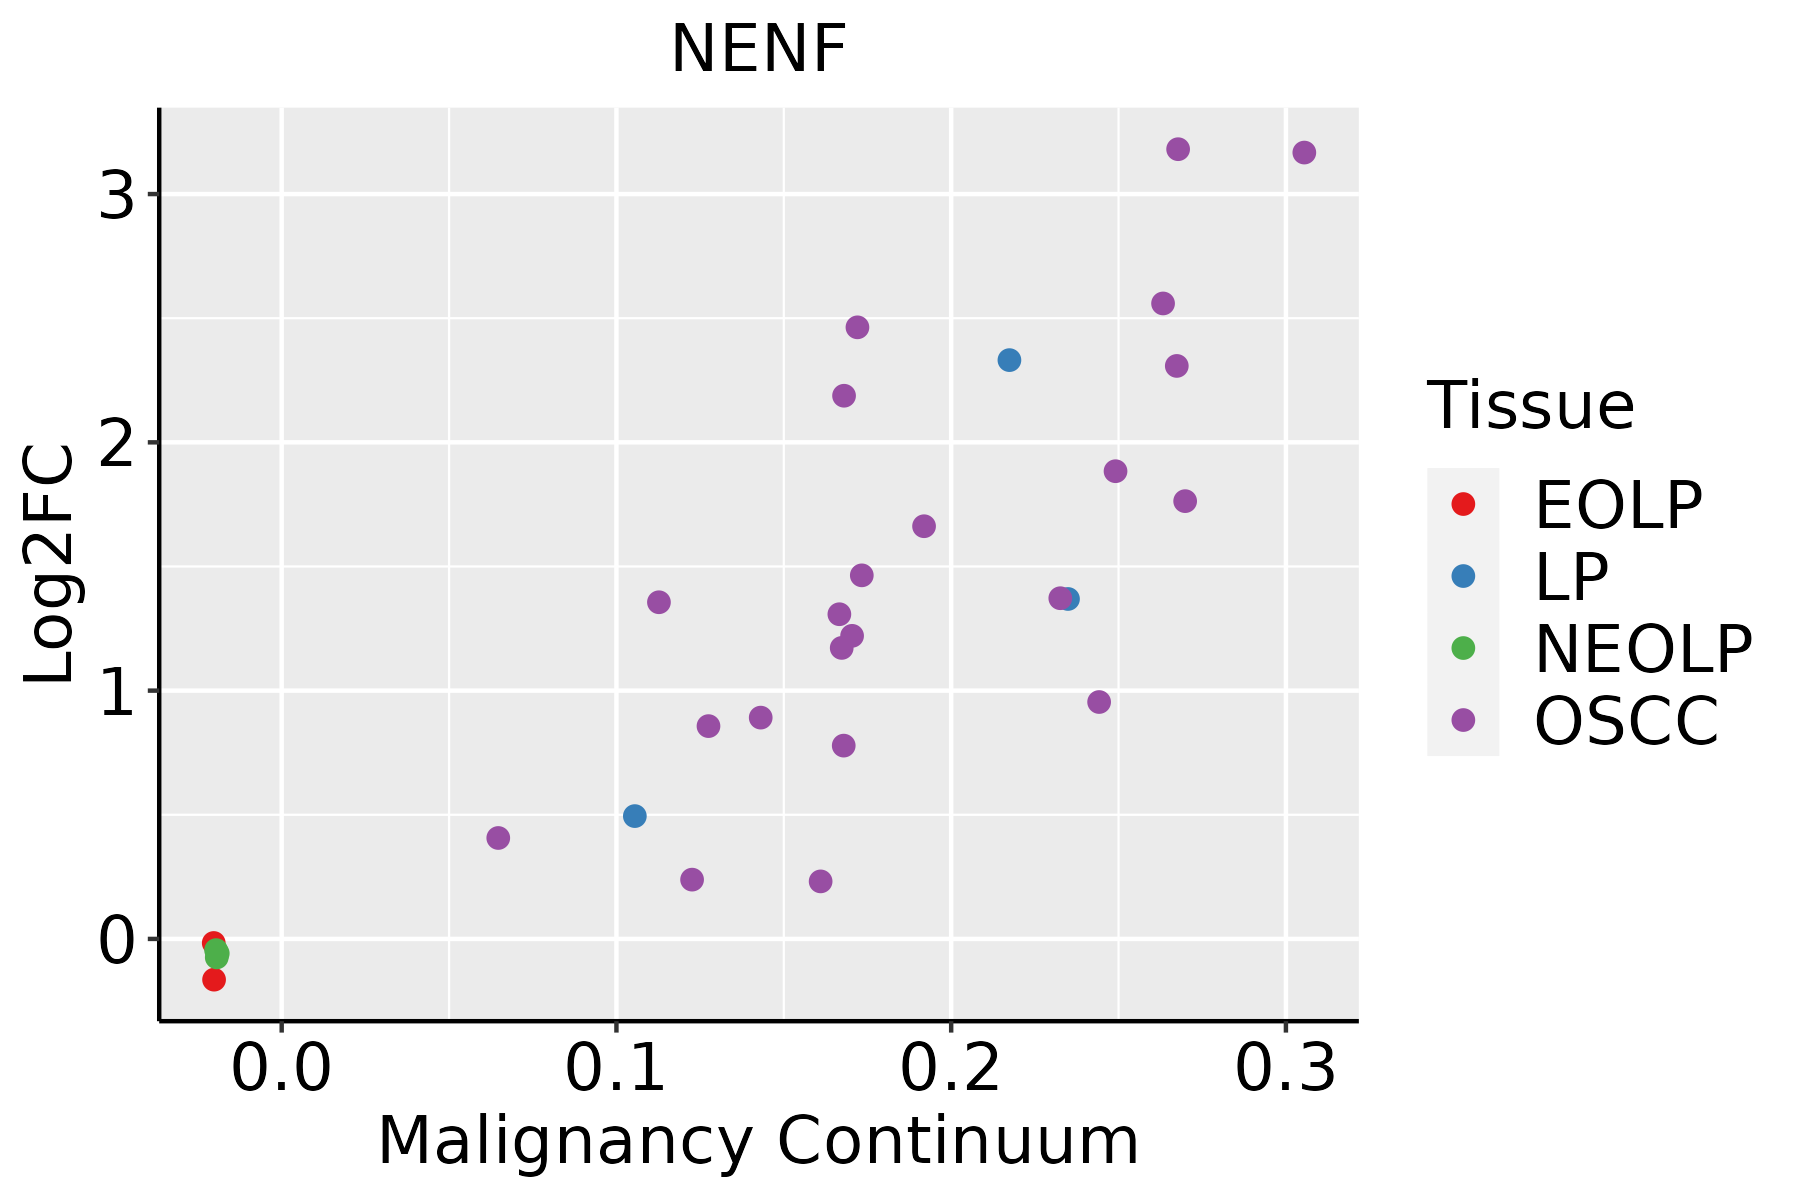 | EOLP: Erosive Oral lichen planus |
| LP: leukoplakia | ||
| NEOLP: Non-erosive oral lichen planus | ||
| OSCC: Oral squamous cell carcinoma | ||
| Prostate | 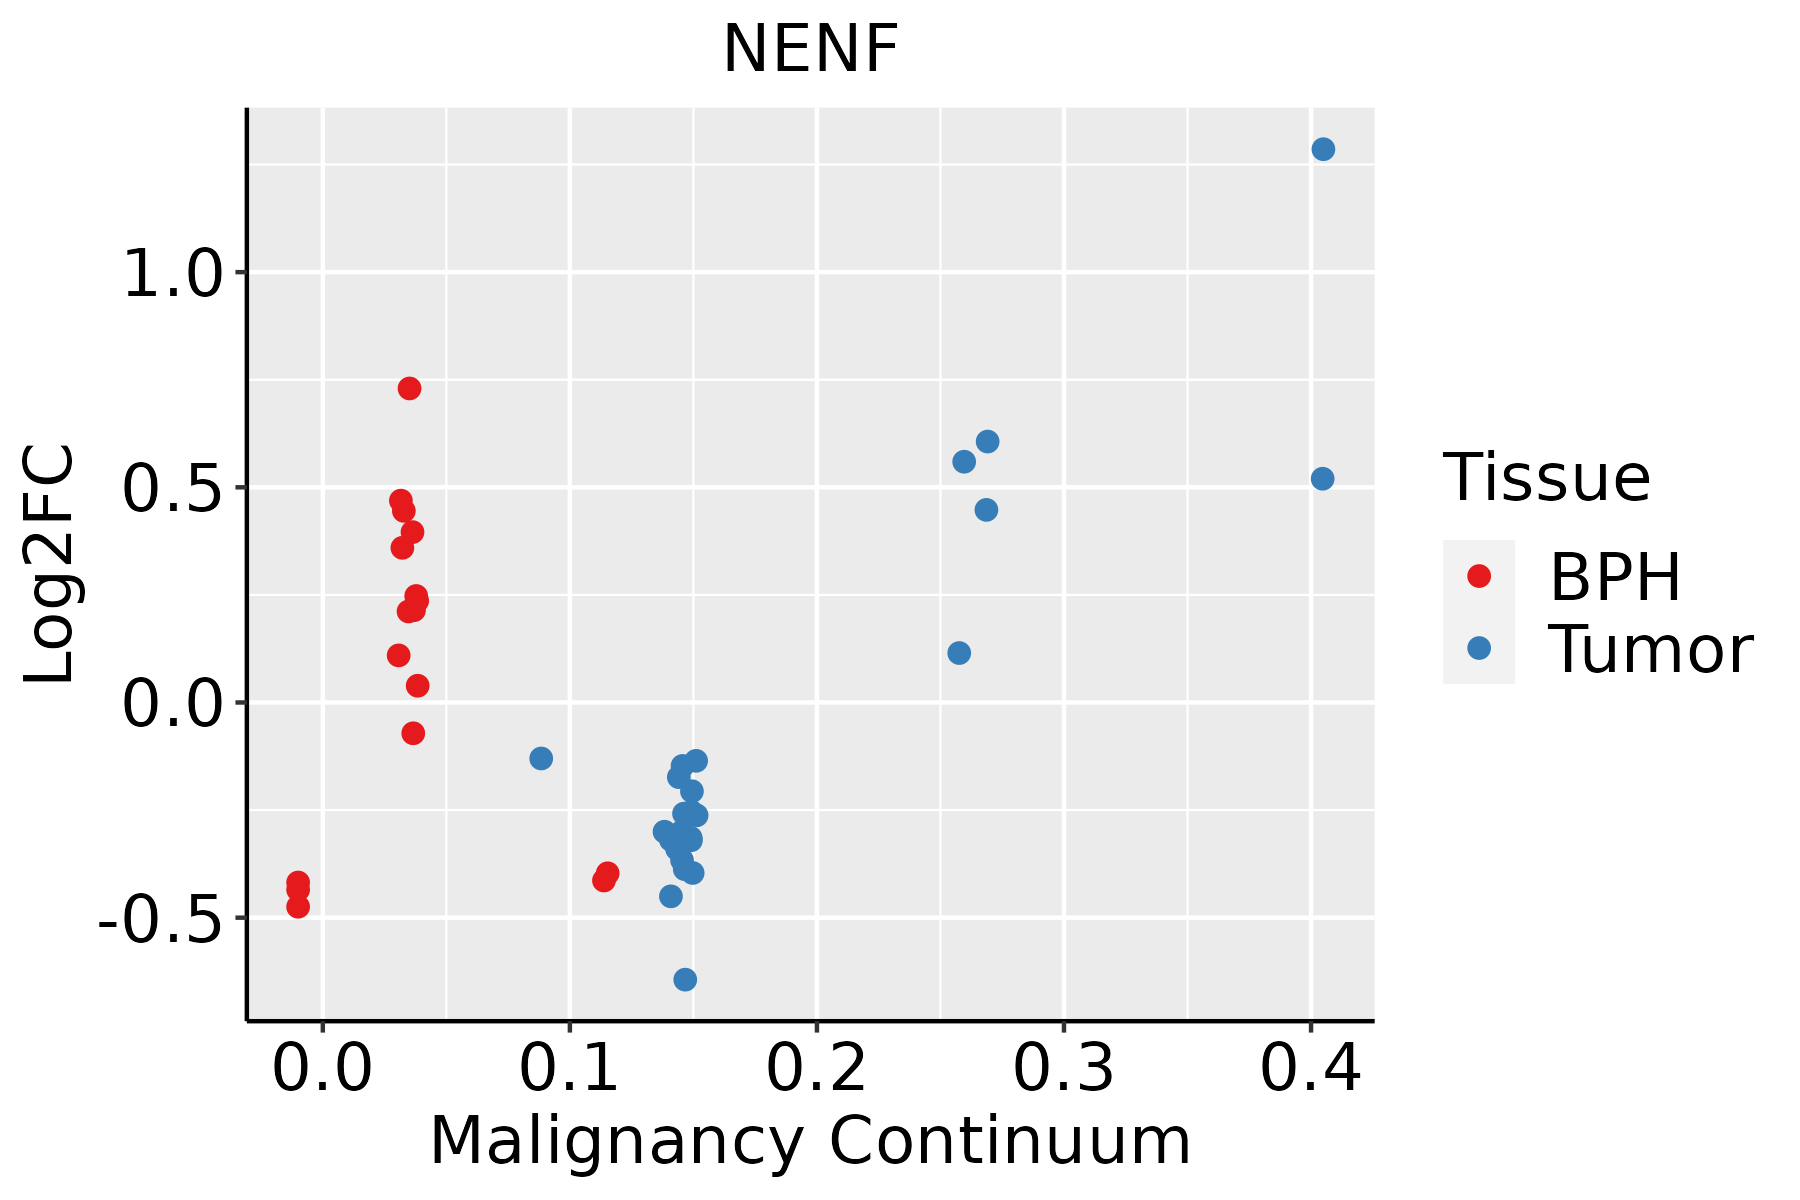 | BPH: Benign Prostatic Hyperplasia |
| Skin |  | AK: Actinic keratosis |
| cSCC: Cutaneous squamous cell carcinoma | ||
| SCCIS:squamous cell carcinoma in situ | ||
| Thyroid | 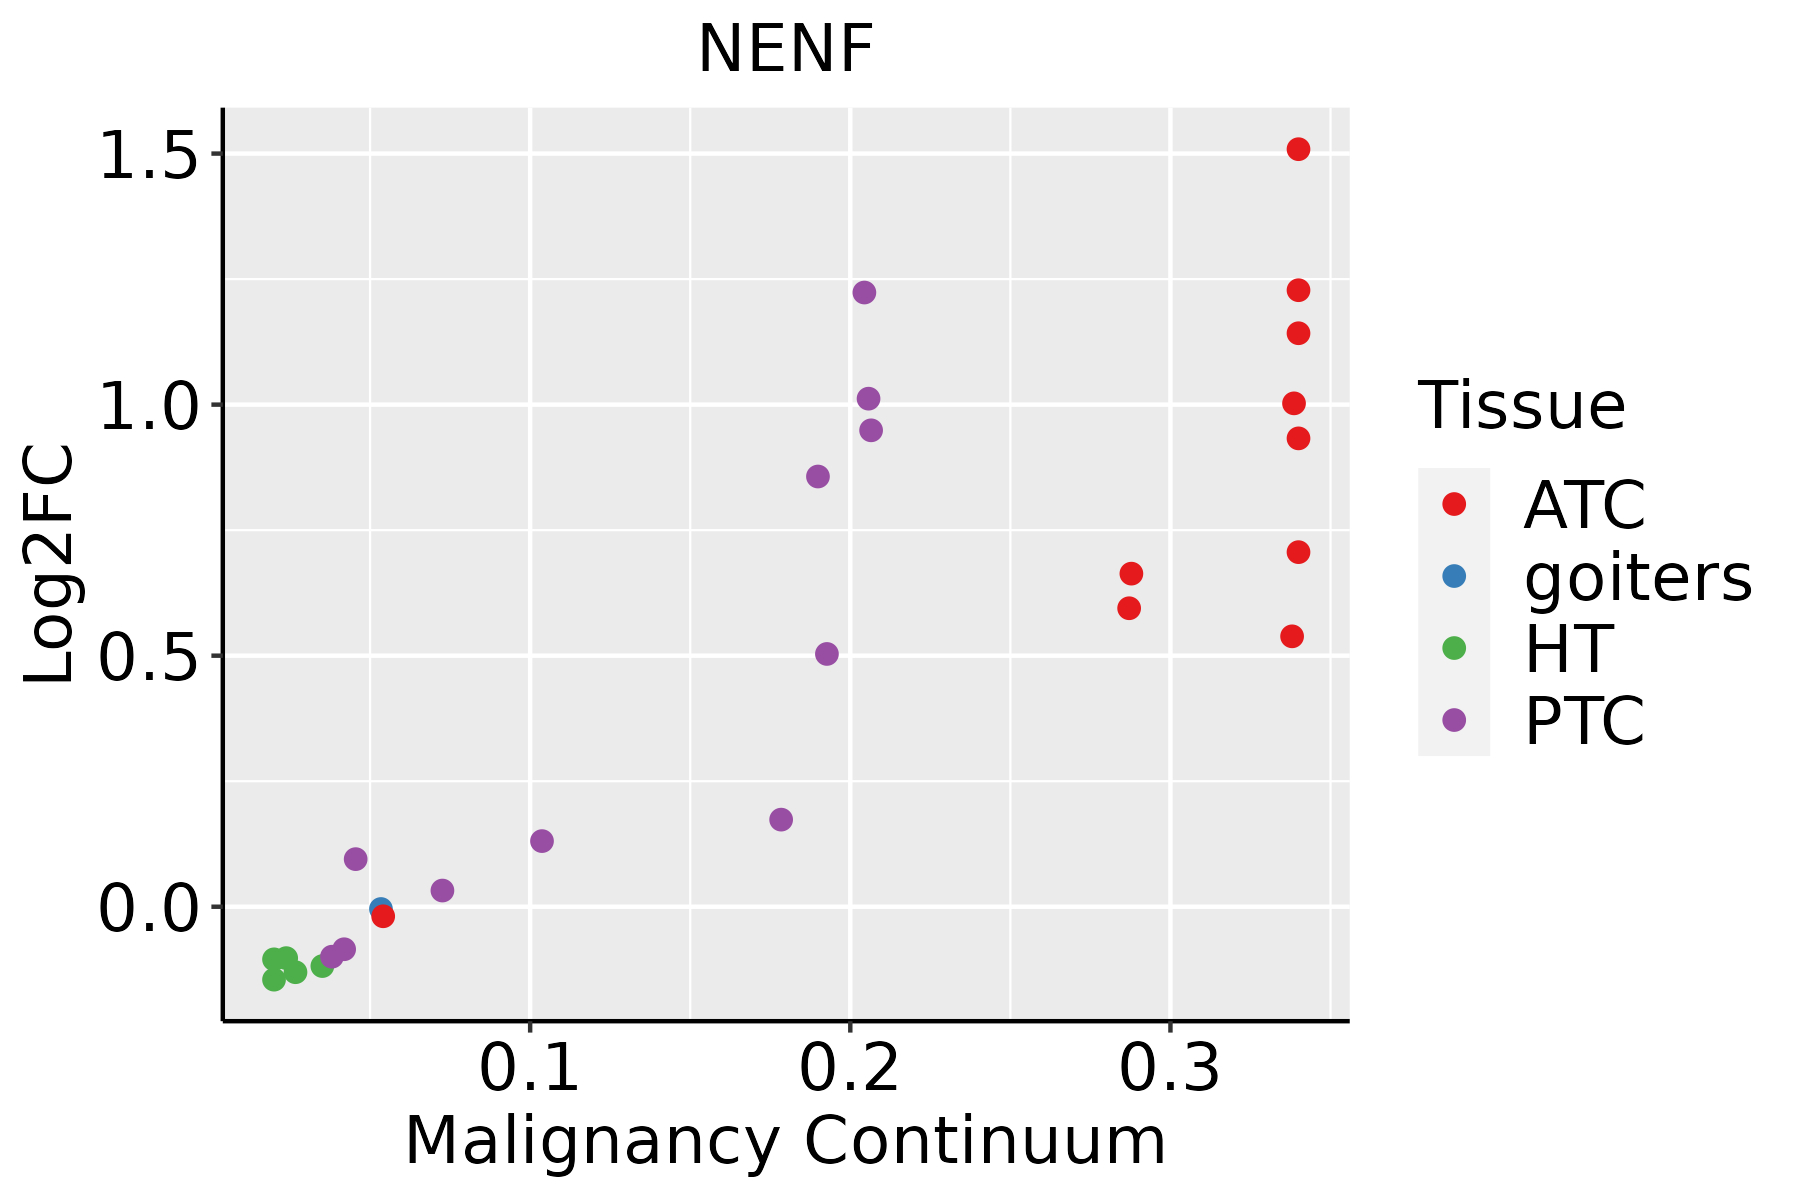 | ATC: Anaplastic thyroid cancer |
| HT: Hashimoto's thyroiditis | ||
| PTC: Papillary thyroid cancer |
| ∗log2FC in expression of this searched gene in stem-like cells from each diseased tissue sample relative to stem-like cells in normal samples in each tissue plotted against the malignancy continuum. Samples are colored based on if they are from different disease stage. |
Top |
Malignant transformation related pathway analysis |
| Find out the enriched GO biological processes and KEGG pathways involved in transition from healthy to precancer to cancer |
| Tissue | Disease Stage | Enriched GO biological Processes |
| Colorectum | AD |  |
| Colorectum | SER |  |
| Colorectum | MSS |  |
| Colorectum | MSI-H |  |
| Colorectum | FAP |  |
| ∗Top 15 enriched GO BP terms are showed in the bar plot of each disease state in each tissue. Each row represents a significant GO biological process which is colored according to the -log10(p.adjust). |
| Page: 1 2 3 4 5 6 7 8 9 |
| GO ID | Tissue | Disease Stage | Description | Gene Ratio | Bg Ratio | pvalue | p.adjust | Count |
| GO:00709979 | Breast | Precancer | neuron death | 50/1080 | 361/18723 | 7.75e-09 | 5.70e-07 | 50 |
| GO:19012149 | Breast | Precancer | regulation of neuron death | 41/1080 | 319/18723 | 1.27e-06 | 4.80e-05 | 41 |
| GO:00316679 | Breast | Precancer | response to nutrient levels | 47/1080 | 474/18723 | 2.09e-04 | 3.27e-03 | 47 |
| GO:19012157 | Breast | Precancer | negative regulation of neuron death | 24/1080 | 208/18723 | 9.50e-04 | 1.07e-02 | 24 |
| GO:007099714 | Breast | IDC | neuron death | 57/1434 | 361/18723 | 1.31e-07 | 7.38e-06 | 57 |
| GO:190121414 | Breast | IDC | regulation of neuron death | 48/1434 | 319/18723 | 5.01e-06 | 1.69e-04 | 48 |
| GO:003166714 | Breast | IDC | response to nutrient levels | 62/1434 | 474/18723 | 2.33e-05 | 5.57e-04 | 62 |
| GO:190121513 | Breast | IDC | negative regulation of neuron death | 29/1434 | 208/18723 | 1.23e-03 | 1.32e-02 | 29 |
| GO:007099724 | Breast | DCIS | neuron death | 57/1390 | 361/18723 | 4.56e-08 | 2.84e-06 | 57 |
| GO:190121421 | Breast | DCIS | regulation of neuron death | 48/1390 | 319/18723 | 2.13e-06 | 7.79e-05 | 48 |
| GO:003166723 | Breast | DCIS | response to nutrient levels | 58/1390 | 474/18723 | 1.16e-04 | 2.03e-03 | 58 |
| GO:190121521 | Breast | DCIS | negative regulation of neuron death | 29/1390 | 208/18723 | 7.58e-04 | 8.95e-03 | 29 |
| GO:00321021 | Breast | DCIS | negative regulation of response to external stimulus | 46/1390 | 420/18723 | 5.19e-03 | 3.81e-02 | 46 |
| GO:0070997 | Colorectum | AD | neuron death | 114/3918 | 361/18723 | 1.13e-06 | 3.72e-05 | 114 |
| GO:0031667 | Colorectum | AD | response to nutrient levels | 138/3918 | 474/18723 | 1.22e-05 | 2.68e-04 | 138 |
| GO:1901214 | Colorectum | AD | regulation of neuron death | 99/3918 | 319/18723 | 1.26e-05 | 2.76e-04 | 99 |
| GO:1901215 | Colorectum | AD | negative regulation of neuron death | 67/3918 | 208/18723 | 8.81e-05 | 1.35e-03 | 67 |
| GO:00316671 | Colorectum | SER | response to nutrient levels | 106/2897 | 474/18723 | 3.94e-05 | 1.00e-03 | 106 |
| GO:00709971 | Colorectum | SER | neuron death | 84/2897 | 361/18723 | 5.76e-05 | 1.35e-03 | 84 |
| GO:19012141 | Colorectum | SER | regulation of neuron death | 71/2897 | 319/18723 | 7.95e-04 | 1.00e-02 | 71 |
| Page: 1 2 3 4 5 |
| Pathway ID | Tissue | Disease Stage | Description | Gene Ratio | Bg Ratio | pvalue | p.adjust | qvalue | Count |
| Page: 1 |
Top |
Cell-cell communication analysis |
| Identification of potential cell-cell interactions between two cell types and their ligand-receptor pairs for different disease states |
| Ligand | Receptor | LRpair | Pathway | Tissue | Disease Stage |
| Page: 1 |
Top |
Single-cell gene regulatory network inference analysis |
| Find out the significant the regulons (TFs) and the target genes of each regulon across cell types for different disease states |
| TF | Cell Type | Tissue | Disease Stage | Target Gene | RSS | Regulon Activity |
| ∗The dot plots of a searched regulon are shown for all cell subpopulations in each disease state of each tissue based on the regulon specific score inferred using pySCENIC and by calculating the average expression. |
| Page: 1 |
Top |
Somatic mutation of malignant transformation related genes |
| Annotation of somatic variants for genes involved in malignant transformation |
| Hugo Symbol | Variant Class | Variant Classification | dbSNP RS | HGVSc | HGVSp | HGVSp Short | SWISSPROT | BIOTYPE | SIFT | PolyPhen | Tumor Sample Barcode | Tissue | Histology | Sex | Age | Stage | Therapy Types | Drugs | Outcome |
| NENF | SNV | Missense_Mutation | c.337G>A | p.Asp113Asn | p.D113N | Q9UMX5 | protein_coding | tolerated(0.11) | benign(0.426) | TCGA-IR-A3LK-01 | Cervix | cervical & endocervical cancer | Female | >=65 | I/II | Chemotherapy | cisplatin | PD | |
| NENF | insertion | In_Frame_Ins | novel | c.503_504insTAAGGA | p.Lys169_Asp170dup | p.K169_D170dup | Q9UMX5 | protein_coding | TCGA-LP-A4AV-01 | Cervix | cervical & endocervical cancer | Female | <65 | I/II | Unknown | Unknown | SD | ||
| NENF | insertion | Frame_Shift_Ins | novel | c.504_505insGA | p.Lys169GlufsTer23 | p.K169Efs*23 | Q9UMX5 | protein_coding | TCGA-LP-A4AV-01 | Cervix | cervical & endocervical cancer | Female | <65 | I/II | Unknown | Unknown | SD | ||
| NENF | SNV | Missense_Mutation | c.207N>T | p.Lys69Asn | p.K69N | Q9UMX5 | protein_coding | deleterious(0.02) | probably_damaging(0.99) | TCGA-AA-3845-01 | Colorectum | colon adenocarcinoma | Female | >=65 | I/II | Unknown | Unknown | PD | |
| NENF | SNV | Missense_Mutation | c.187N>T | p.Pro63Ser | p.P63S | Q9UMX5 | protein_coding | deleterious(0) | probably_damaging(1) | TCGA-F4-6703-01 | Colorectum | colon adenocarcinoma | Male | <65 | I/II | Unknown | Unknown | SD | |
| NENF | SNV | Missense_Mutation | c.437G>T | p.Arg146Ile | p.R146I | Q9UMX5 | protein_coding | deleterious(0) | probably_damaging(0.994) | TCGA-AG-A002-01 | Colorectum | rectum adenocarcinoma | Male | <65 | I/II | Unknown | Unknown | SD | |
| NENF | SNV | Missense_Mutation | rs200680061 | c.344C>T | p.Thr115Met | p.T115M | Q9UMX5 | protein_coding | deleterious(0.02) | possibly_damaging(0.828) | TCGA-AJ-A3NE-01 | Endometrium | uterine corpus endometrioid carcinoma | Female | <65 | I/II | Unknown | Unknown | SD |
| NENF | SNV | Missense_Mutation | rs761532512 | c.232N>A | p.Gly78Arg | p.G78R | Q9UMX5 | protein_coding | deleterious(0) | probably_damaging(0.999) | TCGA-AJ-A3OK-01 | Endometrium | uterine corpus endometrioid carcinoma | Female | >=65 | I/II | Chemotherapy | carboplatin | CR |
| NENF | SNV | Missense_Mutation | c.404C>T | p.Ala135Val | p.A135V | Q9UMX5 | protein_coding | deleterious(0) | benign(0.388) | TCGA-AP-A051-01 | Endometrium | uterine corpus endometrioid carcinoma | Female | >=65 | I/II | Unknown | Unknown | SD | |
| NENF | SNV | Missense_Mutation | rs199958962 | c.418N>A | p.Val140Ile | p.V140I | Q9UMX5 | protein_coding | deleterious(0.05) | probably_damaging(0.998) | TCGA-AX-A064-01 | Endometrium | uterine corpus endometrioid carcinoma | Female | >=65 | I/II | Unknown | Unknown | SD |
| Page: 1 2 |
Top |
Related drugs of malignant transformation related genes |
| Identification of chemicals and drugs interact with genes involved in malignant transfromation |
| (DGIdb 4.0) |
| Entrez ID | Symbol | Category | Interaction Types | Drug Claim Name | Drug Name | PMIDs |
| Page: 1 |

Copyright 2023-Present -The University of Texas Health Science Center at Houston |