
|
|||||
|
 | |
| |
| |
| |
| |
| |
|
Gene: NELL1 |
Gene summary for NELL1 |
| Gene information | Species | Human | Gene symbol | NELL1 | Gene ID | 4745 |
| Gene name | neural EGFL like 1 | |
| Gene Alias | IDH3GL | |
| Cytomap | 11p15.1 | |
| Gene Type | protein-coding | GO ID | GO:0001503 | UniProtAcc | B3KXR2 |
Top |
Malignant transformation analysis |
| Identification of the aberrant gene expression in precancerous and cancerous lesions by comparing the gene expression of stem-like cells in diseased tissues with normal stem cells |
| Entrez ID | Symbol | Replicates | Species | Organ | Tissue | Adj P-value | Log2FC | Malignancy |
| 4745 | NELL1 | RNA-P18T-P18T-2 | Human | Lung | IAC | 5.73e-08 | 1.55e+00 | 0.1129 |
| 4745 | NELL1 | RNA-P18T-P18T-4 | Human | Lung | IAC | 2.30e-04 | 1.13e+00 | 0.1024 |
| 4745 | NELL1 | RNA-P18T-P18T-6 | Human | Lung | IAC | 7.96e-06 | 1.28e+00 | 0.0856 |
| 4745 | NELL1 | RNA-P18T-P18T-8 | Human | Lung | IAC | 1.76e-10 | 1.86e+00 | 0.1151 |
| 4745 | NELL1 | RNA-P23T2-P23T2-2 | Human | Lung | MIAC | 3.17e-04 | 9.25e-01 | -0.028 |
| 4745 | NELL1 | RNA-P23T2-P23T2-4 | Human | Lung | MIAC | 3.47e-02 | 8.50e-01 | -0.0272 |
| 4745 | NELL1 | RNA-P25T1-P25T1-1 | Human | Lung | AIS | 1.03e-03 | 3.65e-01 | -0.2116 |
| 4745 | NELL1 | RNA-P7T1-P7T1-1 | Human | Lung | AIS | 2.54e-17 | 1.43e+00 | -0.0961 |
| 4745 | NELL1 | RNA-P7T1-P7T1-2 | Human | Lung | AIS | 2.95e-17 | 1.29e+00 | -0.0876 |
| 4745 | NELL1 | RNA-P7T1-P7T1-3 | Human | Lung | AIS | 5.30e-14 | 1.21e+00 | -0.0822 |
| 4745 | NELL1 | RNA-P7T1-P7T1-4 | Human | Lung | AIS | 2.20e-20 | 1.38e+00 | -0.0809 |
| Page: 1 |
| Tissue | Expression Dynamics | Abbreviation |
| Lung | 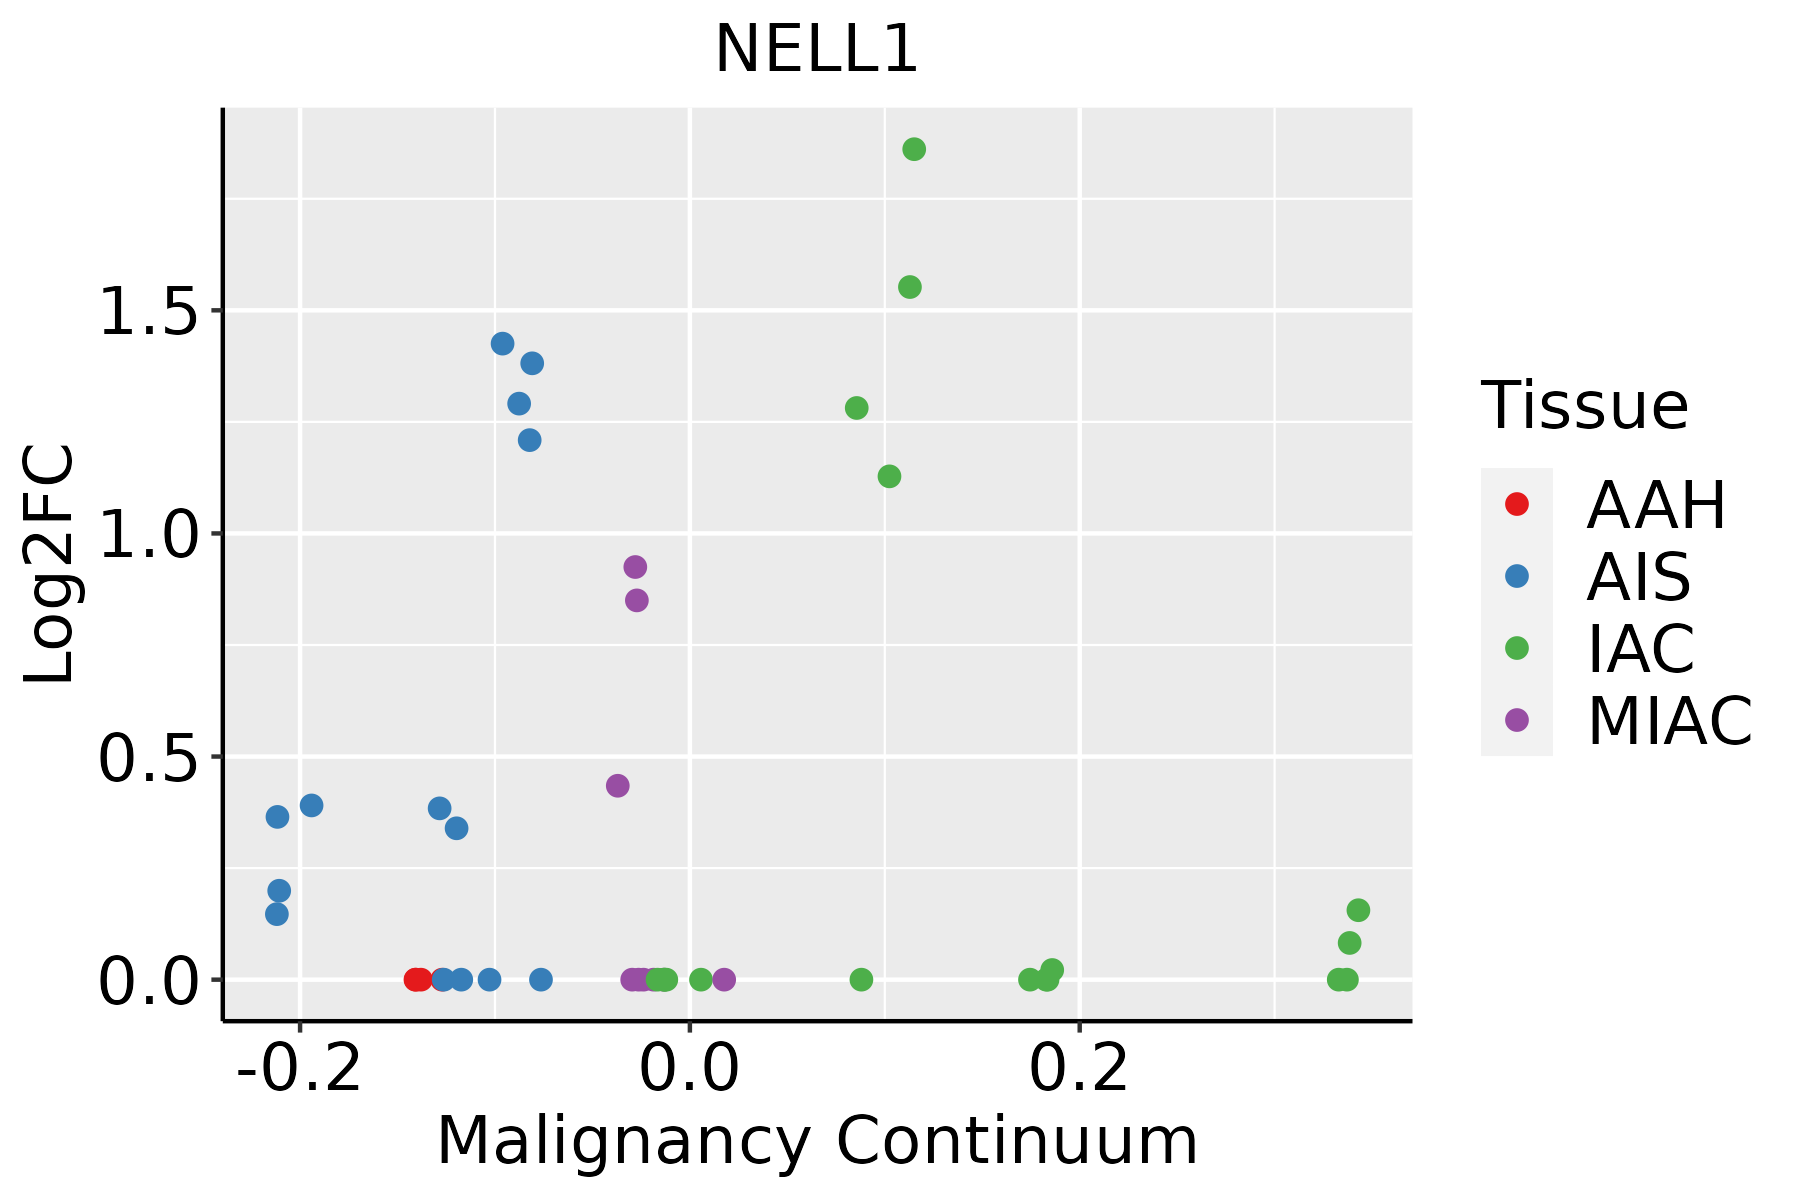 | AAH: Atypical adenomatous hyperplasia |
| AIS: Adenocarcinoma in situ | ||
| IAC: Invasive lung adenocarcinoma | ||
| MIA: Minimally invasive adenocarcinoma |
| ∗log2FC in expression of this searched gene in stem-like cells from each diseased tissue sample relative to stem-like cells in normal samples in each tissue plotted against the malignancy continuum. Samples are colored based on if they are from different disease stage. |
Top |
Malignant transformation related pathway analysis |
| Find out the enriched GO biological processes and KEGG pathways involved in transition from healthy to precancer to cancer |
| Tissue | Disease Stage | Enriched GO biological Processes |
| Colorectum | AD |  |
| Colorectum | SER |  |
| Colorectum | MSS |  |
| Colorectum | MSI-H |  |
| Colorectum | FAP |  |
| ∗Top 15 enriched GO BP terms are showed in the bar plot of each disease state in each tissue. Each row represents a significant GO biological process which is colored according to the -log10(p.adjust). |
| Page: 1 2 3 4 5 6 7 8 9 |
| GO ID | Tissue | Disease Stage | Description | Gene Ratio | Bg Ratio | pvalue | p.adjust | Count |
| GO:00421768 | Lung | IAC | regulation of protein catabolic process | 97/2061 | 391/18723 | 6.32e-15 | 1.25e-11 | 97 |
| GO:19033628 | Lung | IAC | regulation of cellular protein catabolic process | 63/2061 | 255/18723 | 4.30e-10 | 9.45e-08 | 63 |
| GO:00098958 | Lung | IAC | negative regulation of catabolic process | 66/2061 | 320/18723 | 3.26e-07 | 2.48e-05 | 66 |
| GO:00313308 | Lung | IAC | negative regulation of cellular catabolic process | 57/2061 | 262/18723 | 3.31e-07 | 2.49e-05 | 57 |
| GO:00421778 | Lung | IAC | negative regulation of protein catabolic process | 29/2061 | 121/18723 | 3.88e-05 | 9.51e-04 | 29 |
| GO:19033637 | Lung | IAC | negative regulation of cellular protein catabolic process | 18/2061 | 75/18723 | 1.06e-03 | 1.26e-02 | 18 |
| GO:004217613 | Lung | AIS | regulation of protein catabolic process | 92/1849 | 391/18723 | 1.34e-15 | 3.91e-12 | 92 |
| GO:190336213 | Lung | AIS | regulation of cellular protein catabolic process | 62/1849 | 255/18723 | 1.37e-11 | 6.13e-09 | 62 |
| GO:003133013 | Lung | AIS | negative regulation of cellular catabolic process | 50/1849 | 262/18723 | 3.94e-06 | 2.05e-04 | 50 |
| GO:000989513 | Lung | AIS | negative regulation of catabolic process | 55/1849 | 320/18723 | 3.22e-05 | 1.01e-03 | 55 |
| GO:004217713 | Lung | AIS | negative regulation of protein catabolic process | 26/1849 | 121/18723 | 1.09e-04 | 2.57e-03 | 26 |
| GO:190336312 | Lung | AIS | negative regulation of cellular protein catabolic process | 18/1849 | 75/18723 | 2.89e-04 | 5.40e-03 | 18 |
| GO:004217633 | Lung | MIAC | regulation of protein catabolic process | 47/967 | 391/18723 | 6.27e-08 | 2.15e-05 | 47 |
| GO:190336233 | Lung | MIAC | regulation of cellular protein catabolic process | 34/967 | 255/18723 | 3.83e-07 | 6.52e-05 | 34 |
| GO:003133033 | Lung | MIAC | negative regulation of cellular catabolic process | 28/967 | 262/18723 | 2.23e-04 | 7.67e-03 | 28 |
| GO:190336322 | Lung | MIAC | negative regulation of cellular protein catabolic process | 11/967 | 75/18723 | 1.56e-03 | 2.65e-02 | 11 |
| GO:000989523 | Lung | MIAC | negative regulation of catabolic process | 29/967 | 320/18723 | 2.42e-03 | 3.56e-02 | 29 |
| Page: 1 |
| Pathway ID | Tissue | Disease Stage | Description | Gene Ratio | Bg Ratio | pvalue | p.adjust | qvalue | Count |
| Page: 1 |
Top |
Cell-cell communication analysis |
| Identification of potential cell-cell interactions between two cell types and their ligand-receptor pairs for different disease states |
| Ligand | Receptor | LRpair | Pathway | Tissue | Disease Stage |
| Page: 1 |
Top |
Single-cell gene regulatory network inference analysis |
| Find out the significant the regulons (TFs) and the target genes of each regulon across cell types for different disease states |
| TF | Cell Type | Tissue | Disease Stage | Target Gene | RSS | Regulon Activity |
| ∗The dot plots of a searched regulon are shown for all cell subpopulations in each disease state of each tissue based on the regulon specific score inferred using pySCENIC and by calculating the average expression. |
| Page: 1 |
Top |
Somatic mutation of malignant transformation related genes |
| Annotation of somatic variants for genes involved in malignant transformation |
| Hugo Symbol | Variant Class | Variant Classification | dbSNP RS | HGVSc | HGVSp | HGVSp Short | SWISSPROT | BIOTYPE | SIFT | PolyPhen | Tumor Sample Barcode | Tissue | Histology | Sex | Age | Stage | Therapy Types | Drugs | Outcome |
| NELL1 | SNV | Missense_Mutation | c.2431A>C | p.Met811Leu | p.M811L | protein_coding | tolerated(0.64) | benign(0.001) | TCGA-3C-AALI-01 | Breast | breast invasive carcinoma | Female | <65 | I/II | Unspecific | Poly E | Complete Response | ||
| NELL1 | SNV | Missense_Mutation | c.946N>A | p.Asp316Asn | p.D316N | protein_coding | deleterious(0.02) | possibly_damaging(0.759) | TCGA-5L-AAT1-01 | Breast | breast invasive carcinoma | Female | <65 | III/IV | Hormone Therapy | letrozol | SD | ||
| NELL1 | SNV | Missense_Mutation | novel | c.1025N>A | p.Cys342Tyr | p.C342Y | protein_coding | deleterious(0) | probably_damaging(0.993) | TCGA-A7-A26I-01 | Breast | breast invasive carcinoma | Female | >=65 | I/II | Chemotherapy | cytoxan | SD | |
| NELL1 | SNV | Missense_Mutation | c.1030C>T | p.Pro344Ser | p.P344S | protein_coding | tolerated(0.81) | benign(0.001) | TCGA-A8-A08R-01 | Breast | breast invasive carcinoma | Female | <65 | I/II | Unknown | Unknown | SD | ||
| NELL1 | SNV | Missense_Mutation | rs757482946 | c.181G>A | p.Val61Ile | p.V61I | protein_coding | tolerated(0.62) | benign(0) | TCGA-A8-A09Q-01 | Breast | breast invasive carcinoma | Female | >=65 | III/IV | Hormone Therapy | anastrozole | SD | |
| NELL1 | SNV | Missense_Mutation | c.2405C>T | p.Ser802Leu | p.S802L | protein_coding | tolerated(0.26) | benign(0.005) | TCGA-AC-A23H-01 | Breast | breast invasive carcinoma | Female | >=65 | I/II | Unknown | Unknown | PD | ||
| NELL1 | SNV | Missense_Mutation | novel | c.1025N>A | p.Cys342Tyr | p.C342Y | protein_coding | deleterious(0) | probably_damaging(0.993) | TCGA-AC-A3QQ-01 | Breast | breast invasive carcinoma | Female | <65 | I/II | Unknown | Unknown | SD | |
| NELL1 | SNV | Missense_Mutation | novel | c.157N>A | p.Asp53Asn | p.D53N | protein_coding | deleterious(0.01) | benign(0.113) | TCGA-AN-A046-01 | Breast | breast invasive carcinoma | Female | >=65 | I/II | Unknown | Unknown | SD | |
| NELL1 | SNV | Missense_Mutation | c.1723N>A | p.Glu575Lys | p.E575K | protein_coding | deleterious(0) | possibly_damaging(0.841) | TCGA-AN-A046-01 | Breast | breast invasive carcinoma | Female | >=65 | I/II | Unknown | Unknown | SD | ||
| NELL1 | SNV | Missense_Mutation | rs370919301 | c.1819N>G | p.Ser607Gly | p.S607G | protein_coding | tolerated(0.14) | benign(0.366) | TCGA-D8-A147-01 | Breast | breast invasive carcinoma | Female | <65 | I/II | Chemotherapy | doxorubicine | SD |
| Page: 1 2 3 4 5 6 7 8 9 10 11 12 13 14 15 16 17 18 19 |
Top |
Related drugs of malignant transformation related genes |
| Identification of chemicals and drugs interact with genes involved in malignant transfromation |
| (DGIdb 4.0) |
| Entrez ID | Symbol | Category | Interaction Types | Drug Claim Name | Drug Name | PMIDs |
| Page: 1 |

Copyright 2023-Present -The University of Texas Health Science Center at Houston |