
|
|||||
|
 | |
| |
| |
| |
| |
| |
|
Gene: NELFCD |
Gene summary for NELFCD |
| Gene information | Species | Human | Gene symbol | NELFCD | Gene ID | 51497 |
| Gene name | negative elongation factor complex member C/D | |
| Gene Alias | HSPC130 | |
| Cytomap | 20q13.32 | |
| Gene Type | protein-coding | GO ID | GO:0006139 | UniProtAcc | H0UI80 |
Top |
Malignant transformation analysis |
| Identification of the aberrant gene expression in precancerous and cancerous lesions by comparing the gene expression of stem-like cells in diseased tissues with normal stem cells |
| Entrez ID | Symbol | Replicates | Species | Organ | Tissue | Adj P-value | Log2FC | Malignancy |
| 51497 | NELFCD | HTA11_866_3004761011 | Human | Colorectum | AD | 4.15e-05 | 3.48e-01 | 0.096 |
| 51497 | NELFCD | HTA11_99999965104_69814 | Human | Colorectum | MSS | 5.58e-03 | 4.14e-01 | 0.281 |
| 51497 | NELFCD | HTA11_99999971662_82457 | Human | Colorectum | MSS | 4.11e-36 | 1.09e+00 | 0.3859 |
| 51497 | NELFCD | HTA11_99999973899_84307 | Human | Colorectum | MSS | 3.98e-04 | 5.47e-01 | 0.2585 |
| 51497 | NELFCD | HTA11_99999974143_84620 | Human | Colorectum | MSS | 9.52e-07 | 3.79e-01 | 0.3005 |
| 51497 | NELFCD | A015-C-203 | Human | Colorectum | FAP | 1.43e-02 | -7.12e-02 | -0.1294 |
| 51497 | NELFCD | A015-C-104 | Human | Colorectum | FAP | 2.49e-03 | -7.32e-02 | -0.1899 |
| 51497 | NELFCD | A002-C-016 | Human | Colorectum | FAP | 1.71e-07 | -1.55e-01 | 0.0521 |
| 51497 | NELFCD | A002-C-116 | Human | Colorectum | FAP | 4.55e-05 | -1.64e-01 | -0.0452 |
| 51497 | NELFCD | CRC-3-11773 | Human | Colorectum | CRC | 1.14e-06 | 3.82e-01 | 0.2564 |
| 51497 | NELFCD | LZE2T | Human | Esophagus | ESCC | 3.22e-03 | 2.69e-01 | 0.082 |
| 51497 | NELFCD | LZE4T | Human | Esophagus | ESCC | 2.55e-26 | 7.98e-01 | 0.0811 |
| 51497 | NELFCD | LZE5T | Human | Esophagus | ESCC | 1.54e-06 | 1.93e-01 | 0.0514 |
| 51497 | NELFCD | LZE7T | Human | Esophagus | ESCC | 2.31e-10 | 6.84e-01 | 0.0667 |
| 51497 | NELFCD | LZE8T | Human | Esophagus | ESCC | 4.73e-04 | 1.90e-01 | 0.067 |
| 51497 | NELFCD | LZE20T | Human | Esophagus | ESCC | 5.29e-10 | 2.94e-01 | 0.0662 |
| 51497 | NELFCD | LZE22D1 | Human | Esophagus | HGIN | 5.22e-07 | 7.73e-02 | 0.0595 |
| 51497 | NELFCD | LZE22T | Human | Esophagus | ESCC | 1.52e-04 | 3.18e-01 | 0.068 |
| 51497 | NELFCD | LZE24T | Human | Esophagus | ESCC | 1.26e-21 | 5.07e-01 | 0.0596 |
| 51497 | NELFCD | LZE21T | Human | Esophagus | ESCC | 1.11e-04 | 3.13e-01 | 0.0655 |
| Page: 1 2 3 4 5 6 7 |
| Tissue | Expression Dynamics | Abbreviation |
| Colorectum (GSE201348) | 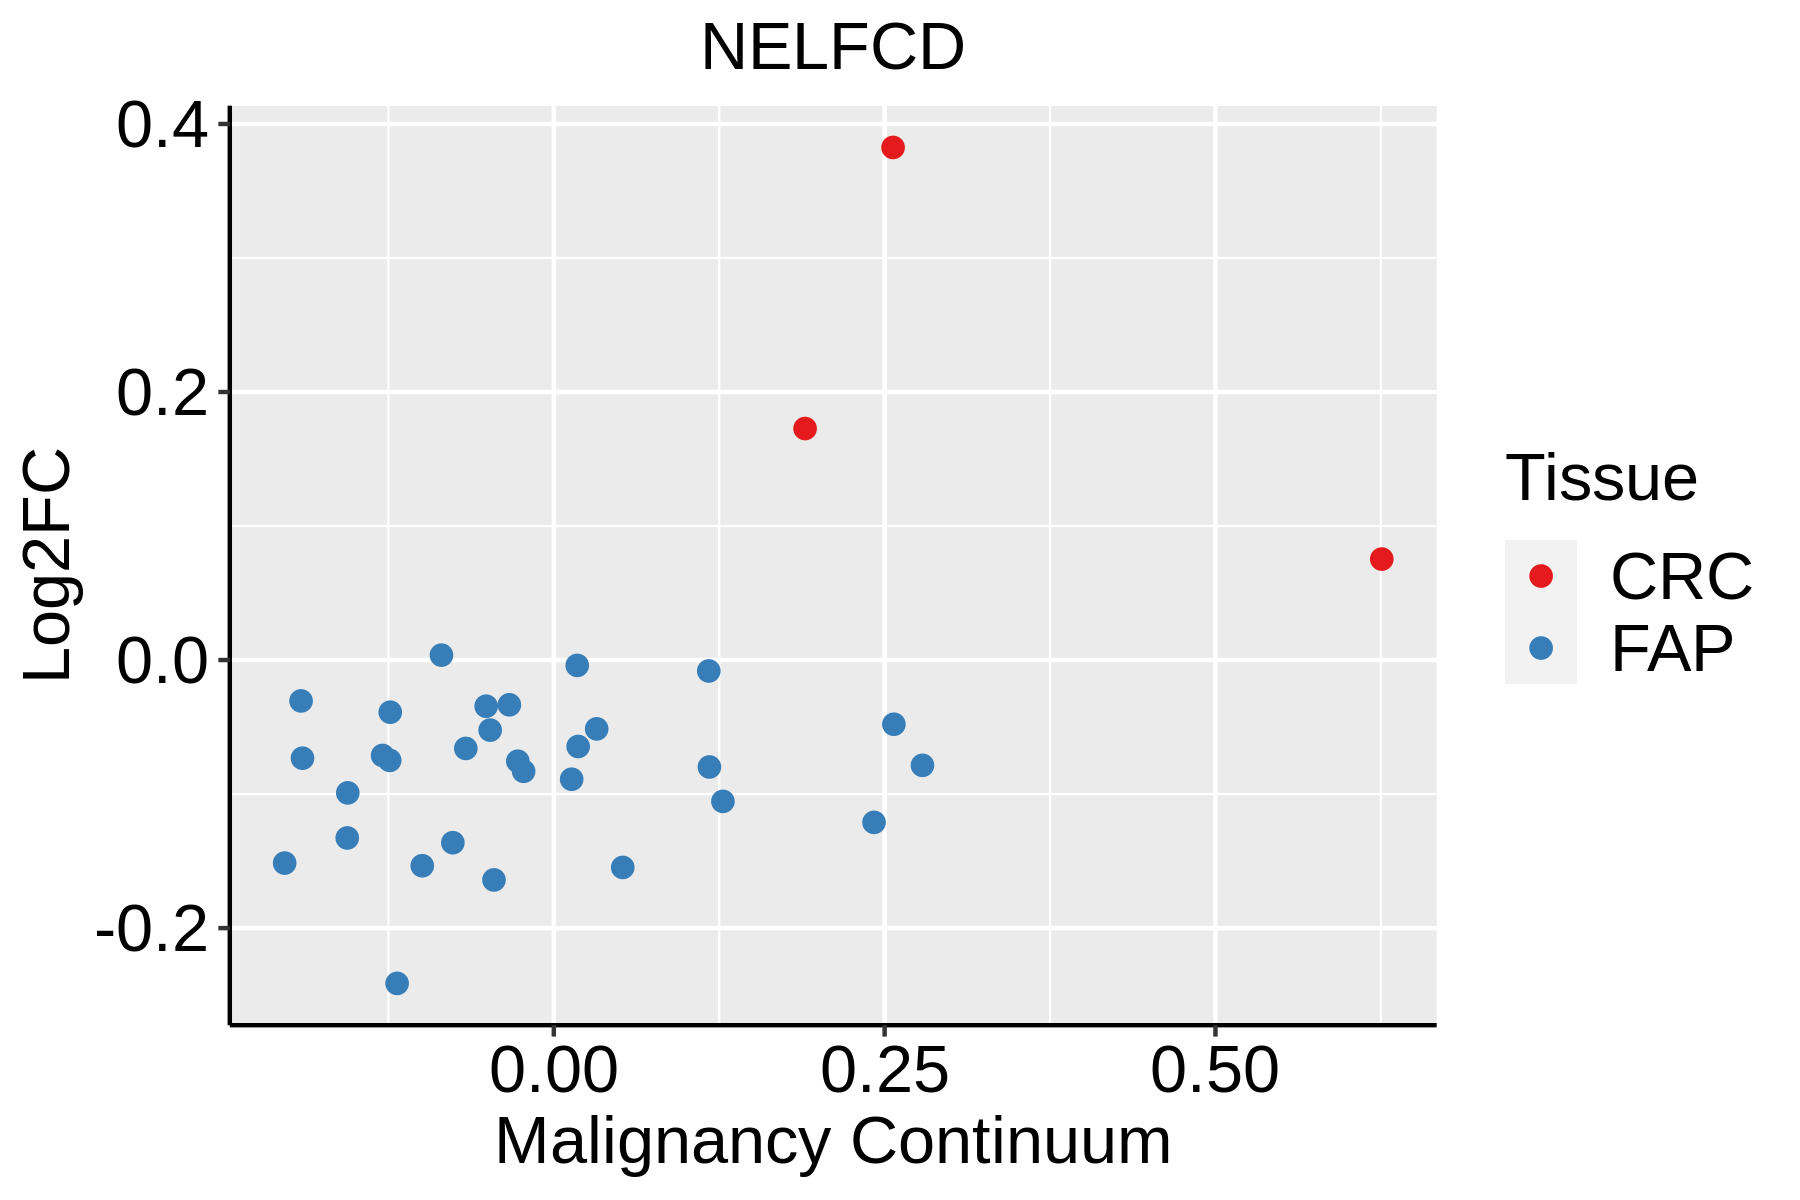 | FAP: Familial adenomatous polyposis |
| CRC: Colorectal cancer | ||
| Colorectum (HTA11) | 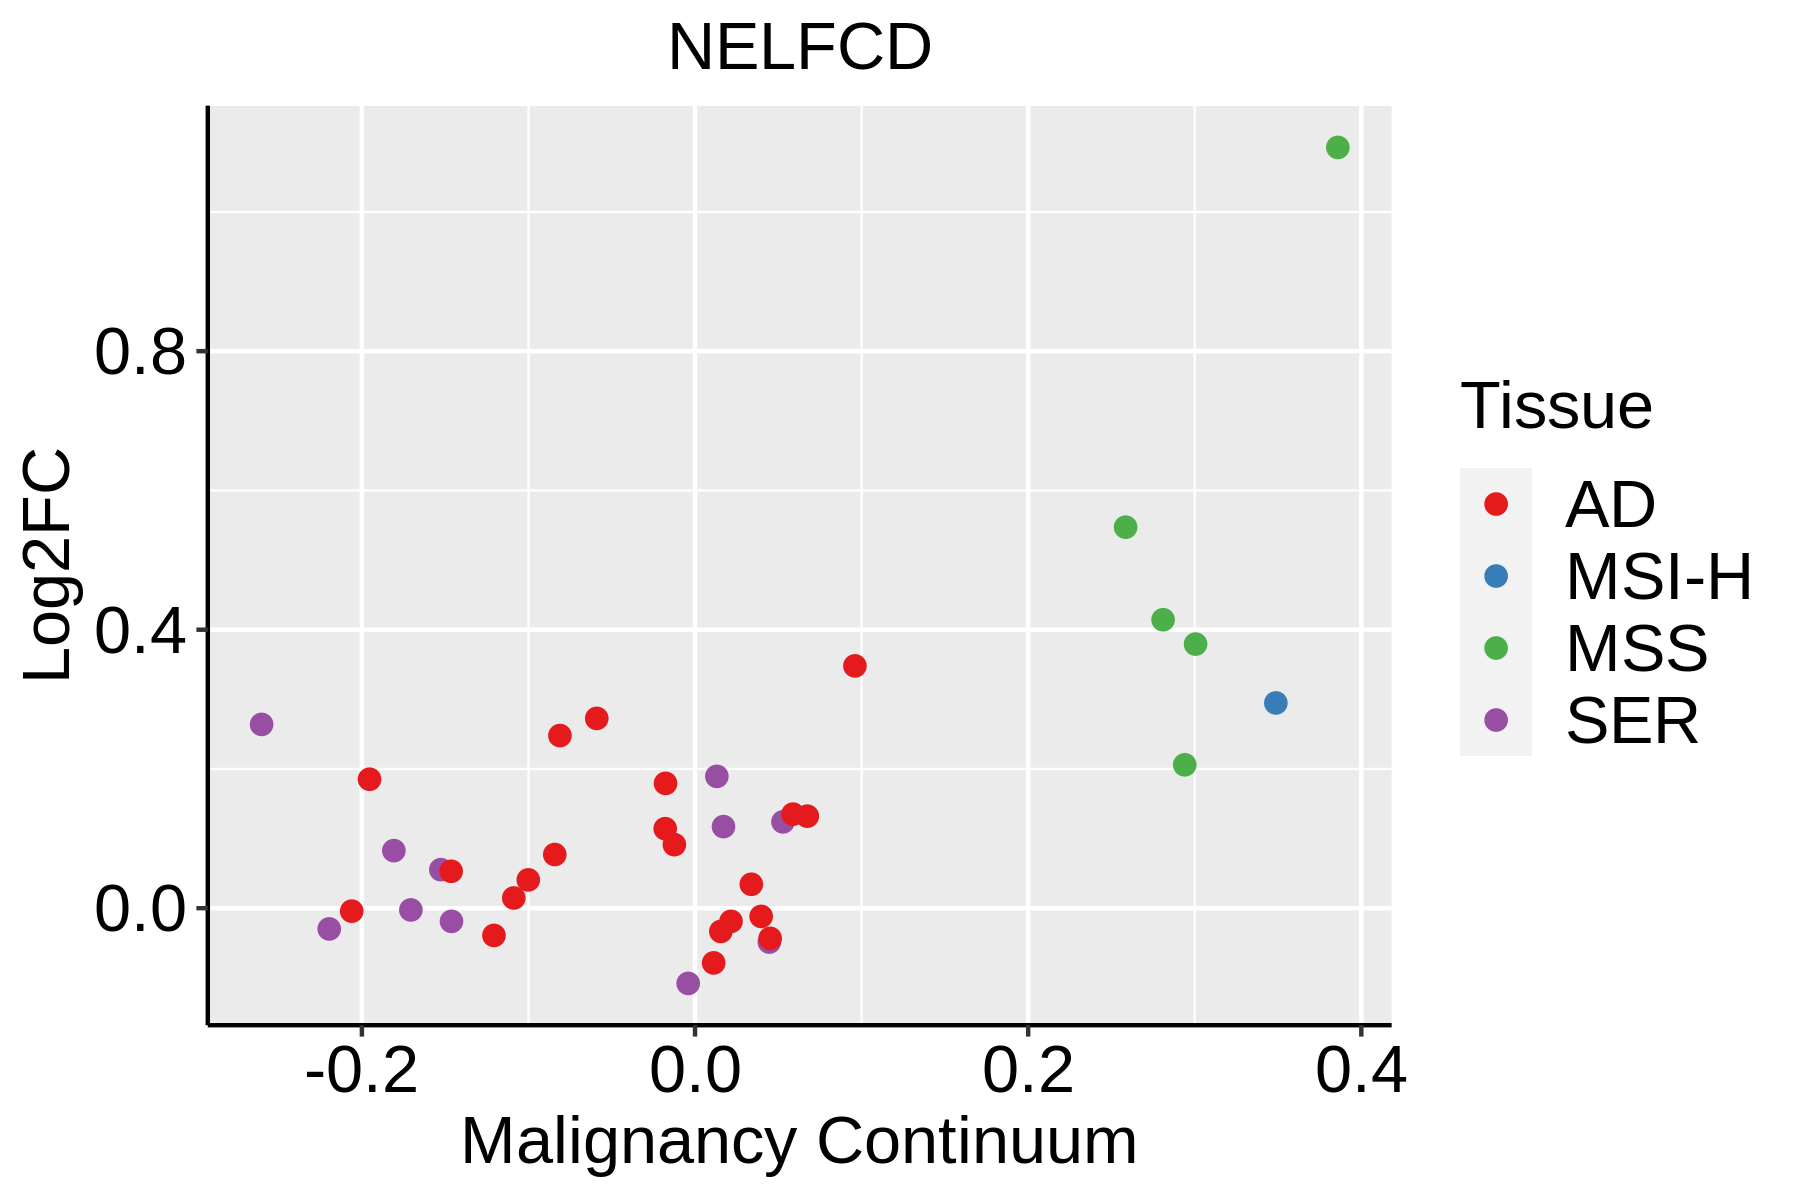 | AD: Adenomas |
| SER: Sessile serrated lesions | ||
| MSI-H: Microsatellite-high colorectal cancer | ||
| MSS: Microsatellite stable colorectal cancer | ||
| Esophagus | 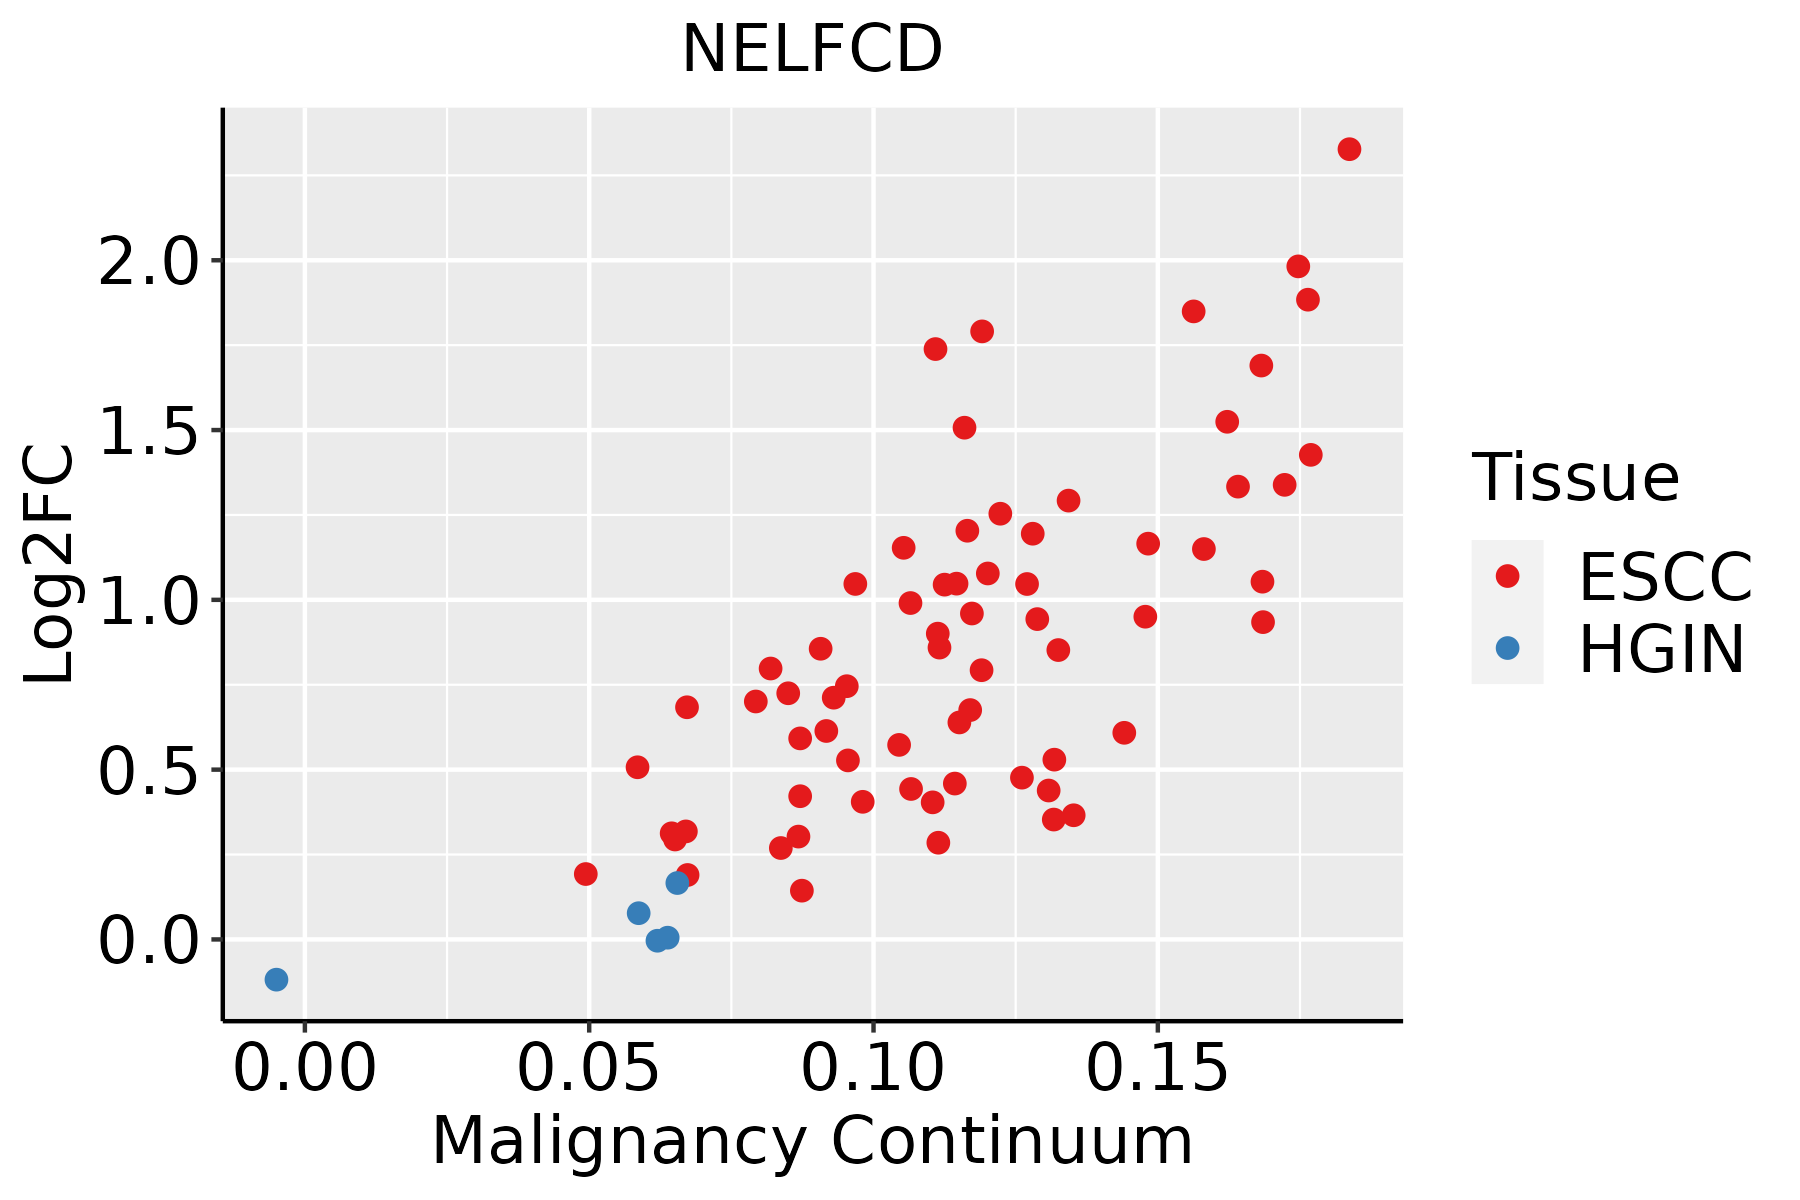 | ESCC: Esophageal squamous cell carcinoma |
| HGIN: High-grade intraepithelial neoplasias | ||
| LGIN: Low-grade intraepithelial neoplasias | ||
| Liver | 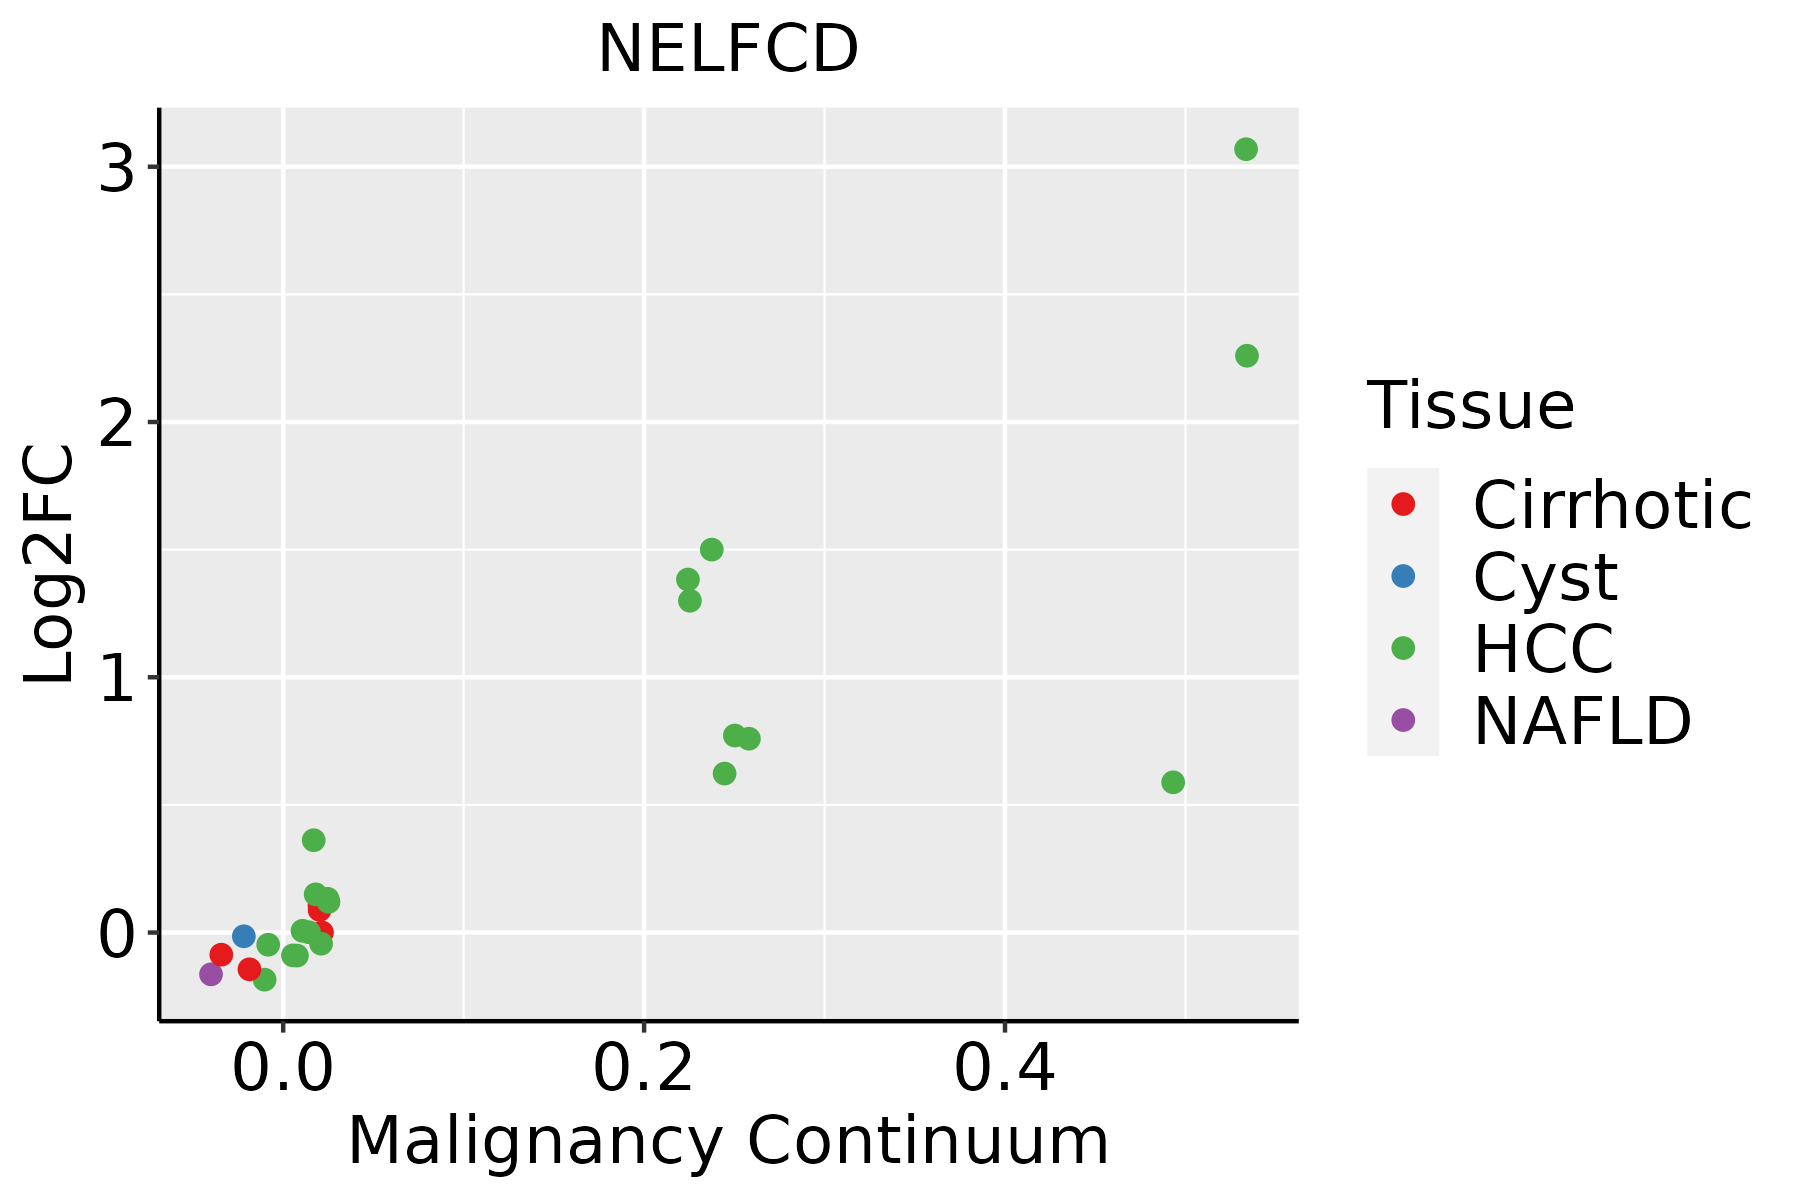 | HCC: Hepatocellular carcinoma |
| NAFLD: Non-alcoholic fatty liver disease | ||
| Oral Cavity | 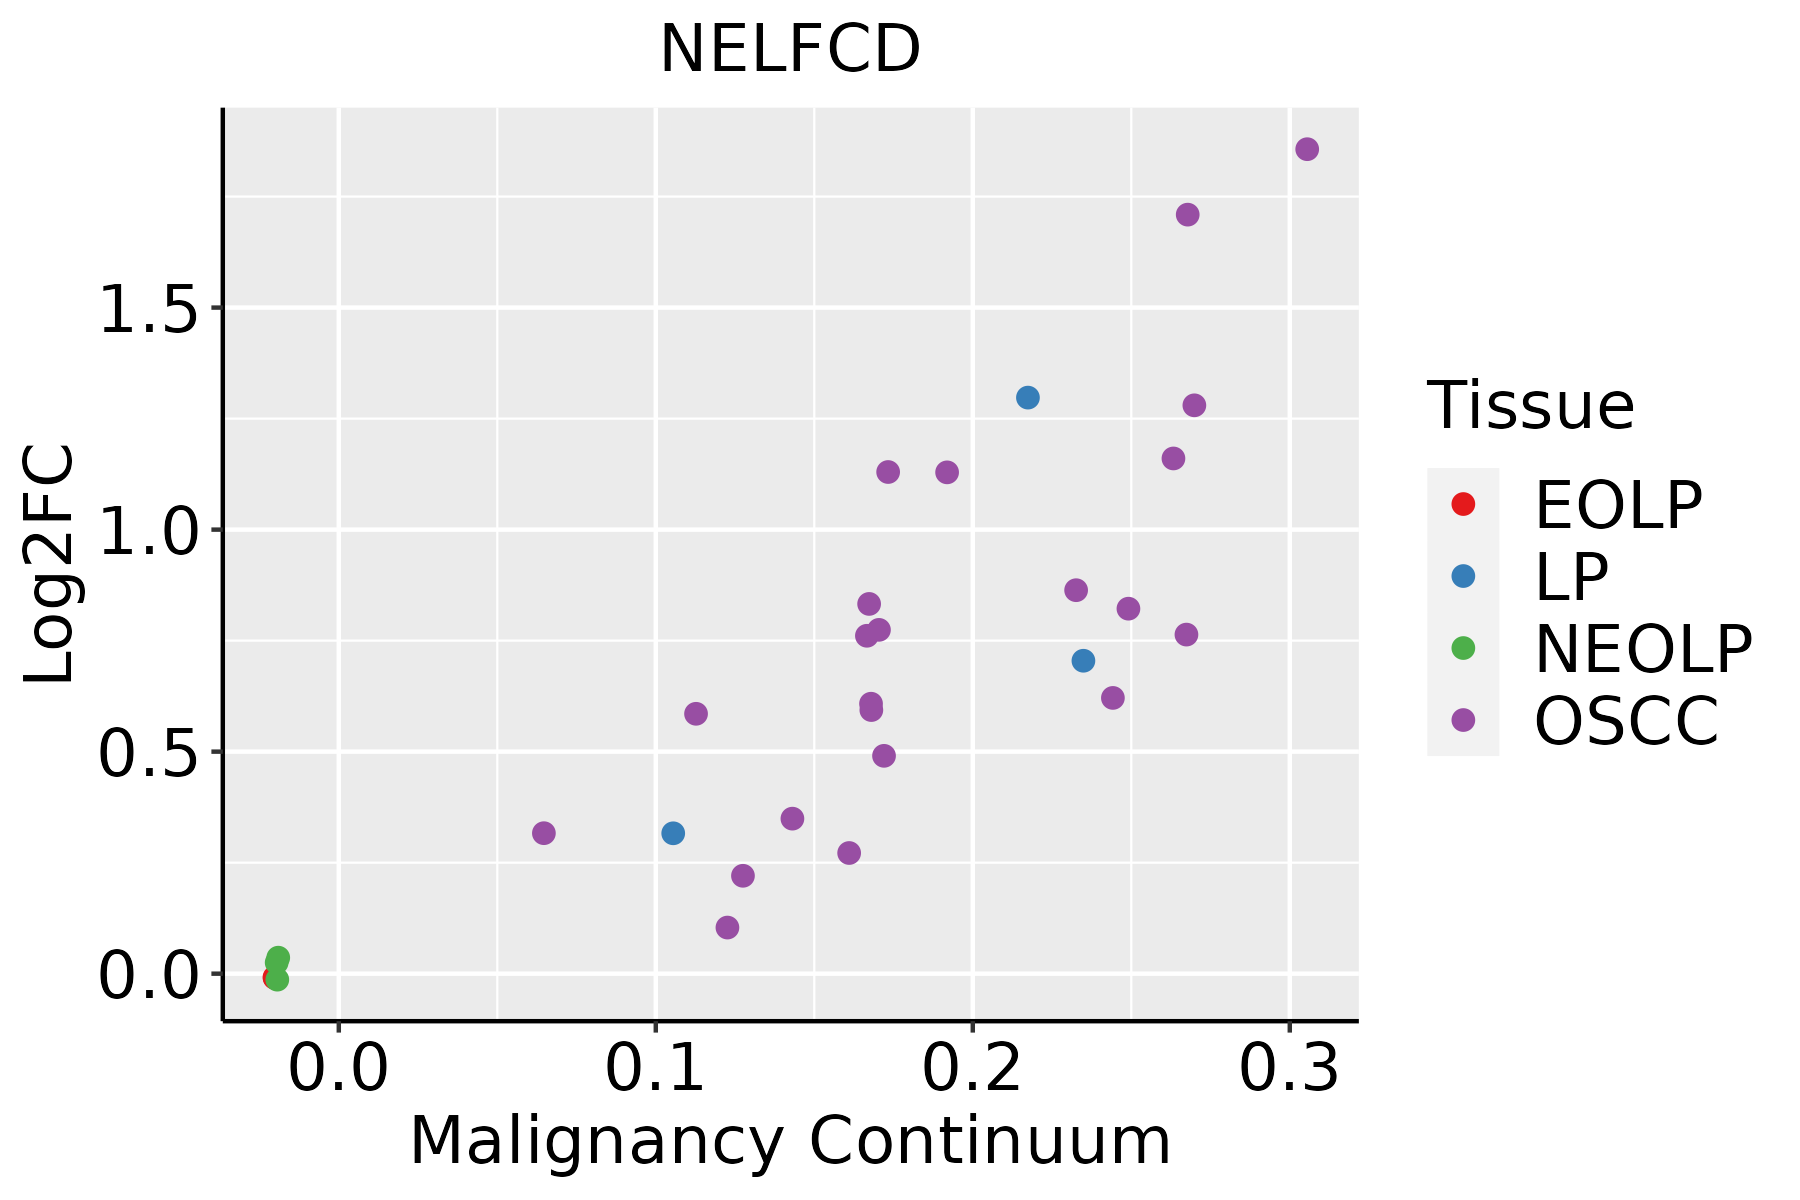 | EOLP: Erosive Oral lichen planus |
| LP: leukoplakia | ||
| NEOLP: Non-erosive oral lichen planus | ||
| OSCC: Oral squamous cell carcinoma | ||
| Skin |  | AK: Actinic keratosis |
| cSCC: Cutaneous squamous cell carcinoma | ||
| SCCIS:squamous cell carcinoma in situ | ||
| Thyroid | 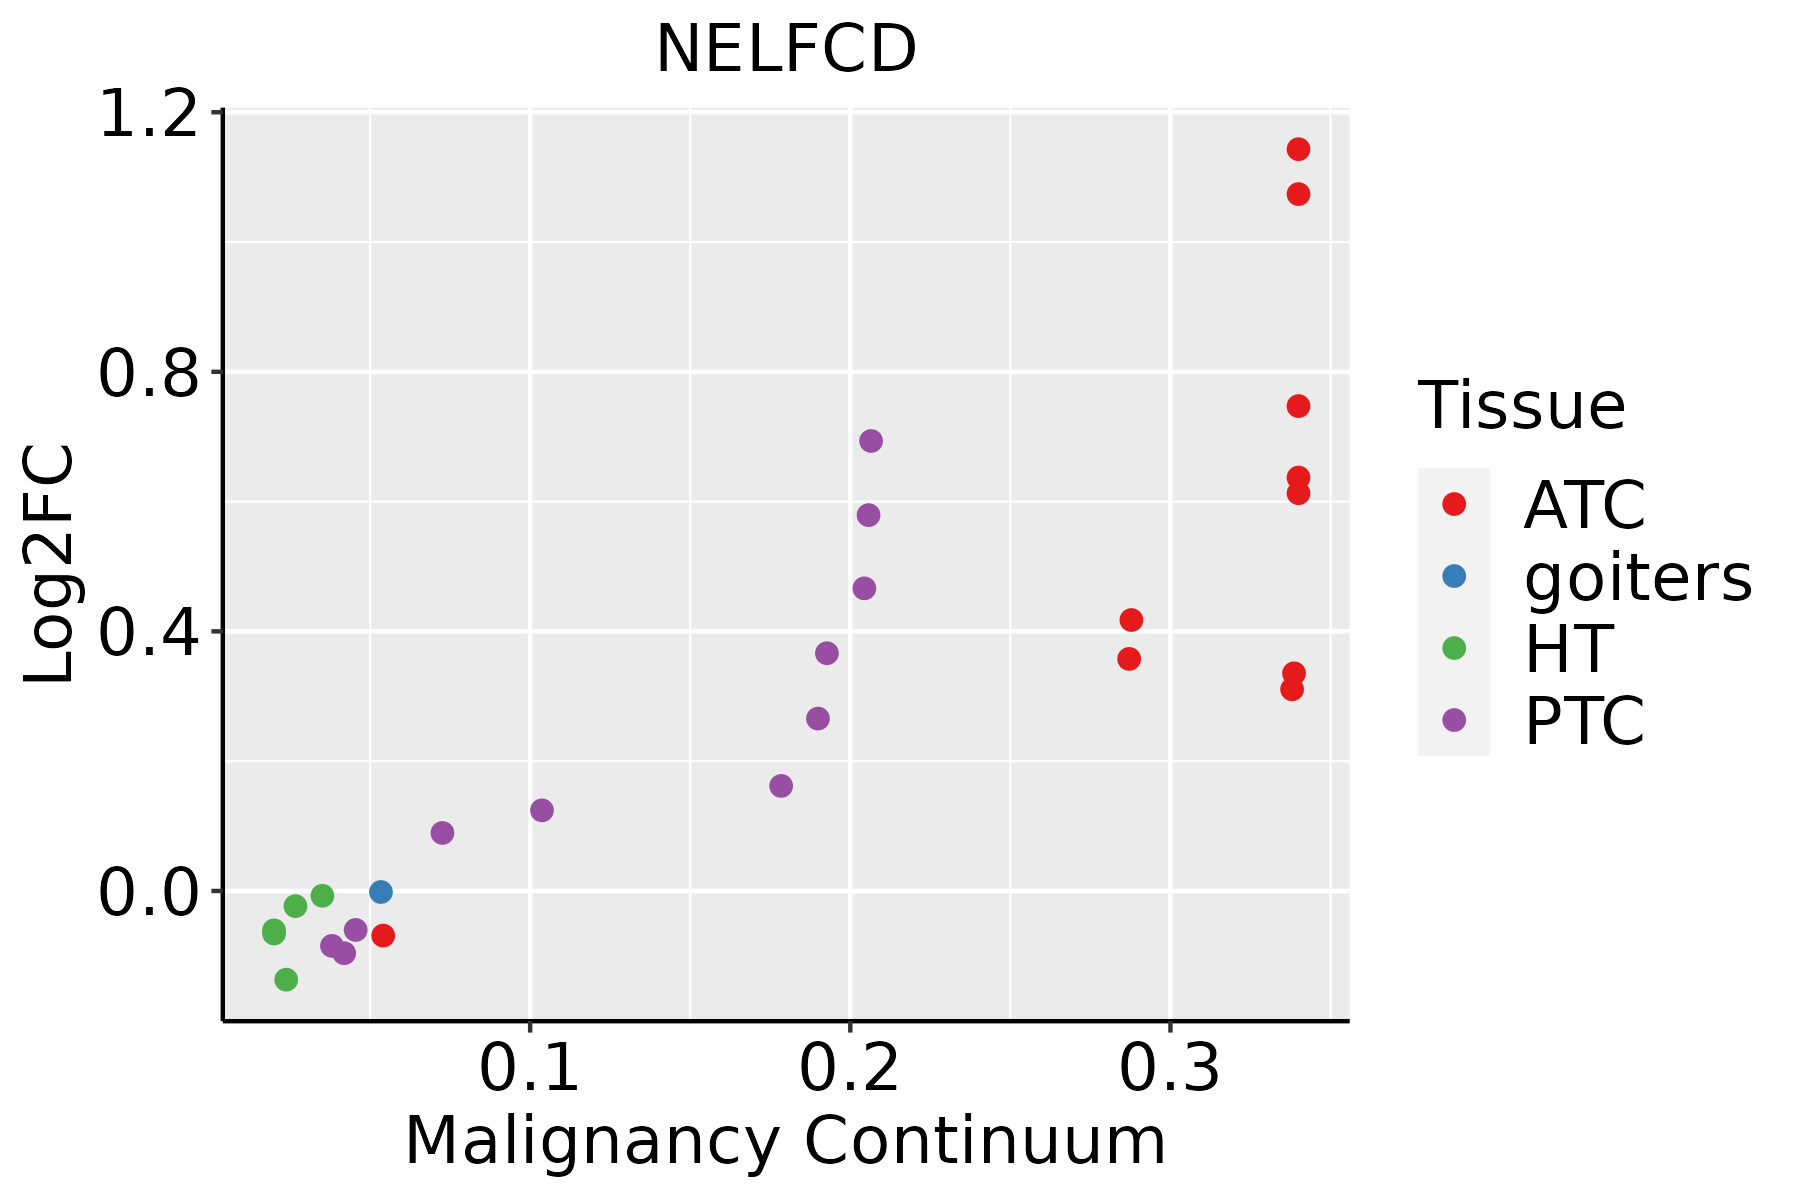 | ATC: Anaplastic thyroid cancer |
| HT: Hashimoto's thyroiditis | ||
| PTC: Papillary thyroid cancer |
| ∗log2FC in expression of this searched gene in stem-like cells from each diseased tissue sample relative to stem-like cells in normal samples in each tissue plotted against the malignancy continuum. Samples are colored based on if they are from different disease stage. |
Top |
Malignant transformation related pathway analysis |
| Find out the enriched GO biological processes and KEGG pathways involved in transition from healthy to precancer to cancer |
| Tissue | Disease Stage | Enriched GO biological Processes |
| Colorectum | AD |  |
| Colorectum | SER |  |
| Colorectum | MSS |  |
| Colorectum | MSI-H |  |
| Colorectum | FAP |  |
| ∗Top 15 enriched GO BP terms are showed in the bar plot of each disease state in each tissue. Each row represents a significant GO biological process which is colored according to the -log10(p.adjust). |
| Page: 1 2 3 4 5 6 7 8 9 |
| GO ID | Tissue | Disease Stage | Description | Gene Ratio | Bg Ratio | pvalue | p.adjust | Count |
| GO:0006354 | Colorectum | AD | DNA-templated transcription, elongation | 31/3918 | 91/18723 | 2.46e-03 | 1.90e-02 | 31 |
| GO:0006368 | Colorectum | AD | transcription elongation from RNA polymerase II promoter | 24/3918 | 69/18723 | 5.35e-03 | 3.52e-02 | 24 |
| GO:00063541 | Colorectum | MSS | DNA-templated transcription, elongation | 29/3467 | 91/18723 | 1.52e-03 | 1.39e-02 | 29 |
| GO:00063681 | Colorectum | MSS | transcription elongation from RNA polymerase II promoter | 22/3467 | 69/18723 | 5.31e-03 | 3.62e-02 | 22 |
| GO:00063682 | Colorectum | FAP | transcription elongation from RNA polymerase II promoter | 20/2622 | 69/18723 | 9.25e-04 | 9.26e-03 | 20 |
| GO:00063542 | Colorectum | FAP | DNA-templated transcription, elongation | 24/2622 | 91/18723 | 1.32e-03 | 1.22e-02 | 24 |
| GO:00063543 | Colorectum | CRC | DNA-templated transcription, elongation | 19/2078 | 91/18723 | 4.74e-03 | 3.67e-02 | 19 |
| GO:00063687 | Esophagus | HGIN | transcription elongation from RNA polymerase II promoter | 24/2587 | 69/18723 | 8.93e-06 | 2.64e-04 | 24 |
| GO:00063548 | Esophagus | HGIN | DNA-templated transcription, elongation | 27/2587 | 91/18723 | 6.62e-05 | 1.52e-03 | 27 |
| GO:00342435 | Esophagus | HGIN | regulation of transcription elongation from RNA polymerase II promoter | 13/2587 | 32/18723 | 1.72e-04 | 3.32e-03 | 13 |
| GO:00327853 | Esophagus | HGIN | negative regulation of DNA-templated transcription, elongation | 8/2587 | 18/18723 | 1.58e-03 | 1.79e-02 | 8 |
| GO:00327844 | Esophagus | HGIN | regulation of DNA-templated transcription, elongation | 16/2587 | 53/18723 | 1.58e-03 | 1.79e-02 | 16 |
| GO:00342443 | Esophagus | HGIN | negative regulation of transcription elongation from RNA polymerase II promoter | 7/2587 | 16/18723 | 3.47e-03 | 3.22e-02 | 7 |
| GO:000635414 | Esophagus | ESCC | DNA-templated transcription, elongation | 76/8552 | 91/18723 | 8.35e-14 | 4.11e-12 | 76 |
| GO:000636814 | Esophagus | ESCC | transcription elongation from RNA polymerase II promoter | 56/8552 | 69/18723 | 1.40e-09 | 3.30e-08 | 56 |
| GO:003278412 | Esophagus | ESCC | regulation of DNA-templated transcription, elongation | 45/8552 | 53/18723 | 3.64e-09 | 7.61e-08 | 45 |
| GO:003424312 | Esophagus | ESCC | regulation of transcription elongation from RNA polymerase II promoter | 28/8552 | 32/18723 | 1.02e-06 | 1.29e-05 | 28 |
| GO:003424411 | Esophagus | ESCC | negative regulation of transcription elongation from RNA polymerase II promoter | 14/8552 | 16/18723 | 6.78e-04 | 3.56e-03 | 14 |
| GO:003278511 | Esophagus | ESCC | negative regulation of DNA-templated transcription, elongation | 15/8552 | 18/18723 | 1.20e-03 | 5.88e-03 | 15 |
| GO:00063544 | Liver | Cirrhotic | DNA-templated transcription, elongation | 35/4634 | 91/18723 | 2.56e-03 | 1.53e-02 | 35 |
| Page: 1 2 3 |
| Pathway ID | Tissue | Disease Stage | Description | Gene Ratio | Bg Ratio | pvalue | p.adjust | qvalue | Count |
| hsa03250 | Colorectum | MSS | Viral life cycle - HIV-1 | 23/1875 | 63/8465 | 6.55e-03 | 2.64e-02 | 1.62e-02 | 23 |
| hsa032501 | Colorectum | MSS | Viral life cycle - HIV-1 | 23/1875 | 63/8465 | 6.55e-03 | 2.64e-02 | 1.62e-02 | 23 |
| hsa032509 | Esophagus | ESCC | Viral life cycle - HIV-1 | 54/4205 | 63/8465 | 2.01e-09 | 2.17e-08 | 1.11e-08 | 54 |
| hsa0325014 | Esophagus | ESCC | Viral life cycle - HIV-1 | 54/4205 | 63/8465 | 2.01e-09 | 2.17e-08 | 1.11e-08 | 54 |
| hsa032502 | Liver | HCC | Viral life cycle - HIV-1 | 46/4020 | 63/8465 | 3.25e-05 | 1.88e-04 | 1.04e-04 | 46 |
| hsa0325011 | Liver | HCC | Viral life cycle - HIV-1 | 46/4020 | 63/8465 | 3.25e-05 | 1.88e-04 | 1.04e-04 | 46 |
| hsa032508 | Oral cavity | OSCC | Viral life cycle - HIV-1 | 45/3704 | 63/8465 | 7.62e-06 | 3.59e-05 | 1.83e-05 | 45 |
| hsa0325013 | Oral cavity | OSCC | Viral life cycle - HIV-1 | 45/3704 | 63/8465 | 7.62e-06 | 3.59e-05 | 1.83e-05 | 45 |
| hsa0325022 | Oral cavity | LP | Viral life cycle - HIV-1 | 32/2418 | 63/8465 | 1.55e-04 | 9.08e-04 | 5.86e-04 | 32 |
| hsa0325031 | Oral cavity | LP | Viral life cycle - HIV-1 | 32/2418 | 63/8465 | 1.55e-04 | 9.08e-04 | 5.86e-04 | 32 |
| Page: 1 |
Top |
Cell-cell communication analysis |
| Identification of potential cell-cell interactions between two cell types and their ligand-receptor pairs for different disease states |
| Ligand | Receptor | LRpair | Pathway | Tissue | Disease Stage |
| Page: 1 |
Top |
Single-cell gene regulatory network inference analysis |
| Find out the significant the regulons (TFs) and the target genes of each regulon across cell types for different disease states |
| TF | Cell Type | Tissue | Disease Stage | Target Gene | RSS | Regulon Activity |
| ∗The dot plots of a searched regulon are shown for all cell subpopulations in each disease state of each tissue based on the regulon specific score inferred using pySCENIC and by calculating the average expression. |
| Page: 1 |
Top |
Somatic mutation of malignant transformation related genes |
| Annotation of somatic variants for genes involved in malignant transformation |
| Hugo Symbol | Variant Class | Variant Classification | dbSNP RS | HGVSc | HGVSp | HGVSp Short | SWISSPROT | BIOTYPE | SIFT | PolyPhen | Tumor Sample Barcode | Tissue | Histology | Sex | Age | Stage | Therapy Types | Drugs | Outcome |
| NELFCD | SNV | Missense_Mutation | novel | c.1357C>G | p.Gln453Glu | p.Q453E | protein_coding | tolerated(0.95) | possibly_damaging(0.894) | TCGA-A7-A0DB-01 | Breast | breast invasive carcinoma | Female | <65 | I/II | Hormone Therapy | arimidex | SD | |
| NELFCD | SNV | Missense_Mutation | c.517N>A | p.Glu173Lys | p.E173K | protein_coding | deleterious(0) | probably_damaging(0.992) | TCGA-B6-A0RV-01 | Breast | breast invasive carcinoma | Female | <65 | III/IV | Unknown | Unknown | SD | ||
| NELFCD | SNV | Missense_Mutation | novel | c.566N>G | p.Ser189Cys | p.S189C | protein_coding | deleterious(0) | possibly_damaging(0.889) | TCGA-D8-A73W-01 | Breast | breast invasive carcinoma | Female | >=65 | III/IV | Hormone Therapy | tamoxiphen | PD | |
| NELFCD | SNV | Missense_Mutation | c.1577N>A | p.Arg526Gln | p.R526Q | protein_coding | tolerated(0.09) | benign(0.393) | TCGA-OL-A66N-01 | Breast | breast invasive carcinoma | Female | <65 | III/IV | Unknown | Unknown | SD | ||
| NELFCD | SNV | Missense_Mutation | novel | c.1241N>T | p.Ser414Phe | p.S414F | protein_coding | deleterious(0.01) | possibly_damaging(0.567) | TCGA-XX-A89A-01 | Breast | breast invasive carcinoma | Female | >=65 | I/II | Unknown | Unknown | SD | |
| NELFCD | SNV | Missense_Mutation | rs147835273 | c.827N>A | p.Arg276His | p.R276H | protein_coding | tolerated(0.08) | possibly_damaging(0.603) | TCGA-2W-A8YY-01 | Cervix | cervical & endocervical cancer | Female | <65 | I/II | Chemotherapy | cisplatin | CR | |
| NELFCD | SNV | Missense_Mutation | novel | c.1619N>A | p.Arg540His | p.R540H | protein_coding | deleterious(0) | probably_damaging(0.998) | TCGA-2W-A8YY-01 | Cervix | cervical & endocervical cancer | Female | <65 | I/II | Chemotherapy | cisplatin | CR | |
| NELFCD | SNV | Missense_Mutation | c.537N>C | p.Leu179Phe | p.L179F | protein_coding | deleterious(0.01) | probably_damaging(0.999) | TCGA-C5-A1BN-01 | Cervix | cervical & endocervical cancer | Female | <65 | I/II | Chemotherapy | cisplatin | PD | ||
| NELFCD | SNV | Missense_Mutation | novel | c.1487N>C | p.Met496Thr | p.M496T | protein_coding | deleterious(0) | benign(0.249) | TCGA-EA-A410-01 | Cervix | cervical & endocervical cancer | Female | <65 | I/II | Unknown | Unknown | SD | |
| NELFCD | SNV | Missense_Mutation | c.688N>C | p.Glu230Gln | p.E230Q | protein_coding | tolerated(0.62) | possibly_damaging(0.478) | TCGA-IR-A3LA-01 | Cervix | cervical & endocervical cancer | Female | <65 | I/II | Chemotherapy | cisplatin | CR |
| Page: 1 2 3 4 5 6 7 |
Top |
Related drugs of malignant transformation related genes |
| Identification of chemicals and drugs interact with genes involved in malignant transfromation |
| (DGIdb 4.0) |
| Entrez ID | Symbol | Category | Interaction Types | Drug Claim Name | Drug Name | PMIDs |
| 51497 | NELFCD | KINASE | diuretics | |||
| 51497 | NELFCD | KINASE | Thiazides, plain | |||
| 51497 | NELFCD | KINASE | hydrochlorothiazide | HYDROCHLOROTHIAZIDE |
| Page: 1 |

Copyright 2023-Present -The University of Texas Health Science Center at Houston |