Schematic overview of the cellular and molecular mechanisms involved in the cancer progression, including the proposed cellular and molecular mechanisms in cancer cells trajectory. AT1: alveolar type 1 cells; AT2: alveolar type 2 cells; AAH: atypical adenomatous hyperplasia; AIS: adenocarcinoma in situ; MIA: minimally invasive adenocarcinoma; IA: invasive adenocarcinoma; EMT: epithelial-mesenchymal transition

Home

Download

Statistics

Help

Contact

Center for Computational Systems Medicine
leaf

Gene summary

leaf

Malignant transformation analysis

leaf

Malignant transformation related pathway analysis

leaf

Cell-cell communication analysis

leaf

Single-cell gene regulatory network inference analysis

leaf

Somatic mutation of malignant transformation related genes

leaf

Related drugs of malignant transformation related genes

Gene: NELFB

Gene summary for NELFB

check button Gene summary.

Gene informationSpeciesHuman
Gene symbol

NELFB

Gene ID

25920

Gene namenegative elongation factor complex member B
Gene AliasCOBRA1
Cytomap9q34.3
Gene Typeprotein-coding
GO ID

GO:0006139

UniProtAcc

Q8WX92


Top

Malignant transformation analysis

check button Identification of the aberrant gene expression in precancerous and cancerous lesions by comparing the gene expression of stem-like cells in diseased tissues with normal stem cells
check button Malignant transformation involving gene list.
Entrez IDSymbolReplicatesSpeciesOrganTissueAdj P-valueLog2FCMalignancy
25920NELFBLZE7THumanEsophagusESCC9.99e-051.70e-010.0667
25920NELFBLZE20THumanEsophagusESCC5.70e-112.80e-010.0662
25920NELFBLZE24THumanEsophagusESCC1.02e-031.03e-010.0596
25920NELFBP2T-EHumanEsophagusESCC1.88e-131.72e-010.1177
25920NELFBP4T-EHumanEsophagusESCC2.22e-142.67e-010.1323
25920NELFBP5T-EHumanEsophagusESCC4.71e-141.42e-010.1327
25920NELFBP8T-EHumanEsophagusESCC1.13e-193.34e-010.0889
25920NELFBP9T-EHumanEsophagusESCC1.62e-039.45e-020.1131
25920NELFBP10T-EHumanEsophagusESCC3.95e-071.54e-010.116
25920NELFBP11T-EHumanEsophagusESCC1.04e-061.76e-010.1426
25920NELFBP12T-EHumanEsophagusESCC6.03e-085.57e-020.1122
25920NELFBP15T-EHumanEsophagusESCC3.01e-041.42e-010.1149
25920NELFBP16T-EHumanEsophagusESCC1.84e-032.75e-020.1153
25920NELFBP19T-EHumanEsophagusESCC3.02e-032.21e-010.1662
25920NELFBP20T-EHumanEsophagusESCC2.54e-022.71e-020.1124
25920NELFBP21T-EHumanEsophagusESCC6.03e-163.43e-010.1617
25920NELFBP22T-EHumanEsophagusESCC1.90e-049.58e-020.1236
25920NELFBP23T-EHumanEsophagusESCC4.40e-061.60e-010.108
25920NELFBP24T-EHumanEsophagusESCC1.95e-042.27e-010.1287
25920NELFBP26T-EHumanEsophagusESCC2.40e-028.10e-020.1276
Page: 1 2 3 4 5 6 

check button Transcriptomic changes along malignancy continuum.
TissueExpression DynamicsAbbreviation
EsophagusThe image shows the transcriptomic changes along malignancy continuum.log2FC in expression of this searched gene in stem-like cells from each diseased tissue sample relative to stem-like cells in normal samples in each tissue plotted against the malignancy continuum. Samples are colored based on if they are from different disease stage.
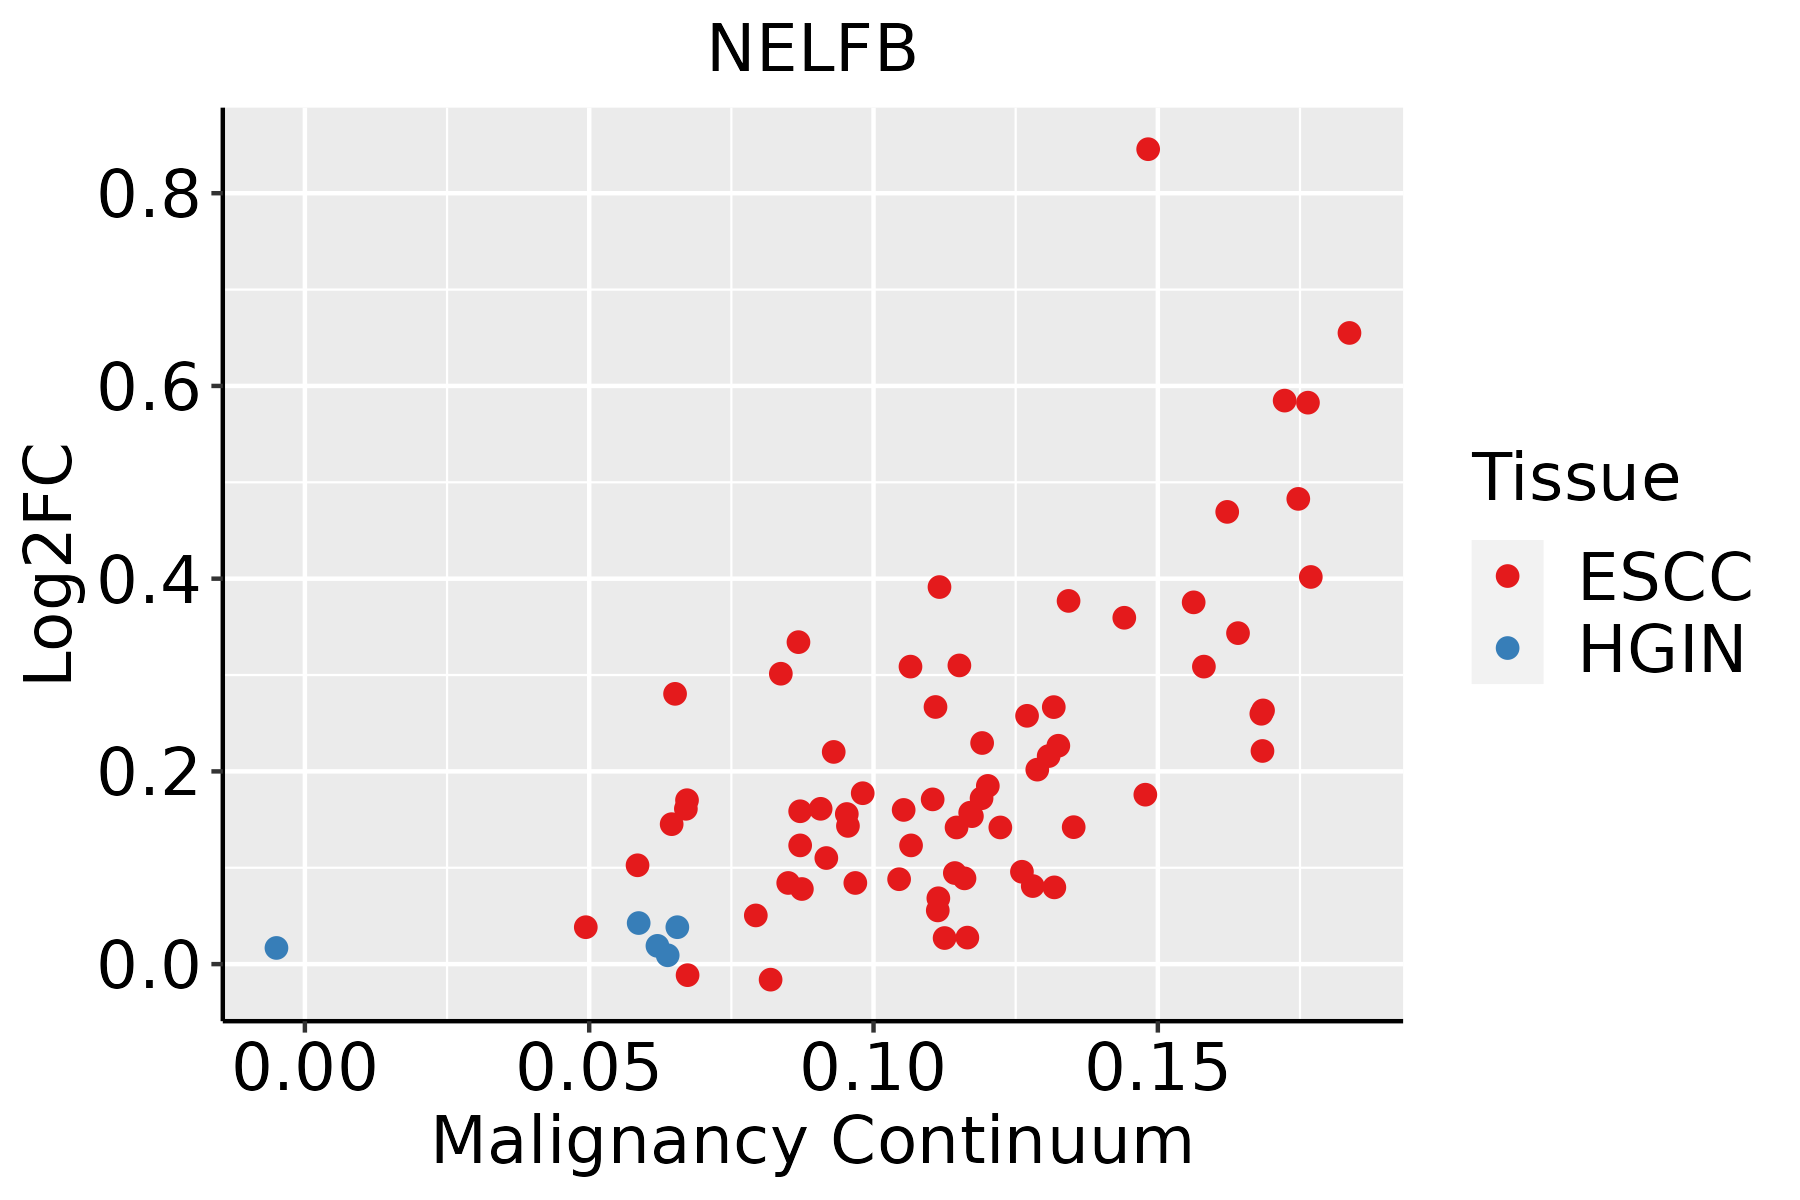
ESCC: Esophageal squamous cell carcinoma
HGIN: High-grade intraepithelial neoplasias
LGIN: Low-grade intraepithelial neoplasias
LiverThe image shows the transcriptomic changes along malignancy continuum.log2FC in expression of this searched gene in stem-like cells from each diseased tissue sample relative to stem-like cells in normal samples in each tissue plotted against the malignancy continuum. Samples are colored based on if they are from different disease stage.HCC: Hepatocellular carcinoma
NAFLD: Non-alcoholic fatty liver disease
Oral CavityThe image shows the transcriptomic changes along malignancy continuum.log2FC in expression of this searched gene in stem-like cells from each diseased tissue sample relative to stem-like cells in normal samples in each tissue plotted against the malignancy continuum. Samples are colored based on if they are from different disease stage.
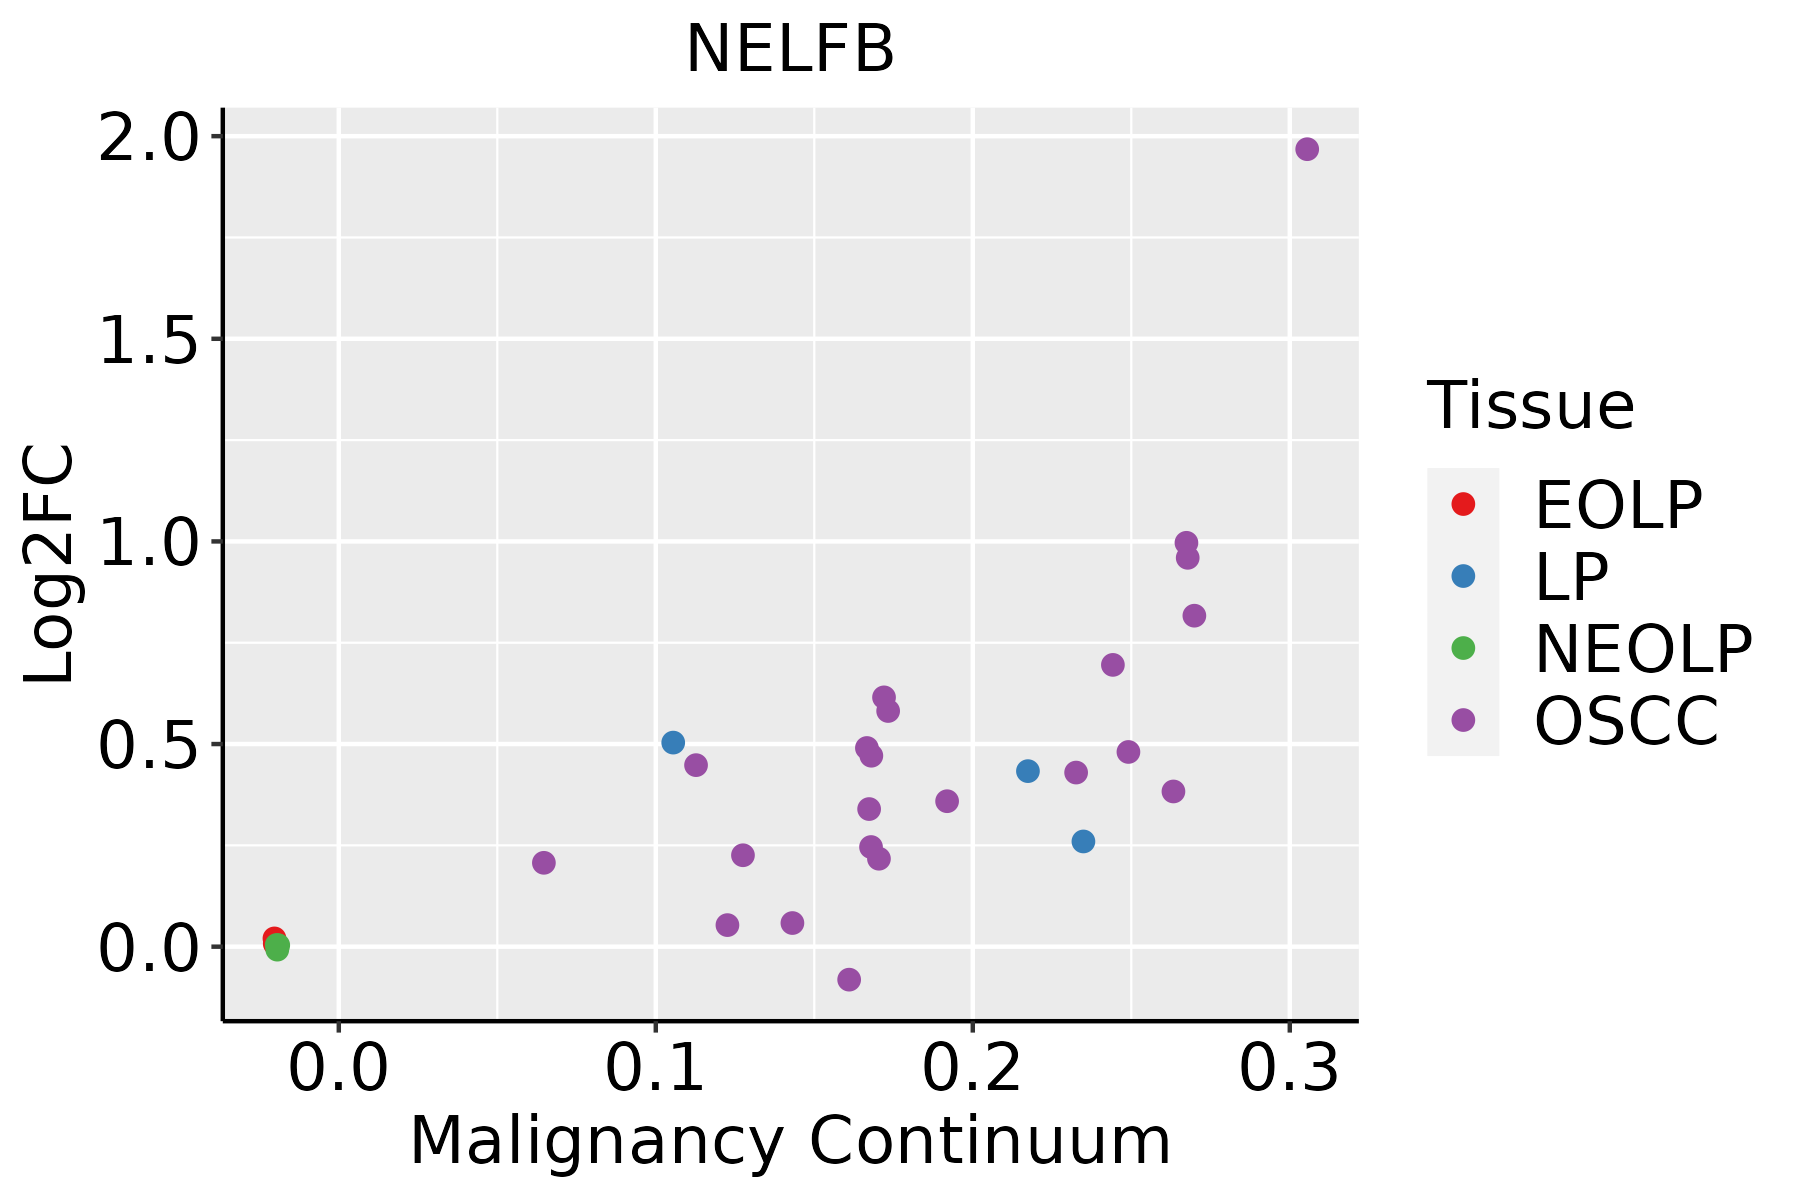
EOLP: Erosive Oral lichen planus
LP: leukoplakia
NEOLP: Non-erosive oral lichen planus
OSCC: Oral squamous cell carcinoma
SkinThe image shows the transcriptomic changes along malignancy continuum.log2FC in expression of this searched gene in stem-like cells from each diseased tissue sample relative to stem-like cells in normal samples in each tissue plotted against the malignancy continuum. Samples are colored based on if they are from different disease stage.
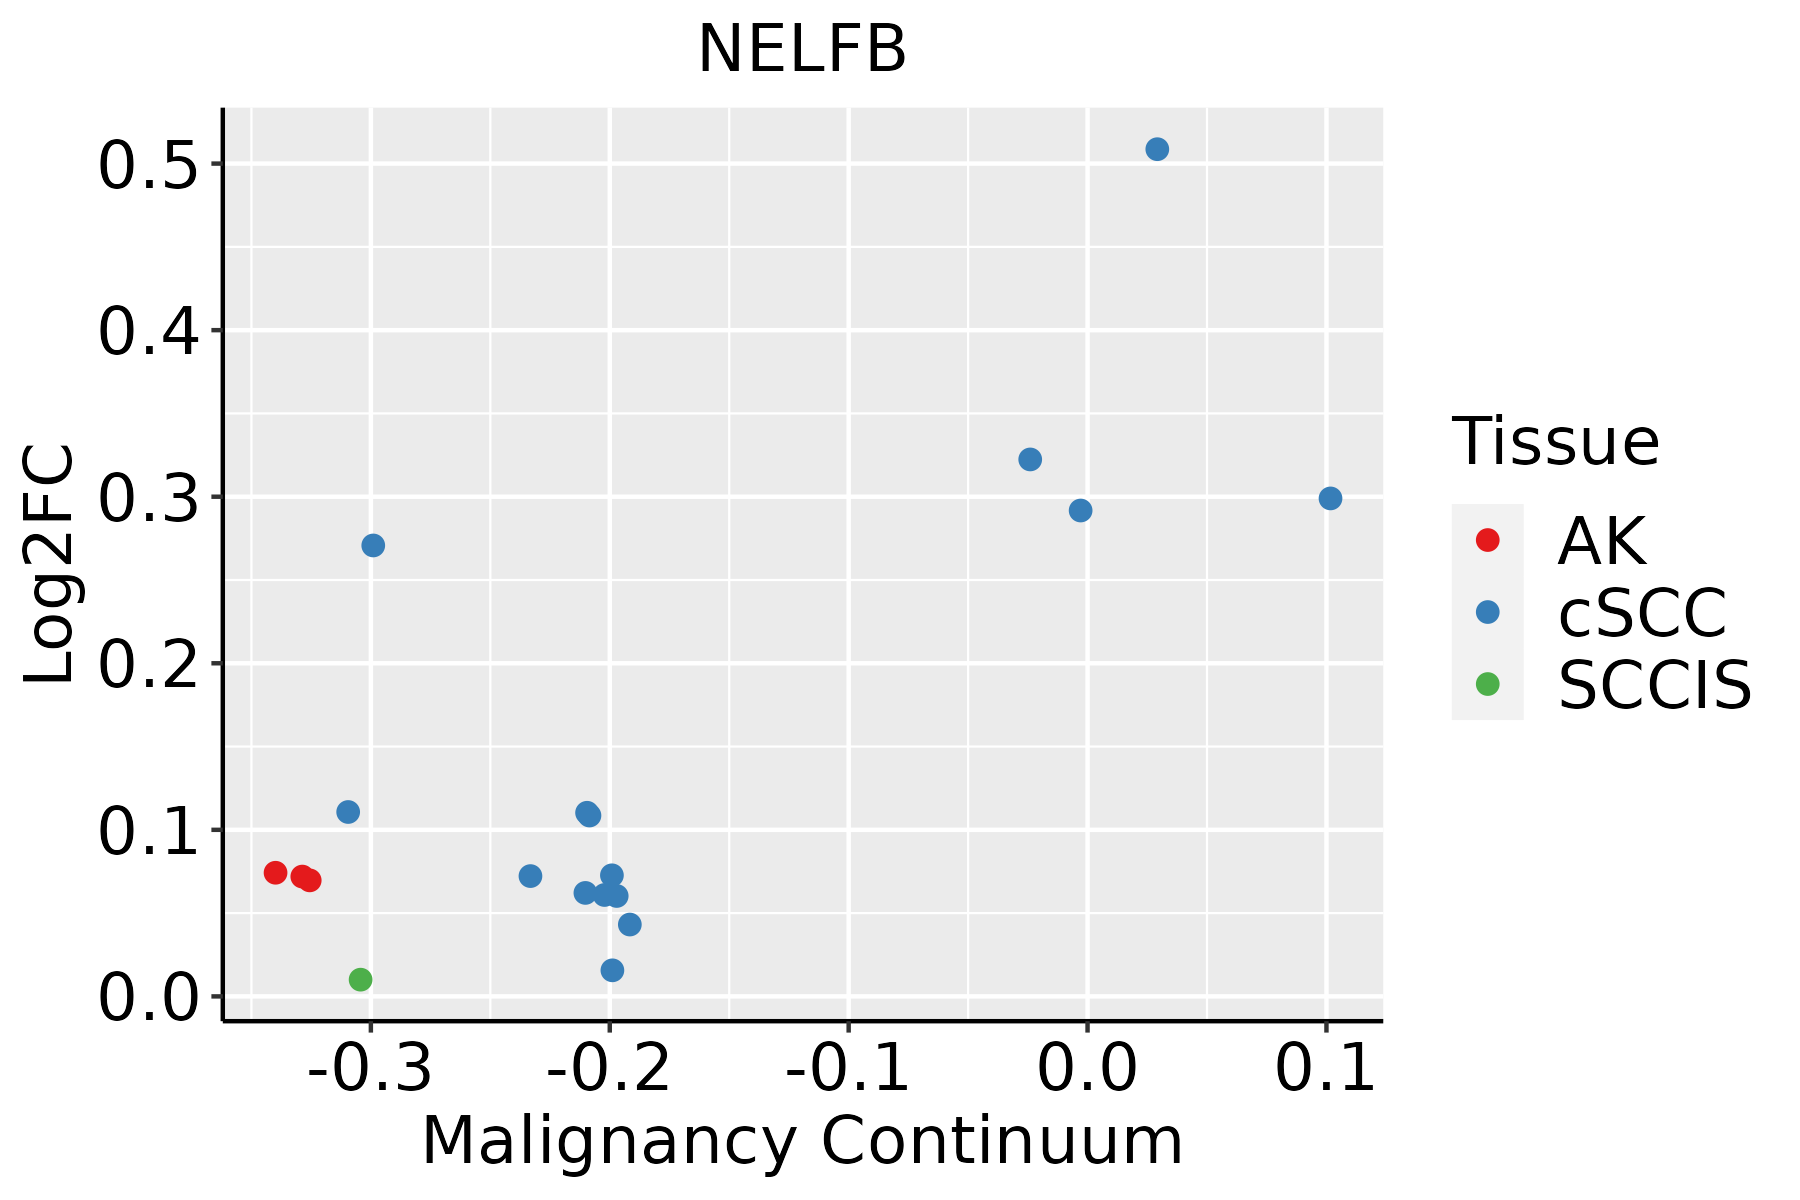
AK: Actinic keratosis
cSCC: Cutaneous squamous cell carcinoma
SCCIS:squamous cell carcinoma in situ
ThyroidThe image shows the transcriptomic changes along malignancy continuum.log2FC in expression of this searched gene in stem-like cells from each diseased tissue sample relative to stem-like cells in normal samples in each tissue plotted against the malignancy continuum. Samples are colored based on if they are from different disease stage.
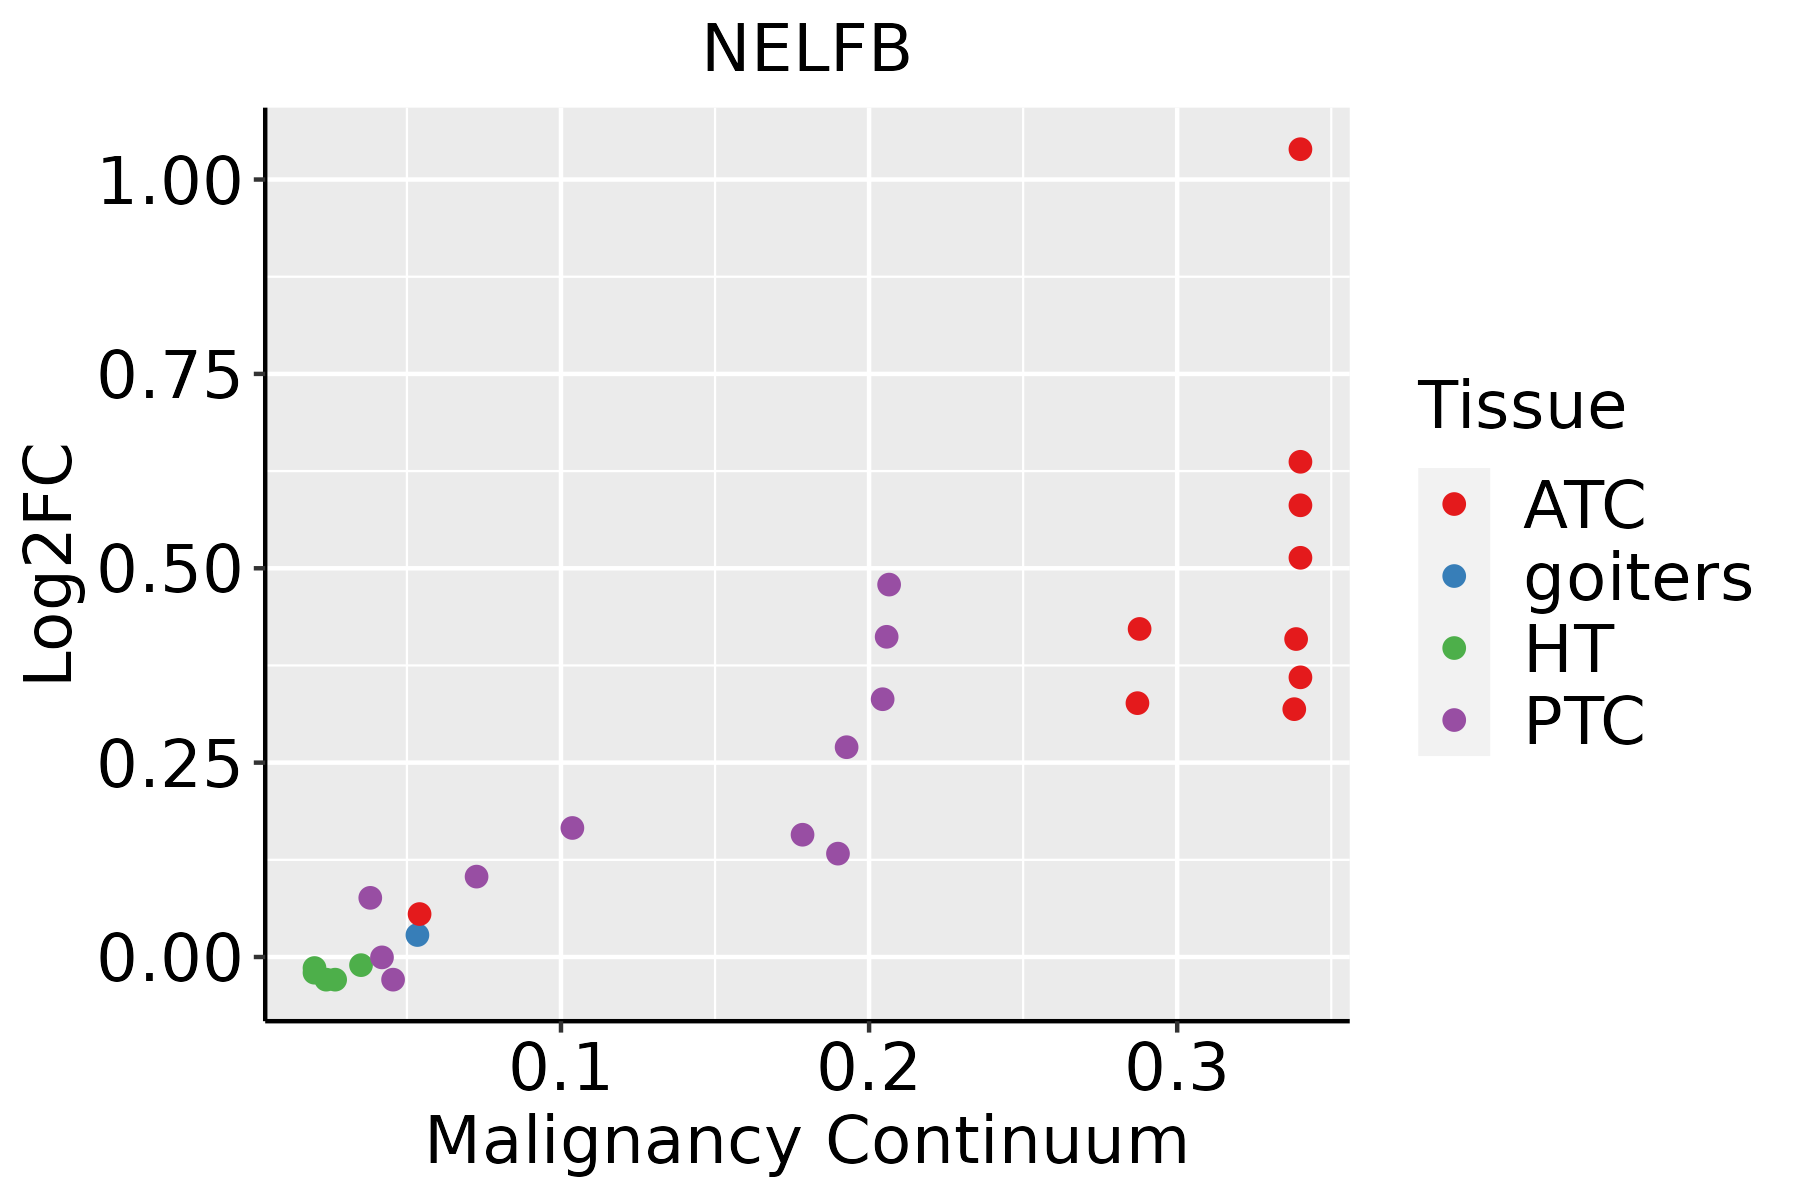
ATC: Anaplastic thyroid cancer
HT: Hashimoto's thyroiditis
PTC: Papillary thyroid cancer
∗log2FC in expression of this searched gene in stem-like cells from each diseased tissue sample relative to stem-like cells in normal samples in each tissue plotted against the malignancy continuum. Samples are colored based on if they are from different disease stage.

Top

Malignant transformation related pathway analysis

check buttonFind out the enriched GO biological processes and KEGG pathways involved in transition from healthy to precancer to cancer
check button Figure of enriched GO biological processes.
TissueDisease StageEnriched GO biological Processes
ColorectumADGO analysis - Figure of enriched GO biological processes: Top 15 enriched GO BP terms are showed in the bar plot of each disease state in each tissue. Each row represents a significant GO biological process which is colored according to the -log10(p.adjust).
ColorectumSERGO analysis - Figure of enriched GO biological processes: Top 15 enriched GO BP terms are showed in the bar plot of each disease state in each tissue. Each row represents a significant GO biological process which is colored according to the -log10(p.adjust).
ColorectumMSSGO analysis - Figure of enriched GO biological processes: Top 15 enriched GO BP terms are showed in the bar plot of each disease state in each tissue. Each row represents a significant GO biological process which is colored according to the -log10(p.adjust).
ColorectumMSI-HGO analysis - Figure of enriched GO biological processes: Top 15 enriched GO BP terms are showed in the bar plot of each disease state in each tissue. Each row represents a significant GO biological process which is colored according to the -log10(p.adjust).
ColorectumFAPGO analysis - Figure of enriched GO biological processes: Top 15 enriched GO BP terms are showed in the bar plot of each disease state in each tissue. Each row represents a significant GO biological process which is colored according to the -log10(p.adjust).
∗Top 15 enriched GO BP terms are showed in the bar plot of each disease state in each tissue. Each row represents a significant GO biological process which is colored according to the -log10(p.adjust).
Page: 1 2 3 4 5 6 7 8 9 

check button Enriched GO biological processes.
GO IDTissueDisease StageDescriptionGene RatioBg Ratiopvaluep.adjustCount
GO:000635414EsophagusESCCDNA-templated transcription, elongation76/855291/187238.35e-144.11e-1276
GO:000636814EsophagusESCCtranscription elongation from RNA polymerase II promoter56/855269/187231.40e-093.30e-0856
GO:003278412EsophagusESCCregulation of DNA-templated transcription, elongation45/855253/187233.64e-097.61e-0845
GO:003424312EsophagusESCCregulation of transcription elongation from RNA polymerase II promoter28/855232/187231.02e-061.29e-0528
GO:00488638EsophagusESCCstem cell differentiation122/8552206/187235.95e-054.59e-04122
GO:003424411EsophagusESCCnegative regulation of transcription elongation from RNA polymerase II promoter14/855216/187236.78e-043.56e-0314
GO:200073614EsophagusESCCregulation of stem cell differentiation39/855258/187237.43e-043.86e-0339
GO:003278511EsophagusESCCnegative regulation of DNA-templated transcription, elongation15/855218/187231.20e-035.88e-0315
GO:200073714EsophagusESCCnegative regulation of stem cell differentiation17/855223/187235.73e-032.13e-0217
GO:20007361LiverCirrhoticregulation of stem cell differentiation26/463458/187236.65e-045.04e-0326
GO:20007371LiverCirrhoticnegative regulation of stem cell differentiation13/463423/187231.12e-037.70e-0313
GO:00063544LiverCirrhoticDNA-templated transcription, elongation35/463491/187232.56e-031.53e-0235
GO:00063683LiverCirrhotictranscription elongation from RNA polymerase II promoter28/463469/187232.70e-031.58e-0228
GO:004886311LiverCirrhoticstem cell differentiation66/4634206/187231.06e-024.68e-0266
GO:000635411LiverHCCDNA-templated transcription, elongation64/795891/187237.00e-081.44e-0664
GO:000636811LiverHCCtranscription elongation from RNA polymerase II promoter50/795869/187234.32e-077.22e-0650
GO:0032784LiverHCCregulation of DNA-templated transcription, elongation39/795853/187234.34e-065.53e-0539
GO:0034243LiverHCCregulation of transcription elongation from RNA polymerase II promoter25/795832/187234.38e-054.26e-0425
GO:0034244LiverHCCnegative regulation of transcription elongation from RNA polymerase II promoter12/795816/187238.74e-033.40e-0212
GO:0032785LiverHCCnegative regulation of DNA-templated transcription, elongation13/795818/187231.05e-023.89e-0213
Page: 1 2 3 

check button Enriched KEGG pathways.
Pathway IDTissueDisease StageDescriptionGene RatioBg Ratiopvaluep.adjustqvalueCount
hsa032509EsophagusESCCViral life cycle - HIV-154/420563/84652.01e-092.17e-081.11e-0854
hsa0325014EsophagusESCCViral life cycle - HIV-154/420563/84652.01e-092.17e-081.11e-0854
hsa032502LiverHCCViral life cycle - HIV-146/402063/84653.25e-051.88e-041.04e-0446
hsa0325011LiverHCCViral life cycle - HIV-146/402063/84653.25e-051.88e-041.04e-0446
hsa032508Oral cavityOSCCViral life cycle - HIV-145/370463/84657.62e-063.59e-051.83e-0545
hsa0325013Oral cavityOSCCViral life cycle - HIV-145/370463/84657.62e-063.59e-051.83e-0545
Page: 1 

Top

Cell-cell communication analysis

check buttonIdentification of potential cell-cell interactions between two cell types and their ligand-receptor pairs for different disease states
LigandReceptorLRpairPathwayTissueDisease Stage
Page: 1 

Top

Single-cell gene regulatory network inference analysis

check buttonFind out the significant the regulons (TFs) and the target genes of each regulon across cell types for different disease states
TFCell TypeTissueDisease StageTarget GeneRSSRegulon Activity
NELFBCD4TNBreastADJMB21D2,ATP6V1C1,GABPA, etc.5.34e-02The dot plots of a searched regulon are shown for all cell subpopulations in each disease state of each tissue based on the regulon specific score inferred using pySCENIC and by calculating the average expression.
NELFBTH17BreastDCISMB21D2,ATP6V1C1,GABPA, etc.2.24e-02The dot plots of a searched regulon are shown for all cell subpopulations in each disease state of each tissue based on the regulon specific score inferred using pySCENIC and by calculating the average expression.
NELFBM2MACBreastDCISMB21D2,ATP6V1C1,GABPA, etc.0.00e+00The dot plots of a searched regulon are shown for all cell subpopulations in each disease state of each tissue based on the regulon specific score inferred using pySCENIC and by calculating the average expression.
NELFBMONBreastDCISMB21D2,ATP6V1C1,GABPA, etc.0.00e+00The dot plots of a searched regulon are shown for all cell subpopulations in each disease state of each tissue based on the regulon specific score inferred using pySCENIC and by calculating the average expression.
NELFBGCBreastHealthyMB21D2,ATP6V1C1,GABPA, etc.-4.44e-16The dot plots of a searched regulon are shown for all cell subpopulations in each disease state of each tissue based on the regulon specific score inferred using pySCENIC and by calculating the average expression.
NELFBTFHBreastHealthyMB21D2,ATP6V1C1,GABPA, etc.1.63e-02The dot plots of a searched regulon are shown for all cell subpopulations in each disease state of each tissue based on the regulon specific score inferred using pySCENIC and by calculating the average expression.
NELFBCD8TRMBreastIDCMB21D2,ATP6V1C1,GABPA, etc.6.82e-04The dot plots of a searched regulon are shown for all cell subpopulations in each disease state of each tissue based on the regulon specific score inferred using pySCENIC and by calculating the average expression.
NELFBNKBreastPrecancerMB21D2,ATP6V1C1,GABPA, etc.4.38e-02The dot plots of a searched regulon are shown for all cell subpopulations in each disease state of each tissue based on the regulon specific score inferred using pySCENIC and by calculating the average expression.
NELFBCD8TEXBreastPrecancerMB21D2,ATP6V1C1,GABPA, etc.0.00e+00The dot plots of a searched regulon are shown for all cell subpopulations in each disease state of each tissue based on the regulon specific score inferred using pySCENIC and by calculating the average expression.
NELFBCD4TNBreastPrecancerMB21D2,ATP6V1C1,GABPA, etc.0.00e+00The dot plots of a searched regulon are shown for all cell subpopulations in each disease state of each tissue based on the regulon specific score inferred using pySCENIC and by calculating the average expression.
∗The dot plots of a searched regulon are shown for all cell subpopulations in each disease state of each tissue based on the regulon specific score inferred using pySCENIC and by calculating the average expression.
Page: 1 2 

Top

Somatic mutation of malignant transformation related genes

check buttonAnnotation of somatic variants for genes involved in malignant transformation
Hugo SymbolVariant ClassVariant ClassificationdbSNP RSHGVScHGVSpHGVSp ShortSWISSPROTBIOTYPESIFTPolyPhenTumor Sample BarcodeTissueHistologySexAgeStageTherapy TypesDrugsOutcome
NELFBSNVMissense_Mutationnovelc.1053N>Tp.Met351Ilep.M351Iprotein_codingdeleterious(0.04)possibly_damaging(0.73)TCGA-BH-A0B6-01Breastbreast invasive carcinomaFemale<65I/IIUnknownUnknownSD
NELFBSNVMissense_Mutationnovelc.1618N>Cp.Thr540Prop.T540Pprotein_codingtolerated(0.28)benign(0.007)TCGA-BH-A0BR-01Breastbreast invasive carcinomaFemale<65I/IIUnknownUnknownSD
NELFBdeletionIn_Frame_Delc.1507_1521delTTGGCCTTTGGCGACp.Leu503_Asp507delp.L503_D507delprotein_codingTCGA-A2-A0CM-01Breastbreast invasive carcinomaFemale<65I/IIChemotherapyadriamycinPD
NELFBdeletionFrame_Shift_Delnovelc.1416delNp.Leu474CysfsTer112p.L474Cfs*112protein_codingTCGA-D8-A27V-01Breastbreast invasive carcinomaFemale<65I/IIHormone TherapytamoxiphenSD
NELFBSNVMissense_Mutationnovelc.1880N>Ap.Pro627Glnp.P627Qprotein_codingdeleterious_low_confidence(0.03)benign(0.054)TCGA-Q1-A73R-01Cervixcervical & endocervical cancerFemale<65I/IIUnknownUnknownSD
NELFBSNVMissense_Mutationnovelc.1769N>Tp.Ser590Phep.S590Fprotein_codingdeleterious(0.01)possibly_damaging(0.546)TCGA-ZX-AA5X-01Cervixcervical & endocervical cancerFemale<65III/IVUnknownUnknownSD
NELFBSNVMissense_Mutationrs755651433c.1471N>Tp.Arg491Cysp.R491Cprotein_codingdeleterious(0)possibly_damaging(0.888)TCGA-A6-5665-01Colorectumcolon adenocarcinomaFemale>=65I/IIUnknownUnknownPD
NELFBSNVMissense_Mutationc.833N>Ap.Arg278Glnp.R278Qprotein_codingtolerated(0.05)benign(0.411)TCGA-AA-3672-01Colorectumcolon adenocarcinomaFemale>=65III/IVUnknownUnknownSD
NELFBSNVMissense_Mutationrs867374875c.1562N>Tp.Ala521Valp.A521Vprotein_codingtolerated(0.19)benign(0.049)TCGA-AZ-6601-01Colorectumcolon adenocarcinomaMale>=65I/IIUnknownUnknownPD
NELFBSNVMissense_Mutationrs760276299c.827N>Ap.Arg276Hisp.R276Hprotein_codingdeleterious(0)probably_damaging(0.988)TCGA-EI-6917-01Colorectumrectum adenocarcinomaMale<65III/IVChemotherapy5fluorouracil+oxaciplatina+l-folinianSD
Page: 1 2 3 4 5 6 

Top

Related drugs of malignant transformation related genes

check buttonIdentification of chemicals and drugs interact with genes involved in malignant transfromation
(DGIdb 4.0)
Entrez IDSymbolCategoryInteraction TypesDrug Claim NameDrug NamePMIDs
Page: 1