
|
|||||
|
 | |
| |
| |
| |
| |
| |
|
Gene: NELFA |
Gene summary for NELFA |
| Gene information | Species | Human | Gene symbol | NELFA | Gene ID | 7469 |
| Gene name | negative elongation factor complex member A | |
| Gene Alias | NELF-A | |
| Cytomap | 4p16.3 | |
| Gene Type | protein-coding | GO ID | GO:0006139 | UniProtAcc | A0A0C4DFX9 |
Top |
Malignant transformation analysis |
| Identification of the aberrant gene expression in precancerous and cancerous lesions by comparing the gene expression of stem-like cells in diseased tissues with normal stem cells |
| Entrez ID | Symbol | Replicates | Species | Organ | Tissue | Adj P-value | Log2FC | Malignancy |
| 7469 | NELFA | LZE4T | Human | Esophagus | ESCC | 4.19e-04 | 9.09e-02 | 0.0811 |
| 7469 | NELFA | LZE7T | Human | Esophagus | ESCC | 1.87e-10 | 6.20e-01 | 0.0667 |
| 7469 | NELFA | LZE8T | Human | Esophagus | ESCC | 2.55e-10 | 2.95e-01 | 0.067 |
| 7469 | NELFA | LZE20T | Human | Esophagus | ESCC | 4.62e-08 | 3.81e-01 | 0.0662 |
| 7469 | NELFA | LZE22T | Human | Esophagus | ESCC | 2.07e-04 | 2.16e-01 | 0.068 |
| 7469 | NELFA | LZE24T | Human | Esophagus | ESCC | 1.77e-08 | 3.23e-01 | 0.0596 |
| 7469 | NELFA | LZE21T | Human | Esophagus | ESCC | 4.66e-02 | 3.16e-01 | 0.0655 |
| 7469 | NELFA | P1T-E | Human | Esophagus | ESCC | 4.83e-09 | 4.34e-01 | 0.0875 |
| 7469 | NELFA | P2T-E | Human | Esophagus | ESCC | 1.09e-36 | 6.11e-01 | 0.1177 |
| 7469 | NELFA | P4T-E | Human | Esophagus | ESCC | 9.40e-21 | 5.28e-01 | 0.1323 |
| 7469 | NELFA | P5T-E | Human | Esophagus | ESCC | 1.10e-19 | 2.22e-01 | 0.1327 |
| 7469 | NELFA | P8T-E | Human | Esophagus | ESCC | 9.88e-41 | 6.14e-01 | 0.0889 |
| 7469 | NELFA | P9T-E | Human | Esophagus | ESCC | 4.92e-16 | 2.11e-01 | 0.1131 |
| 7469 | NELFA | P10T-E | Human | Esophagus | ESCC | 5.40e-29 | 3.26e-01 | 0.116 |
| 7469 | NELFA | P11T-E | Human | Esophagus | ESCC | 1.98e-09 | 2.30e-01 | 0.1426 |
| 7469 | NELFA | P12T-E | Human | Esophagus | ESCC | 1.12e-34 | 6.09e-01 | 0.1122 |
| 7469 | NELFA | P15T-E | Human | Esophagus | ESCC | 1.50e-23 | 5.12e-01 | 0.1149 |
| 7469 | NELFA | P16T-E | Human | Esophagus | ESCC | 1.19e-44 | 7.89e-01 | 0.1153 |
| 7469 | NELFA | P17T-E | Human | Esophagus | ESCC | 9.85e-10 | 4.68e-01 | 0.1278 |
| 7469 | NELFA | P19T-E | Human | Esophagus | ESCC | 2.50e-06 | 5.81e-01 | 0.1662 |
| Page: 1 2 3 4 5 6 |
| Tissue | Expression Dynamics | Abbreviation |
| Esophagus | 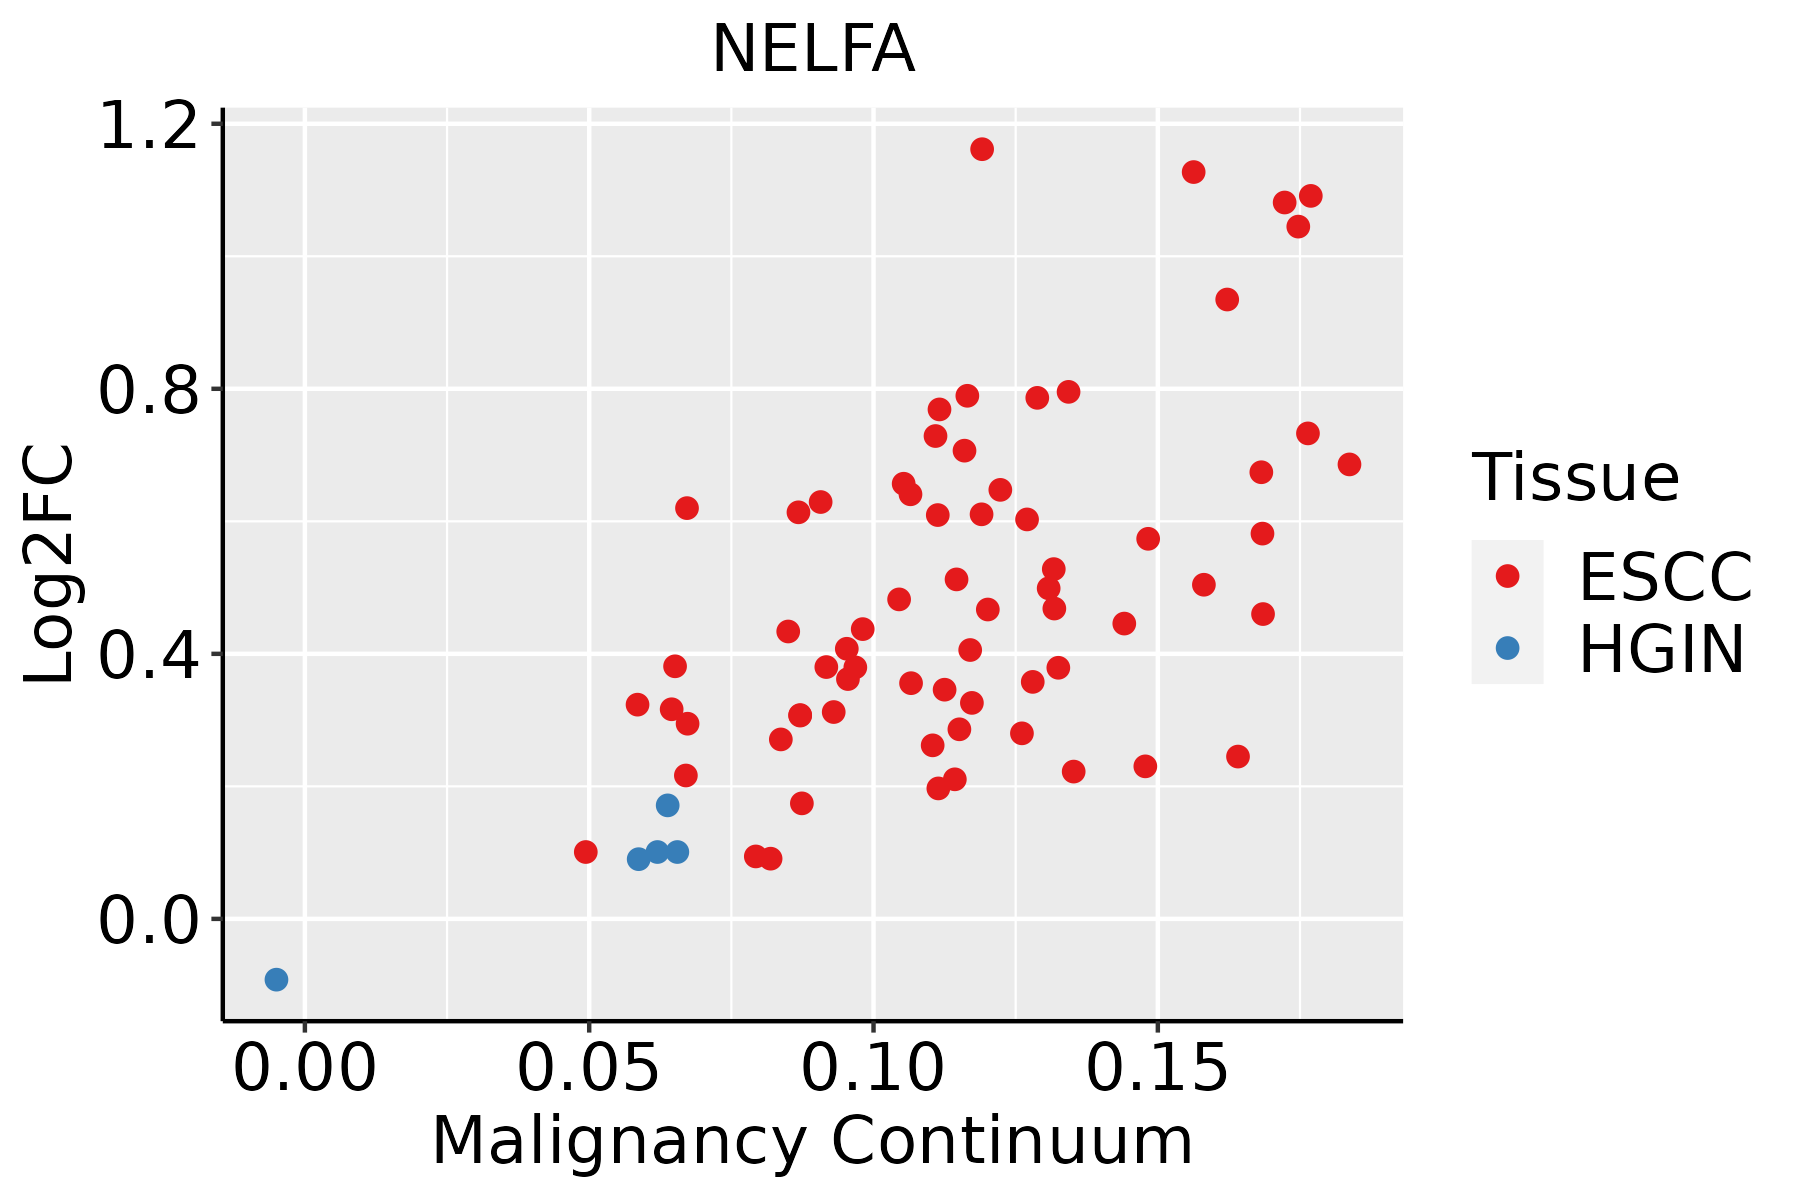 | ESCC: Esophageal squamous cell carcinoma |
| HGIN: High-grade intraepithelial neoplasias | ||
| LGIN: Low-grade intraepithelial neoplasias | ||
| Liver |  | HCC: Hepatocellular carcinoma |
| NAFLD: Non-alcoholic fatty liver disease | ||
| Oral Cavity | 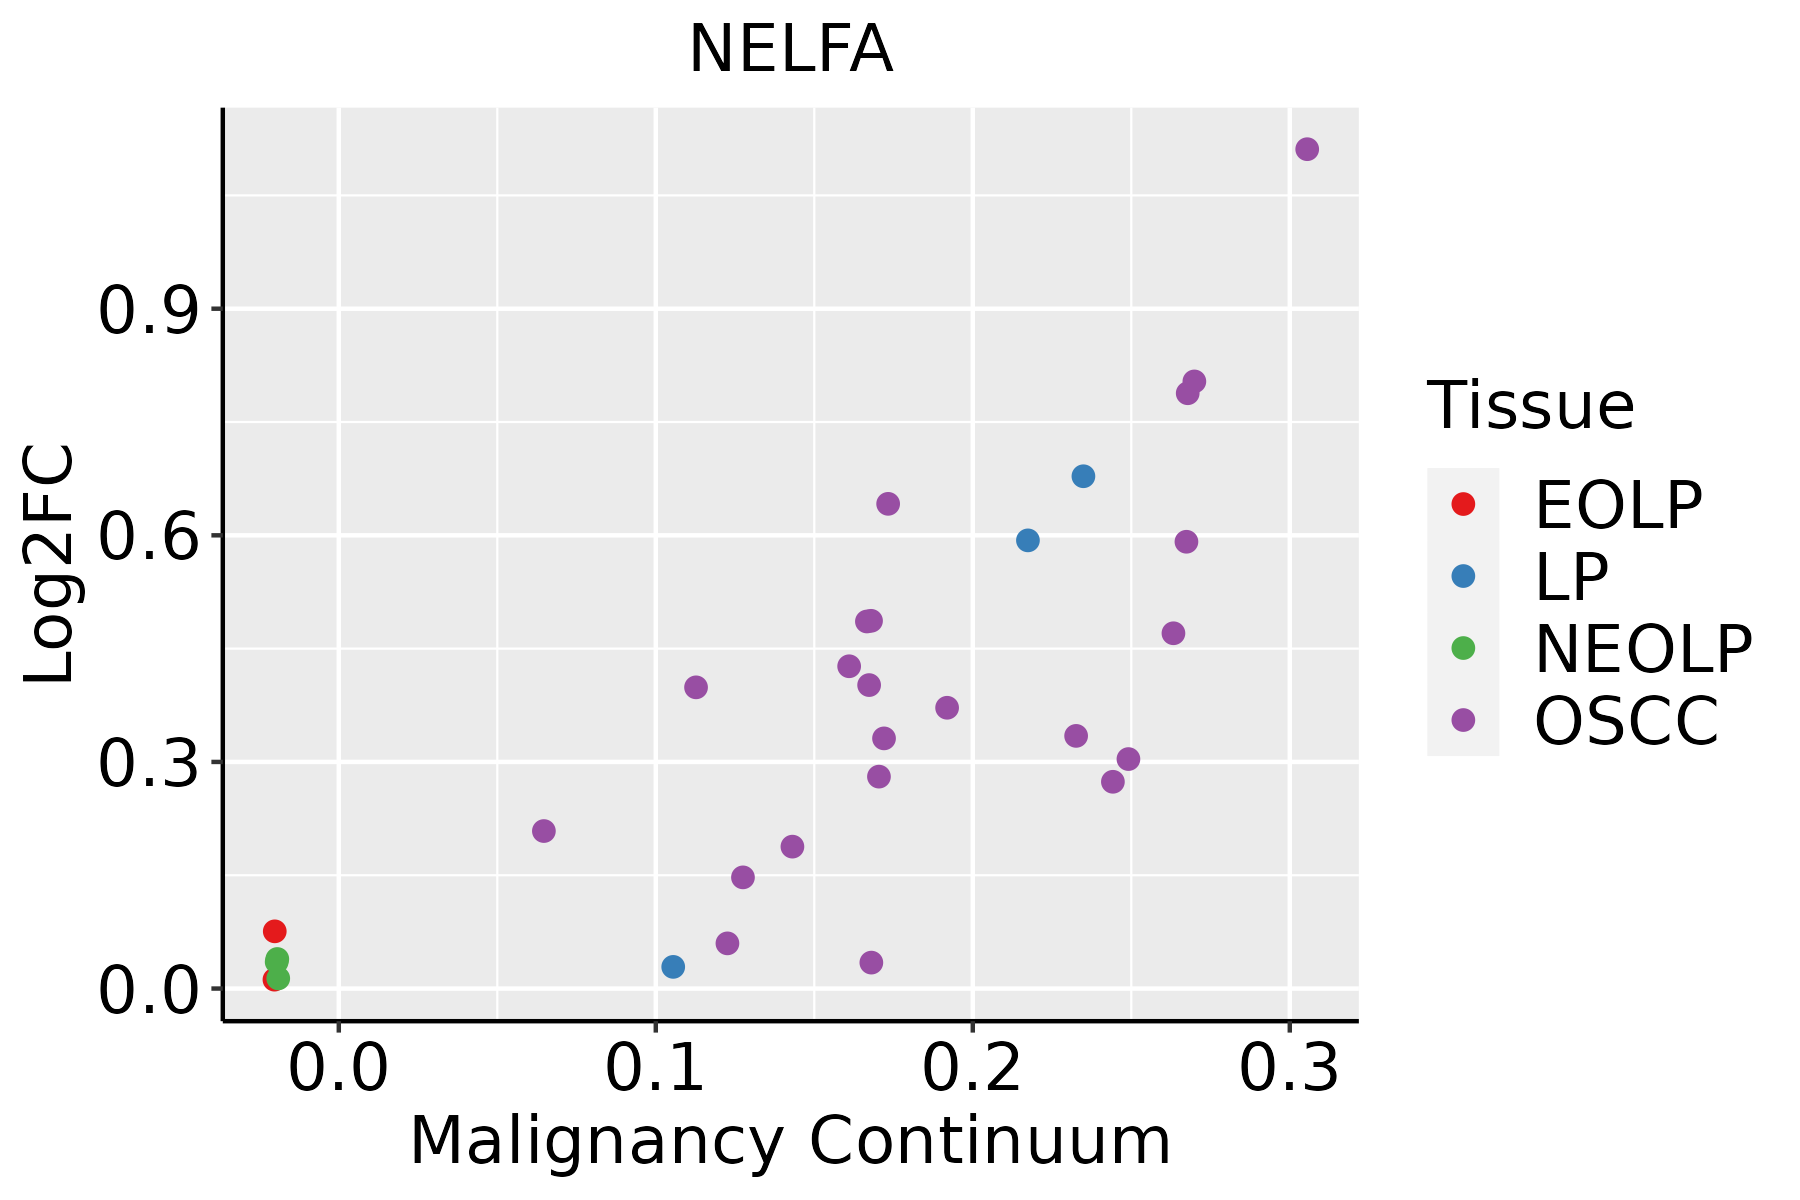 | EOLP: Erosive Oral lichen planus |
| LP: leukoplakia | ||
| NEOLP: Non-erosive oral lichen planus | ||
| OSCC: Oral squamous cell carcinoma | ||
| Thyroid | 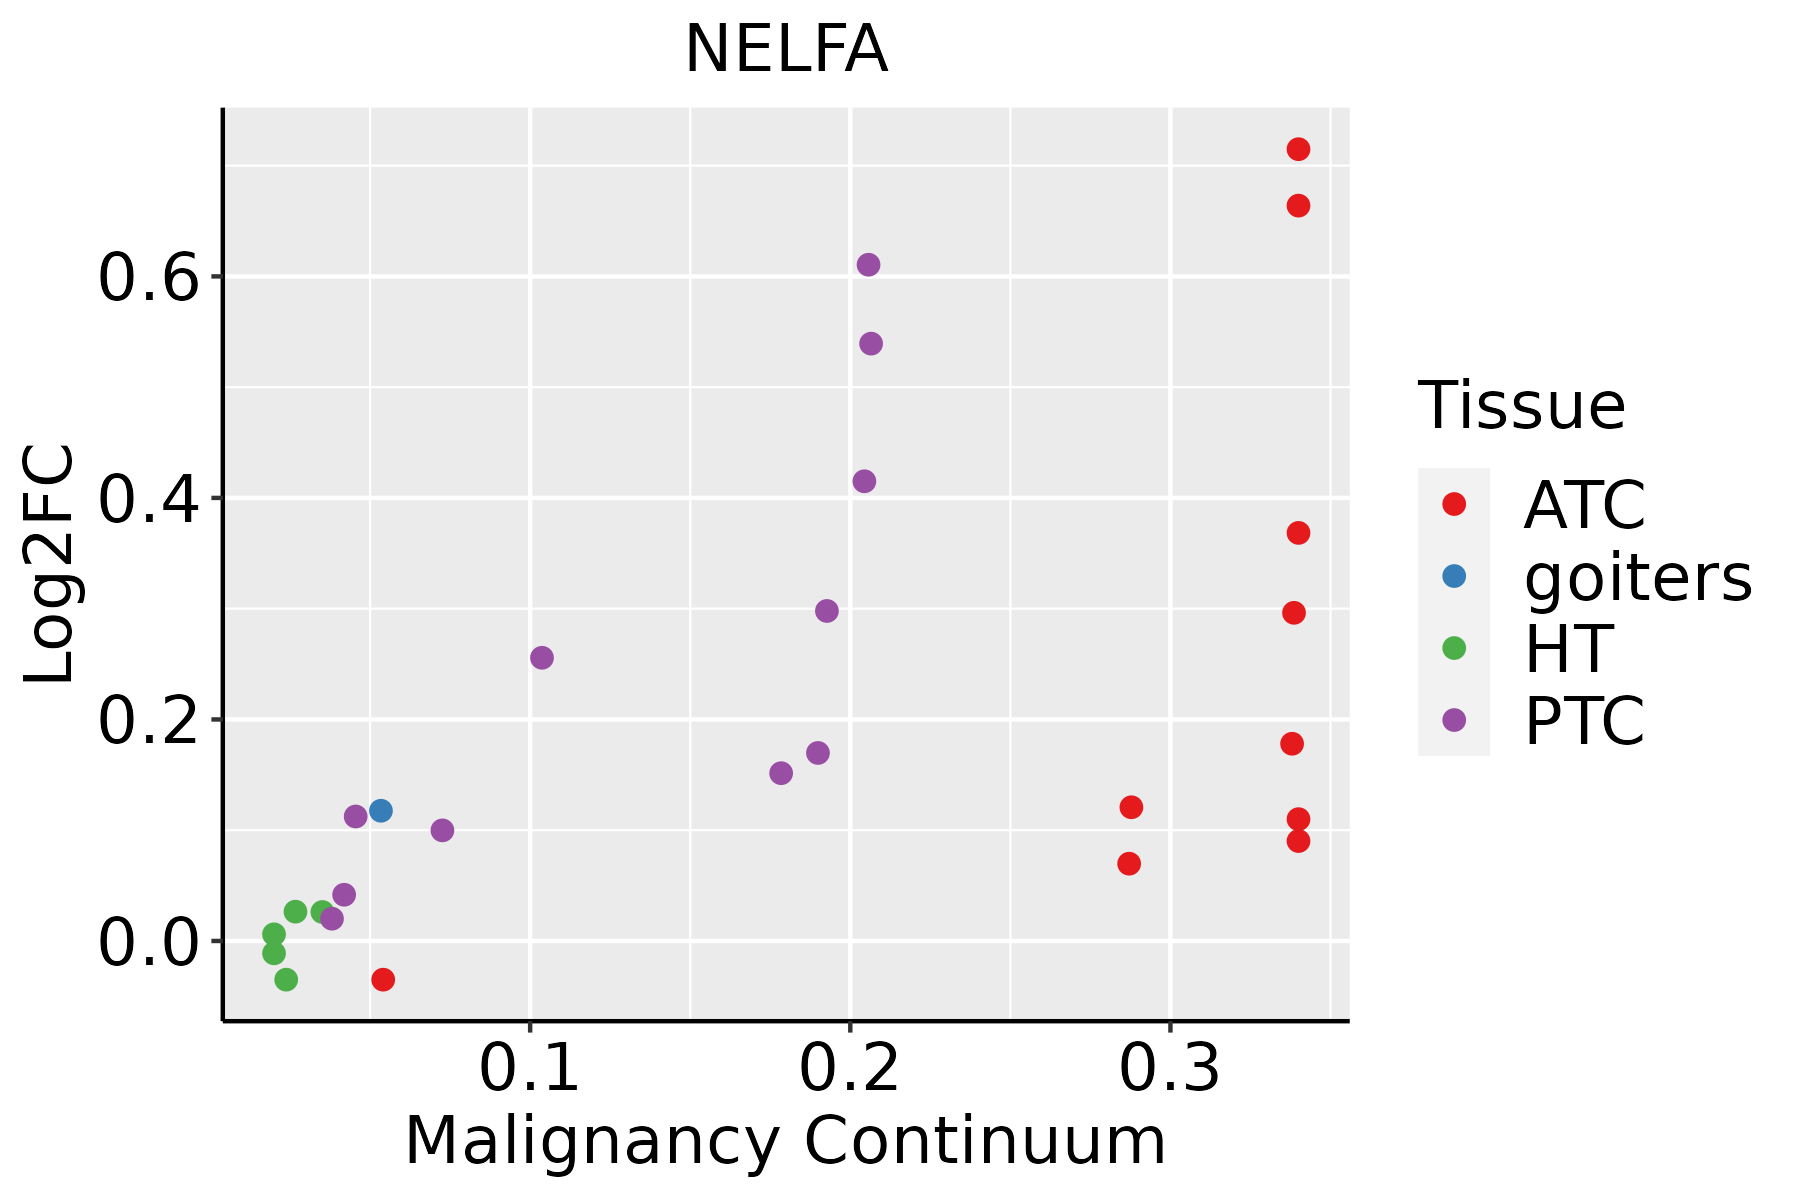 | ATC: Anaplastic thyroid cancer |
| HT: Hashimoto's thyroiditis | ||
| PTC: Papillary thyroid cancer |
| ∗log2FC in expression of this searched gene in stem-like cells from each diseased tissue sample relative to stem-like cells in normal samples in each tissue plotted against the malignancy continuum. Samples are colored based on if they are from different disease stage. |
Top |
Malignant transformation related pathway analysis |
| Find out the enriched GO biological processes and KEGG pathways involved in transition from healthy to precancer to cancer |
| Tissue | Disease Stage | Enriched GO biological Processes |
| Colorectum | AD |  |
| Colorectum | SER |  |
| Colorectum | MSS |  |
| Colorectum | MSI-H |  |
| Colorectum | FAP |  |
| ∗Top 15 enriched GO BP terms are showed in the bar plot of each disease state in each tissue. Each row represents a significant GO biological process which is colored according to the -log10(p.adjust). |
| Page: 1 2 3 4 5 6 7 8 9 |
| GO ID | Tissue | Disease Stage | Description | Gene Ratio | Bg Ratio | pvalue | p.adjust | Count |
| GO:001657015 | Esophagus | ESCC | histone modification | 323/8552 | 463/18723 | 2.61e-26 | 7.88e-24 | 323 |
| GO:001820514 | Esophagus | ESCC | peptidyl-lysine modification | 259/8552 | 376/18723 | 3.90e-20 | 5.26e-18 | 259 |
| GO:000635414 | Esophagus | ESCC | DNA-templated transcription, elongation | 76/8552 | 91/18723 | 8.35e-14 | 4.11e-12 | 76 |
| GO:00434143 | Esophagus | ESCC | macromolecule methylation | 199/8552 | 316/18723 | 3.44e-10 | 9.57e-09 | 199 |
| GO:000636814 | Esophagus | ESCC | transcription elongation from RNA polymerase II promoter | 56/8552 | 69/18723 | 1.40e-09 | 3.30e-08 | 56 |
| GO:003105614 | Esophagus | ESCC | regulation of histone modification | 106/8552 | 152/18723 | 1.52e-09 | 3.55e-08 | 106 |
| GO:00322592 | Esophagus | ESCC | methylation | 222/8552 | 364/18723 | 2.26e-09 | 5.09e-08 | 222 |
| GO:003278412 | Esophagus | ESCC | regulation of DNA-templated transcription, elongation | 45/8552 | 53/18723 | 3.64e-09 | 7.61e-08 | 45 |
| GO:000647914 | Esophagus | ESCC | protein methylation | 115/8552 | 181/18723 | 9.07e-07 | 1.16e-05 | 115 |
| GO:000821314 | Esophagus | ESCC | protein alkylation | 115/8552 | 181/18723 | 9.07e-07 | 1.16e-05 | 115 |
| GO:003424312 | Esophagus | ESCC | regulation of transcription elongation from RNA polymerase II promoter | 28/8552 | 32/18723 | 1.02e-06 | 1.29e-05 | 28 |
| GO:00310583 | Esophagus | ESCC | positive regulation of histone modification | 65/8552 | 92/18723 | 1.04e-06 | 1.31e-05 | 65 |
| GO:00165718 | Esophagus | ESCC | histone methylation | 89/8552 | 141/18723 | 2.17e-05 | 1.87e-04 | 89 |
| GO:003496814 | Esophagus | ESCC | histone lysine methylation | 72/8552 | 115/18723 | 1.85e-04 | 1.18e-03 | 72 |
| GO:003106013 | Esophagus | ESCC | regulation of histone methylation | 46/8552 | 69/18723 | 3.46e-04 | 2.03e-03 | 46 |
| GO:001802214 | Esophagus | ESCC | peptidyl-lysine methylation | 79/8552 | 131/18723 | 5.17e-04 | 2.86e-03 | 79 |
| GO:003424411 | Esophagus | ESCC | negative regulation of transcription elongation from RNA polymerase II promoter | 14/8552 | 16/18723 | 6.78e-04 | 3.56e-03 | 14 |
| GO:003278511 | Esophagus | ESCC | negative regulation of DNA-templated transcription, elongation | 15/8552 | 18/18723 | 1.20e-03 | 5.88e-03 | 15 |
| GO:003106211 | Esophagus | ESCC | positive regulation of histone methylation | 28/8552 | 41/18723 | 2.88e-03 | 1.21e-02 | 28 |
| GO:005157111 | Esophagus | ESCC | positive regulation of histone H3-K4 methylation | 14/8552 | 19/18723 | 1.27e-02 | 4.21e-02 | 14 |
| Page: 1 2 3 4 5 6 |
| Pathway ID | Tissue | Disease Stage | Description | Gene Ratio | Bg Ratio | pvalue | p.adjust | qvalue | Count |
| hsa032509 | Esophagus | ESCC | Viral life cycle - HIV-1 | 54/4205 | 63/8465 | 2.01e-09 | 2.17e-08 | 1.11e-08 | 54 |
| hsa0325014 | Esophagus | ESCC | Viral life cycle - HIV-1 | 54/4205 | 63/8465 | 2.01e-09 | 2.17e-08 | 1.11e-08 | 54 |
| hsa032502 | Liver | HCC | Viral life cycle - HIV-1 | 46/4020 | 63/8465 | 3.25e-05 | 1.88e-04 | 1.04e-04 | 46 |
| hsa0325011 | Liver | HCC | Viral life cycle - HIV-1 | 46/4020 | 63/8465 | 3.25e-05 | 1.88e-04 | 1.04e-04 | 46 |
| hsa032508 | Oral cavity | OSCC | Viral life cycle - HIV-1 | 45/3704 | 63/8465 | 7.62e-06 | 3.59e-05 | 1.83e-05 | 45 |
| hsa0325013 | Oral cavity | OSCC | Viral life cycle - HIV-1 | 45/3704 | 63/8465 | 7.62e-06 | 3.59e-05 | 1.83e-05 | 45 |
| hsa0325022 | Oral cavity | LP | Viral life cycle - HIV-1 | 32/2418 | 63/8465 | 1.55e-04 | 9.08e-04 | 5.86e-04 | 32 |
| hsa0325031 | Oral cavity | LP | Viral life cycle - HIV-1 | 32/2418 | 63/8465 | 1.55e-04 | 9.08e-04 | 5.86e-04 | 32 |
| Page: 1 |
Top |
Cell-cell communication analysis |
| Identification of potential cell-cell interactions between two cell types and their ligand-receptor pairs for different disease states |
| Ligand | Receptor | LRpair | Pathway | Tissue | Disease Stage |
| Page: 1 |
Top |
Single-cell gene regulatory network inference analysis |
| Find out the significant the regulons (TFs) and the target genes of each regulon across cell types for different disease states |
| TF | Cell Type | Tissue | Disease Stage | Target Gene | RSS | Regulon Activity |
| ∗The dot plots of a searched regulon are shown for all cell subpopulations in each disease state of each tissue based on the regulon specific score inferred using pySCENIC and by calculating the average expression. |
| Page: 1 |
Top |
Somatic mutation of malignant transformation related genes |
| Annotation of somatic variants for genes involved in malignant transformation |
| Hugo Symbol | Variant Class | Variant Classification | dbSNP RS | HGVSc | HGVSp | HGVSp Short | SWISSPROT | BIOTYPE | SIFT | PolyPhen | Tumor Sample Barcode | Tissue | Histology | Sex | Age | Stage | Therapy Types | Drugs | Outcome |
| NELFA | SNV | Missense_Mutation | c.995N>G | p.Ser332Cys | p.S332C | protein_coding | deleterious(0.01) | probably_damaging(1) | TCGA-AC-A23H-01 | Breast | breast invasive carcinoma | Female | >=65 | I/II | Unknown | Unknown | PD | ||
| NELFA | insertion | Nonsense_Mutation | novel | c.1450_1451insTTTAATTCTGGAAAATAAGGTAGTCCTGGAAGATGGGCACT | p.Glu484ValfsTer2 | p.E484Vfs*2 | protein_coding | TCGA-BH-A0AY-01 | Breast | breast invasive carcinoma | Female | <65 | I/II | Chemotherapy | SD | ||||
| NELFA | SNV | Missense_Mutation | novel | c.983C>A | p.Pro328His | p.P328H | protein_coding | deleterious(0) | possibly_damaging(0.754) | TCGA-C5-A7UI-01 | Cervix | cervical & endocervical cancer | Female | <65 | I/II | Unknown | Unknown | SD | |
| NELFA | SNV | Missense_Mutation | novel | c.358N>C | p.Glu120Gln | p.E120Q | protein_coding | tolerated(0.08) | benign(0.009) | TCGA-DG-A2KM-01 | Cervix | cervical & endocervical cancer | Female | <65 | I/II | Chemotherapy | cisplatin | SD | |
| NELFA | SNV | Missense_Mutation | rs763739051 | c.1016N>T | p.Thr339Met | p.T339M | protein_coding | deleterious(0.05) | probably_damaging(0.969) | TCGA-EA-A410-01 | Cervix | cervical & endocervical cancer | Female | <65 | I/II | Unknown | Unknown | SD | |
| NELFA | SNV | Missense_Mutation | rs745686118 | c.839N>A | p.Arg280Gln | p.R280Q | protein_coding | tolerated(0.15) | probably_damaging(0.997) | TCGA-IR-A3LI-01 | Cervix | cervical & endocervical cancer | Female | <65 | I/II | Chemotherapy | cisplatin | CR | |
| NELFA | SNV | Missense_Mutation | novel | c.565N>A | p.Leu189Met | p.L189M | protein_coding | deleterious(0) | probably_damaging(0.953) | TCGA-ZJ-A8QR-01 | Cervix | cervical & endocervical cancer | Female | <65 | I/II | Unknown | Unknown | SD | |
| NELFA | SNV | Missense_Mutation | c.1583N>A | p.Arg528His | p.R528H | protein_coding | deleterious(0.01) | probably_damaging(0.999) | TCGA-A6-2680-01 | Colorectum | colon adenocarcinoma | Female | >=65 | I/II | Unknown | Unknown | SD | ||
| NELFA | SNV | Missense_Mutation | novel | c.325A>G | p.Lys109Glu | p.K109E | protein_coding | deleterious(0) | possibly_damaging(0.476) | TCGA-A6-3807-01 | Colorectum | colon adenocarcinoma | Female | <65 | III/IV | Ancillary | leucovorin | SD | |
| NELFA | SNV | Missense_Mutation | rs745357806 | c.1513G>A | p.Gly505Ser | p.G505S | protein_coding | deleterious(0.01) | probably_damaging(1) | TCGA-A6-6141-01 | Colorectum | colon adenocarcinoma | Male | <65 | I/II | Chemotherapy | 5-fu | SD |
| Page: 1 2 3 4 5 6 7 |
Top |
Related drugs of malignant transformation related genes |
| Identification of chemicals and drugs interact with genes involved in malignant transfromation |
| (DGIdb 4.0) |
| Entrez ID | Symbol | Category | Interaction Types | Drug Claim Name | Drug Name | PMIDs |
| Page: 1 |

Copyright 2023-Present -The University of Texas Health Science Center at Houston |