
|
|||||
|
 | |
| |
| |
| |
| |
| |
|
Gene: NEK7 |
Gene summary for NEK7 |
| Gene information | Species | Human | Gene symbol | NEK7 | Gene ID | 140609 |
| Gene name | NIMA related kinase 7 | |
| Gene Alias | NEK7 | |
| Cytomap | 1q31.3 | |
| Gene Type | protein-coding | GO ID | GO:0000226 | UniProtAcc | A0A024R964 |
Top |
Malignant transformation analysis |
| Identification of the aberrant gene expression in precancerous and cancerous lesions by comparing the gene expression of stem-like cells in diseased tissues with normal stem cells |
| Entrez ID | Symbol | Replicates | Species | Organ | Tissue | Adj P-value | Log2FC | Malignancy |
| 140609 | NEK7 | CCI_1 | Human | Cervix | CC | 8.61e-14 | 1.64e+00 | 0.528 |
| 140609 | NEK7 | CCI_2 | Human | Cervix | CC | 1.45e-05 | 9.19e-01 | 0.5249 |
| 140609 | NEK7 | CCI_3 | Human | Cervix | CC | 1.15e-17 | 1.30e+00 | 0.516 |
| 140609 | NEK7 | HTA11_3410_2000001011 | Human | Colorectum | AD | 5.26e-18 | -5.93e-01 | 0.0155 |
| 140609 | NEK7 | HTA11_2487_2000001011 | Human | Colorectum | SER | 4.16e-04 | -4.54e-01 | -0.1808 |
| 140609 | NEK7 | HTA11_3361_2000001011 | Human | Colorectum | AD | 6.69e-03 | -4.74e-01 | -0.1207 |
| 140609 | NEK7 | HTA11_83_2000001011 | Human | Colorectum | SER | 2.29e-02 | -4.38e-01 | -0.1526 |
| 140609 | NEK7 | HTA11_696_2000001011 | Human | Colorectum | AD | 3.71e-09 | -3.70e-01 | -0.1464 |
| 140609 | NEK7 | HTA11_866_2000001011 | Human | Colorectum | AD | 6.62e-03 | -2.87e-01 | -0.1001 |
| 140609 | NEK7 | HTA11_866_3004761011 | Human | Colorectum | AD | 1.32e-06 | -4.71e-01 | 0.096 |
| 140609 | NEK7 | HTA11_9408_2000001011 | Human | Colorectum | AD | 3.51e-02 | -6.43e-01 | 0.0451 |
| 140609 | NEK7 | HTA11_7696_3000711011 | Human | Colorectum | AD | 1.74e-10 | -4.19e-01 | 0.0674 |
| 140609 | NEK7 | HTA11_99999970781_79442 | Human | Colorectum | MSS | 2.17e-14 | -4.42e-01 | 0.294 |
| 140609 | NEK7 | HTA11_99999971662_82457 | Human | Colorectum | MSS | 3.66e-07 | -3.44e-01 | 0.3859 |
| 140609 | NEK7 | HTA11_99999973899_84307 | Human | Colorectum | MSS | 1.90e-04 | -5.63e-01 | 0.2585 |
| 140609 | NEK7 | HTA11_99999974143_84620 | Human | Colorectum | MSS | 3.51e-20 | -5.43e-01 | 0.3005 |
| 140609 | NEK7 | A015-C-203 | Human | Colorectum | FAP | 1.73e-21 | -2.62e-01 | -0.1294 |
| 140609 | NEK7 | A015-C-204 | Human | Colorectum | FAP | 5.56e-03 | -7.47e-02 | -0.0228 |
| 140609 | NEK7 | A014-C-040 | Human | Colorectum | FAP | 1.09e-02 | -2.75e-01 | -0.1184 |
| 140609 | NEK7 | A002-C-201 | Human | Colorectum | FAP | 6.06e-11 | -3.05e-01 | 0.0324 |
| Page: 1 2 3 4 5 6 7 8 9 |
| Tissue | Expression Dynamics | Abbreviation |
| Cervix |  | CC: Cervix cancer |
| HSIL_HPV: HPV-infected high-grade squamous intraepithelial lesions | ||
| N_HPV: HPV-infected normal cervix | ||
| Colorectum (GSE201348) |  | FAP: Familial adenomatous polyposis |
| CRC: Colorectal cancer | ||
| Colorectum (HTA11) |  | AD: Adenomas |
| SER: Sessile serrated lesions | ||
| MSI-H: Microsatellite-high colorectal cancer | ||
| MSS: Microsatellite stable colorectal cancer | ||
| Esophagus |  | ESCC: Esophageal squamous cell carcinoma |
| HGIN: High-grade intraepithelial neoplasias | ||
| LGIN: Low-grade intraepithelial neoplasias | ||
| Liver | 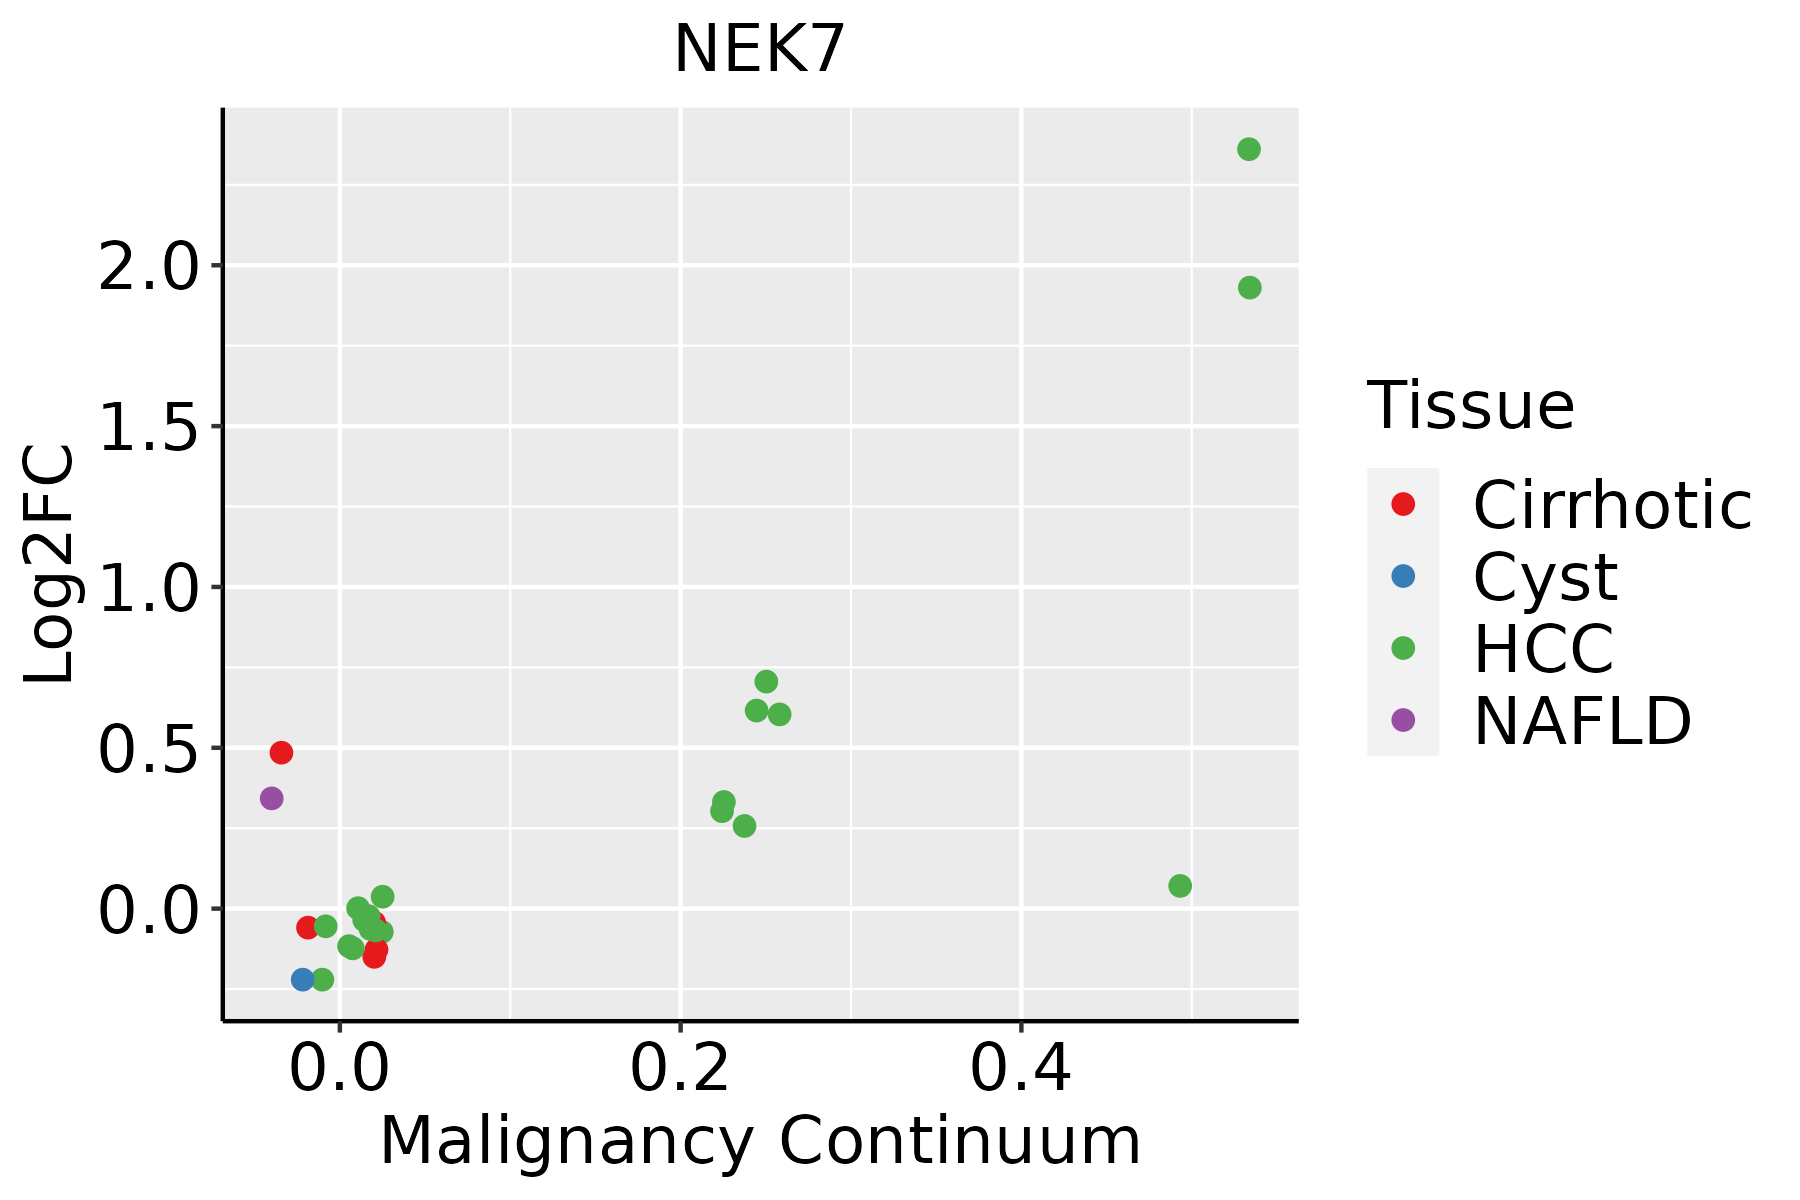 | HCC: Hepatocellular carcinoma |
| NAFLD: Non-alcoholic fatty liver disease | ||
| Lung |  | AAH: Atypical adenomatous hyperplasia |
| AIS: Adenocarcinoma in situ | ||
| IAC: Invasive lung adenocarcinoma | ||
| MIA: Minimally invasive adenocarcinoma | ||
| Oral Cavity | 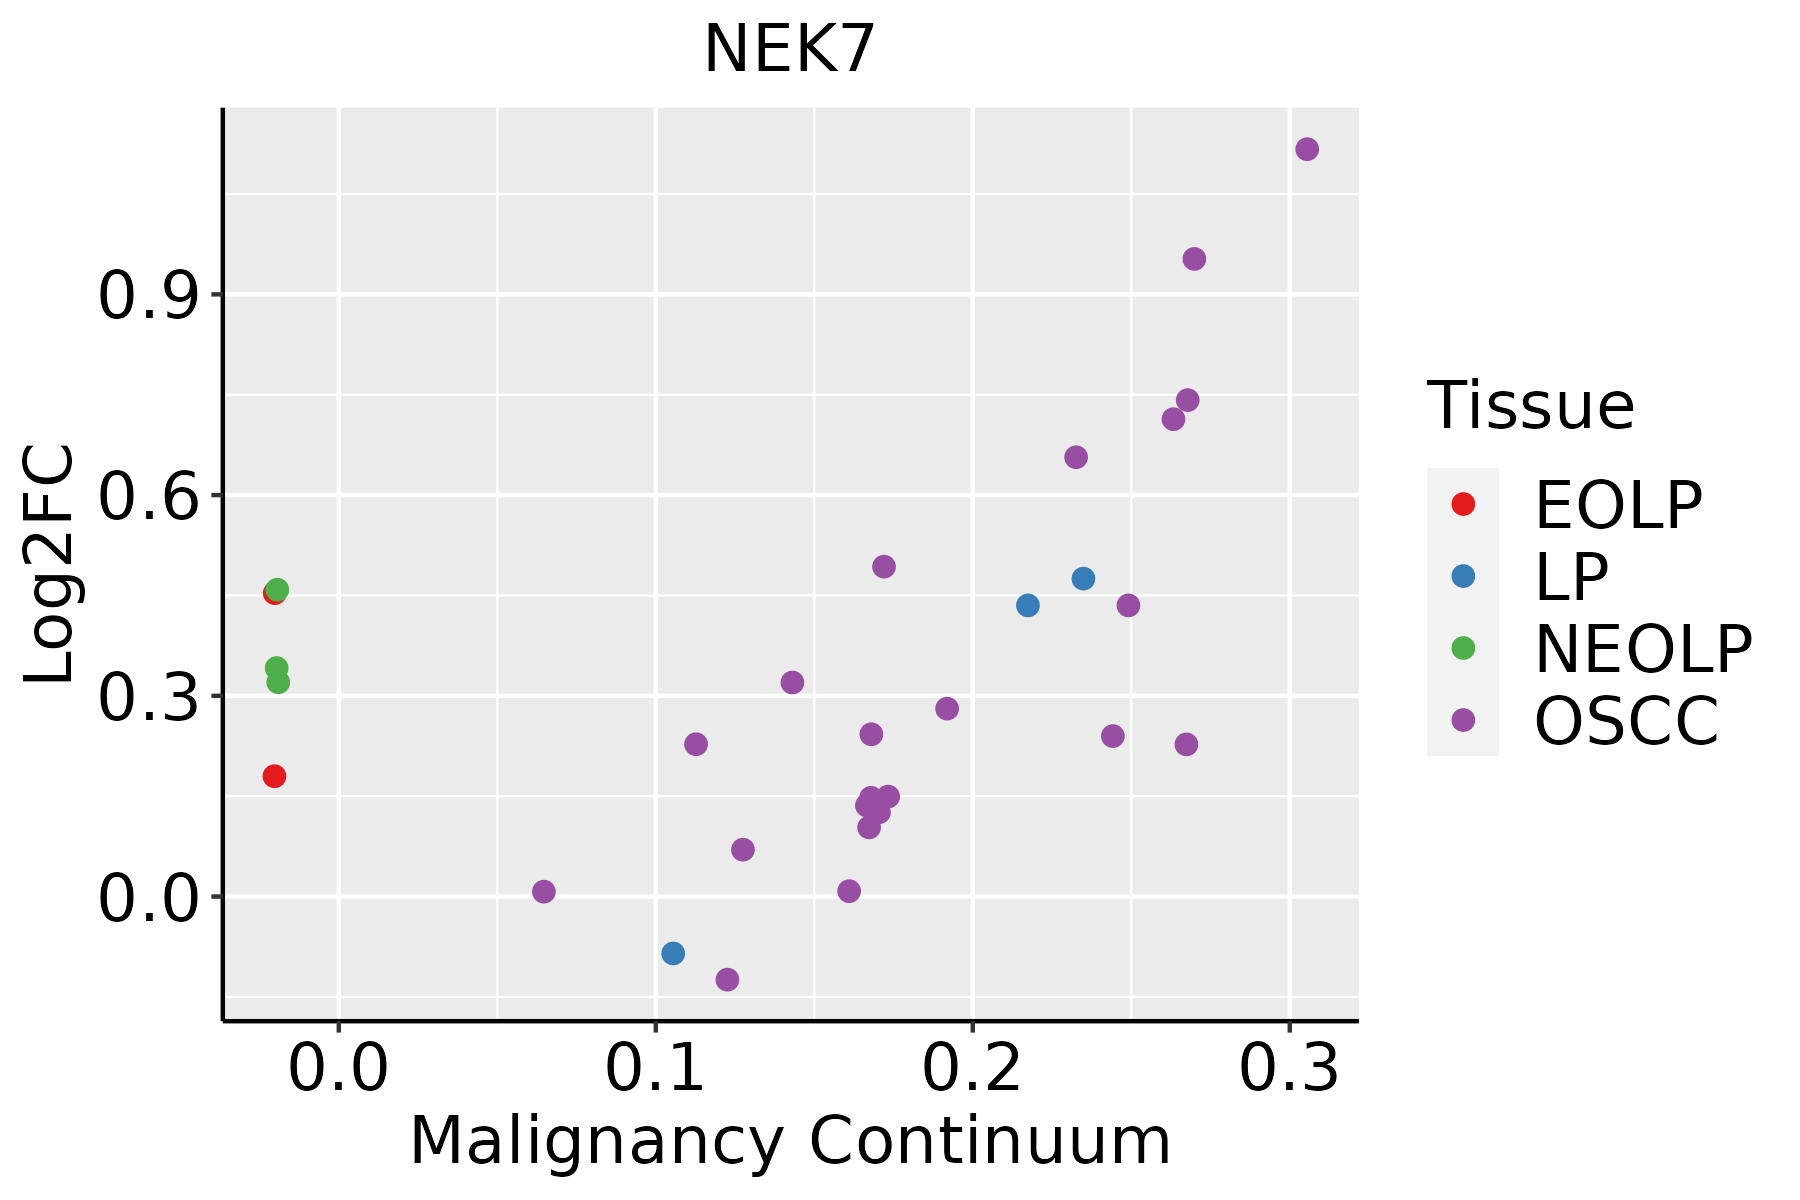 | EOLP: Erosive Oral lichen planus |
| LP: leukoplakia | ||
| NEOLP: Non-erosive oral lichen planus | ||
| OSCC: Oral squamous cell carcinoma | ||
| Prostate | 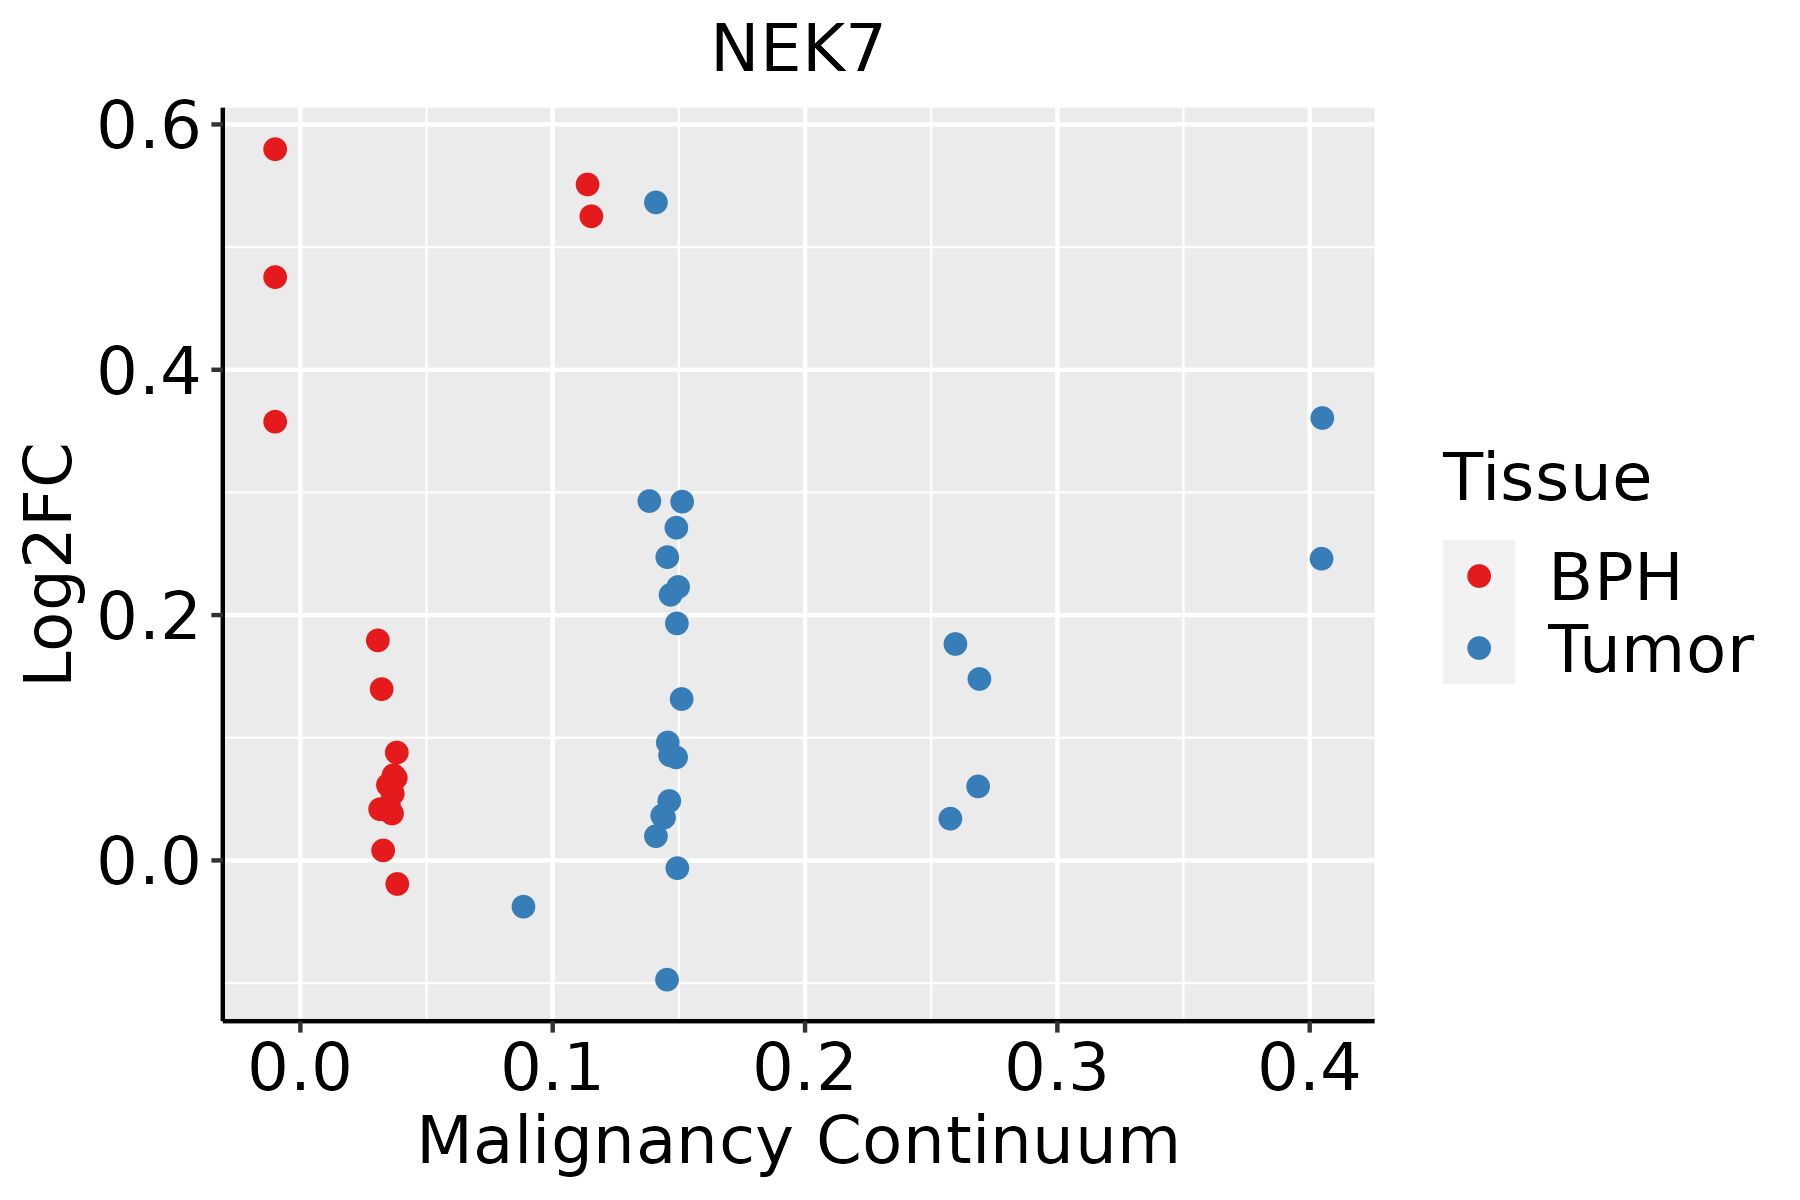 | BPH: Benign Prostatic Hyperplasia |
| Skin |  | AK: Actinic keratosis |
| cSCC: Cutaneous squamous cell carcinoma | ||
| SCCIS:squamous cell carcinoma in situ | ||
| Thyroid | 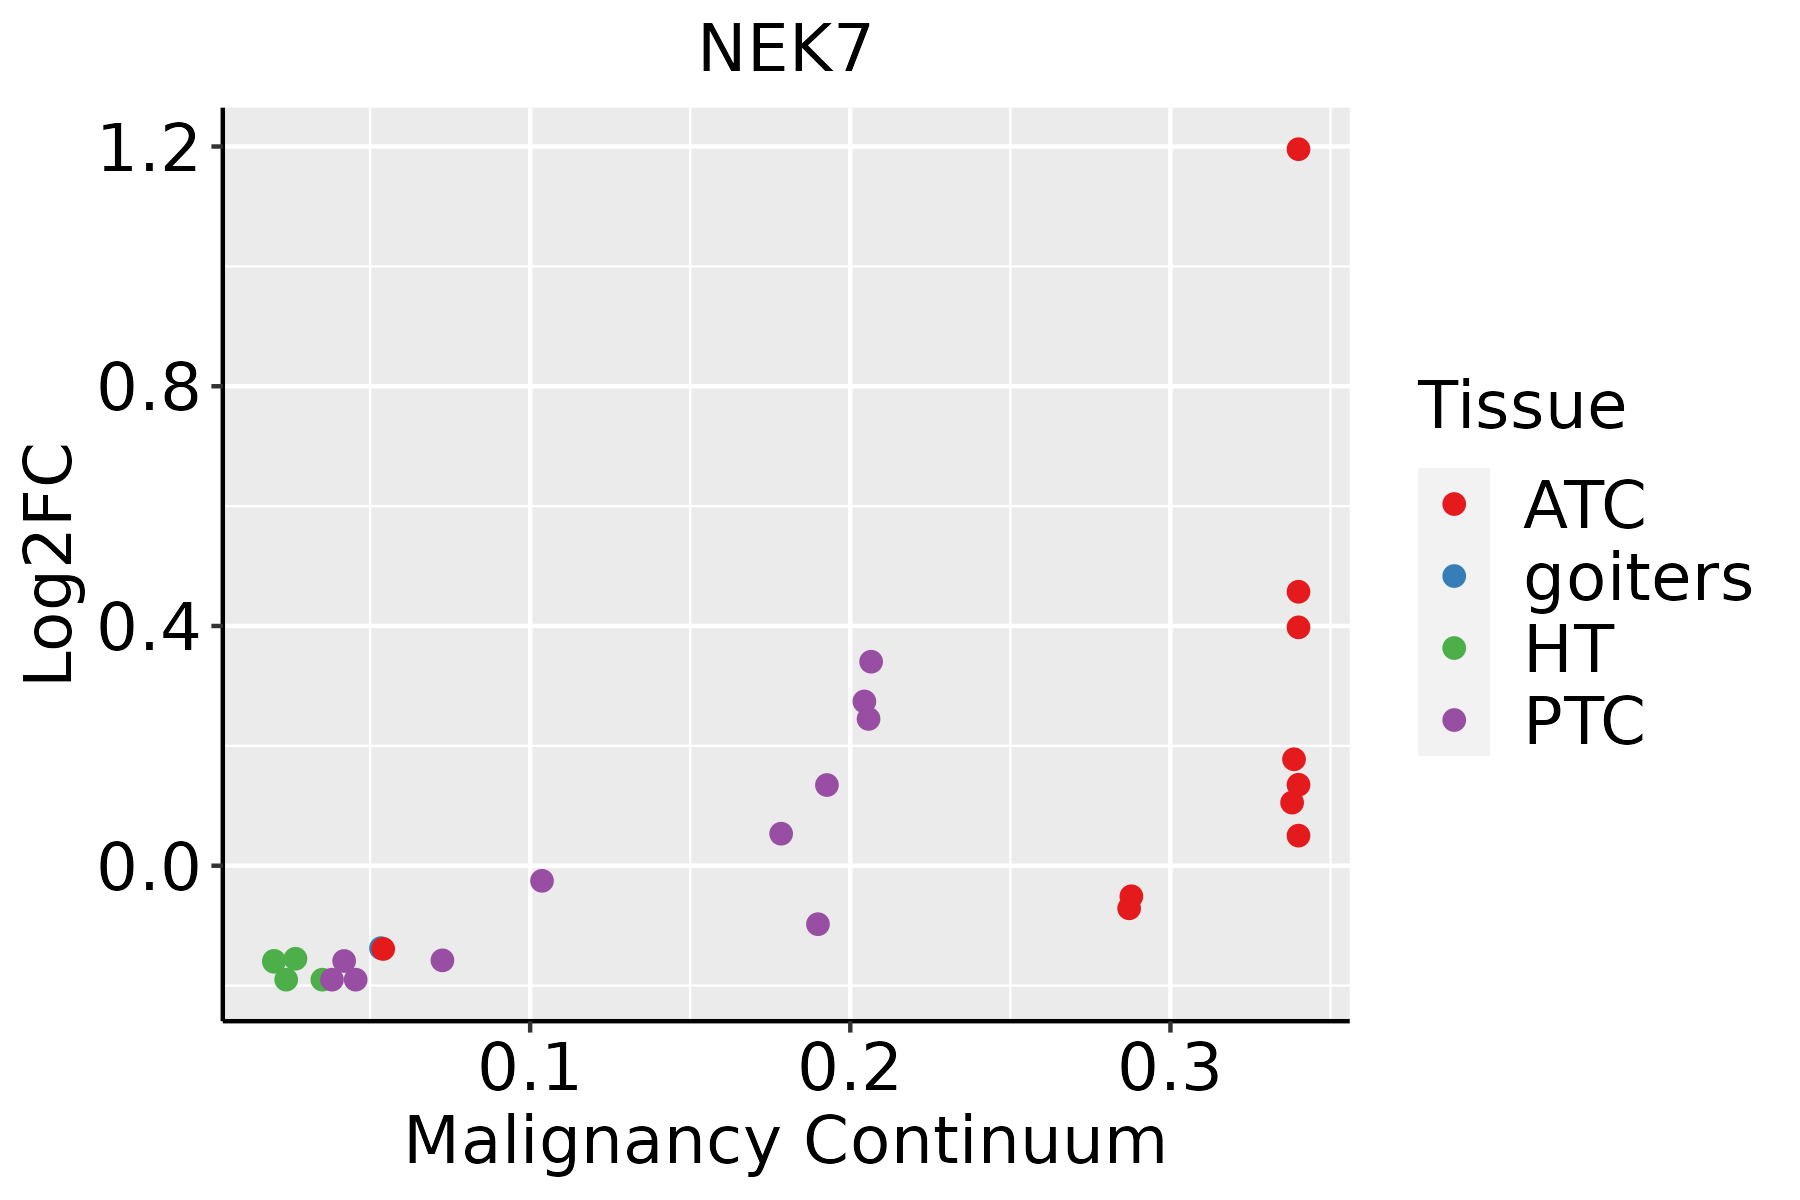 | ATC: Anaplastic thyroid cancer |
| HT: Hashimoto's thyroiditis | ||
| PTC: Papillary thyroid cancer |
| ∗log2FC in expression of this searched gene in stem-like cells from each diseased tissue sample relative to stem-like cells in normal samples in each tissue plotted against the malignancy continuum. Samples are colored based on if they are from different disease stage. |
Top |
Malignant transformation related pathway analysis |
| Find out the enriched GO biological processes and KEGG pathways involved in transition from healthy to precancer to cancer |
| Tissue | Disease Stage | Enriched GO biological Processes |
| Colorectum | AD |  |
| Colorectum | SER |  |
| Colorectum | MSS |  |
| Colorectum | MSI-H |  |
| Colorectum | FAP |  |
| ∗Top 15 enriched GO BP terms are showed in the bar plot of each disease state in each tissue. Each row represents a significant GO biological process which is colored according to the -log10(p.adjust). |
| Page: 1 2 3 4 5 6 7 8 9 |
| GO ID | Tissue | Disease Stage | Description | Gene Ratio | Bg Ratio | pvalue | p.adjust | Count |
| GO:00073466 | Cervix | CC | regulation of mitotic cell cycle | 88/2311 | 457/18723 | 1.26e-05 | 2.60e-04 | 88 |
| GO:00510528 | Cervix | CC | regulation of DNA metabolic process | 65/2311 | 359/18723 | 9.25e-04 | 7.84e-03 | 65 |
| GO:20002789 | Cervix | CC | regulation of DNA biosynthetic process | 23/2311 | 106/18723 | 4.65e-03 | 2.81e-02 | 23 |
| GO:00519738 | Cervix | CC | positive regulation of telomerase activity | 10/2311 | 34/18723 | 6.40e-03 | 3.58e-02 | 10 |
| GO:00007239 | Cervix | CC | telomere maintenance | 26/2311 | 131/18723 | 9.33e-03 | 4.66e-02 | 26 |
| GO:0051052 | Colorectum | AD | regulation of DNA metabolic process | 116/3918 | 359/18723 | 2.47e-07 | 1.00e-05 | 116 |
| GO:0051054 | Colorectum | AD | positive regulation of DNA metabolic process | 73/3918 | 201/18723 | 3.27e-07 | 1.29e-05 | 73 |
| GO:2001252 | Colorectum | AD | positive regulation of chromosome organization | 35/3918 | 82/18723 | 6.90e-06 | 1.72e-04 | 35 |
| GO:2000278 | Colorectum | AD | regulation of DNA biosynthetic process | 41/3918 | 106/18723 | 2.17e-05 | 4.33e-04 | 41 |
| GO:2000573 | Colorectum | AD | positive regulation of DNA biosynthetic process | 28/3918 | 66/18723 | 6.35e-05 | 1.05e-03 | 28 |
| GO:0051972 | Colorectum | AD | regulation of telomerase activity | 22/3918 | 47/18723 | 6.45e-05 | 1.07e-03 | 22 |
| GO:0032206 | Colorectum | AD | positive regulation of telomere maintenance | 23/3918 | 52/18723 | 1.31e-04 | 1.88e-03 | 23 |
| GO:0051973 | Colorectum | AD | positive regulation of telomerase activity | 17/3918 | 34/18723 | 1.59e-04 | 2.20e-03 | 17 |
| GO:0032204 | Colorectum | AD | regulation of telomere maintenance | 31/3918 | 80/18723 | 2.01e-04 | 2.67e-03 | 31 |
| GO:0033044 | Colorectum | AD | regulation of chromosome organization | 60/3918 | 187/18723 | 2.25e-04 | 2.94e-03 | 60 |
| GO:0007051 | Colorectum | AD | spindle organization | 58/3918 | 184/18723 | 4.71e-04 | 5.20e-03 | 58 |
| GO:0000723 | Colorectum | AD | telomere maintenance | 43/3918 | 131/18723 | 9.77e-04 | 9.20e-03 | 43 |
| GO:0010833 | Colorectum | AD | telomere maintenance via telomere lengthening | 29/3918 | 81/18723 | 1.42e-03 | 1.22e-02 | 29 |
| GO:0071897 | Colorectum | AD | DNA biosynthetic process | 55/3918 | 180/18723 | 1.46e-03 | 1.24e-02 | 55 |
| GO:1904358 | Colorectum | AD | positive regulation of telomere maintenance via telomere lengthening | 16/3918 | 37/18723 | 1.81e-03 | 1.49e-02 | 16 |
| Page: 1 2 3 4 5 6 7 8 9 10 11 12 13 14 15 16 17 18 19 20 21 |
| Pathway ID | Tissue | Disease Stage | Description | Gene Ratio | Bg Ratio | pvalue | p.adjust | qvalue | Count |
| hsa046213 | Cervix | CC | NOD-like receptor signaling pathway | 41/1267 | 186/8465 | 5.90e-03 | 1.95e-02 | 1.15e-02 | 41 |
| hsa0462112 | Cervix | CC | NOD-like receptor signaling pathway | 41/1267 | 186/8465 | 5.90e-03 | 1.95e-02 | 1.15e-02 | 41 |
| hsa0462122 | Esophagus | ESCC | NOD-like receptor signaling pathway | 116/4205 | 186/8465 | 2.90e-04 | 1.03e-03 | 5.30e-04 | 116 |
| hsa0462132 | Esophagus | ESCC | NOD-like receptor signaling pathway | 116/4205 | 186/8465 | 2.90e-04 | 1.03e-03 | 5.30e-04 | 116 |
| hsa046212 | Lung | IAC | NOD-like receptor signaling pathway | 38/1053 | 186/8465 | 1.23e-03 | 8.24e-03 | 5.47e-03 | 38 |
| hsa0462111 | Lung | IAC | NOD-like receptor signaling pathway | 38/1053 | 186/8465 | 1.23e-03 | 8.24e-03 | 5.47e-03 | 38 |
| hsa046218 | Oral cavity | OSCC | NOD-like receptor signaling pathway | 108/3704 | 186/8465 | 5.13e-05 | 2.07e-04 | 1.05e-04 | 108 |
| hsa0462113 | Oral cavity | OSCC | NOD-like receptor signaling pathway | 108/3704 | 186/8465 | 5.13e-05 | 2.07e-04 | 1.05e-04 | 108 |
| hsa046214 | Oral cavity | EOLP | NOD-like receptor signaling pathway | 48/1218 | 186/8465 | 2.51e-05 | 1.31e-04 | 7.70e-05 | 48 |
| hsa046215 | Oral cavity | EOLP | NOD-like receptor signaling pathway | 48/1218 | 186/8465 | 2.51e-05 | 1.31e-04 | 7.70e-05 | 48 |
| hsa046216 | Oral cavity | NEOLP | NOD-like receptor signaling pathway | 39/1112 | 186/8465 | 1.79e-03 | 7.91e-03 | 4.98e-03 | 39 |
| hsa046217 | Oral cavity | NEOLP | NOD-like receptor signaling pathway | 39/1112 | 186/8465 | 1.79e-03 | 7.91e-03 | 4.98e-03 | 39 |
| Page: 1 |
Top |
Cell-cell communication analysis |
| Identification of potential cell-cell interactions between two cell types and their ligand-receptor pairs for different disease states |
| Ligand | Receptor | LRpair | Pathway | Tissue | Disease Stage |
| Page: 1 |
Top |
Single-cell gene regulatory network inference analysis |
| Find out the significant the regulons (TFs) and the target genes of each regulon across cell types for different disease states |
| TF | Cell Type | Tissue | Disease Stage | Target Gene | RSS | Regulon Activity |
| ∗The dot plots of a searched regulon are shown for all cell subpopulations in each disease state of each tissue based on the regulon specific score inferred using pySCENIC and by calculating the average expression. |
| Page: 1 |
Top |
Somatic mutation of malignant transformation related genes |
| Annotation of somatic variants for genes involved in malignant transformation |
| Hugo Symbol | Variant Class | Variant Classification | dbSNP RS | HGVSc | HGVSp | HGVSp Short | SWISSPROT | BIOTYPE | SIFT | PolyPhen | Tumor Sample Barcode | Tissue | Histology | Sex | Age | Stage | Therapy Types | Drugs | Outcome |
| NEK7 | SNV | Missense_Mutation | novel | c.472A>G | p.Met158Val | p.M158V | Q8TDX7 | protein_coding | deleterious(0) | possibly_damaging(0.626) | TCGA-2W-A8YY-01 | Cervix | cervical & endocervical cancer | Female | <65 | I/II | Chemotherapy | cisplatin | CR |
| NEK7 | SNV | Missense_Mutation | novel | c.109N>C | p.Glu37Gln | p.E37Q | Q8TDX7 | protein_coding | tolerated(0.29) | benign(0.021) | TCGA-MA-AA41-01 | Cervix | cervical & endocervical cancer | Female | <65 | I/II | Unknown | Unknown | SD |
| NEK7 | SNV | Missense_Mutation | c.249N>G | p.Ile83Met | p.I83M | Q8TDX7 | protein_coding | tolerated(0.08) | probably_damaging(0.93) | TCGA-AA-3492-01 | Colorectum | colon adenocarcinoma | Female | >=65 | I/II | Unknown | Unknown | SD | |
| NEK7 | SNV | Missense_Mutation | c.288A>C | p.Lys96Asn | p.K96N | Q8TDX7 | protein_coding | deleterious(0.01) | possibly_damaging(0.776) | TCGA-AA-3510-01 | Colorectum | colon adenocarcinoma | Male | >=65 | I/II | Unknown | Unknown | SD | |
| NEK7 | SNV | Missense_Mutation | c.661T>C | p.Ser221Pro | p.S221P | Q8TDX7 | protein_coding | deleterious(0) | probably_damaging(0.998) | TCGA-AA-A00N-01 | Colorectum | colon adenocarcinoma | Male | >=65 | I/II | Unknown | Unknown | PD | |
| NEK7 | SNV | Missense_Mutation | novel | c.464G>A | p.Arg155Gln | p.R155Q | Q8TDX7 | protein_coding | tolerated(0.06) | benign(0.149) | TCGA-F5-6814-01 | Colorectum | rectum adenocarcinoma | Male | <65 | I/II | Unknown | Unknown | SD |
| NEK7 | insertion | Frame_Shift_Ins | novel | c.185_186insA | p.Val65SerfsTer5 | p.V65Sfs*5 | Q8TDX7 | protein_coding | TCGA-AA-3877-01 | Colorectum | colon adenocarcinoma | Female | >=65 | I/II | Unknown | Unknown | SD | ||
| NEK7 | SNV | Missense_Mutation | novel | c.551N>A | p.Arg184Gln | p.R184Q | Q8TDX7 | protein_coding | deleterious(0) | probably_damaging(0.998) | TCGA-A5-A0G2-01 | Endometrium | uterine corpus endometrioid carcinoma | Female | <65 | III/IV | Unknown | Unknown | SD |
| NEK7 | SNV | Missense_Mutation | novel | c.624N>G | p.Ile208Met | p.I208M | Q8TDX7 | protein_coding | tolerated(0.11) | possibly_damaging(0.714) | TCGA-A5-A0G2-01 | Endometrium | uterine corpus endometrioid carcinoma | Female | <65 | III/IV | Unknown | Unknown | SD |
| NEK7 | SNV | Missense_Mutation | novel | c.708N>A | p.Phe236Leu | p.F236L | Q8TDX7 | protein_coding | deleterious(0) | probably_damaging(1) | TCGA-A5-A0G2-01 | Endometrium | uterine corpus endometrioid carcinoma | Female | <65 | III/IV | Unknown | Unknown | SD |
| Page: 1 2 3 4 |
Top |
Related drugs of malignant transformation related genes |
| Identification of chemicals and drugs interact with genes involved in malignant transfromation |
| (DGIdb 4.0) |
| Entrez ID | Symbol | Category | Interaction Types | Drug Claim Name | Drug Name | PMIDs |
| 140609 | NEK7 | ENZYME, SERINE THREONINE KINASE, KINASE, DRUGGABLE GENOME | inhibitor | 249565885 |
| Page: 1 |

Copyright 2023-Present -The University of Texas Health Science Center at Houston |