
|
|||||
|
 | |
| |
| |
| |
| |
| |
|
Gene: NEK3 |
Gene summary for NEK3 |
| Gene information | Species | Human | Gene symbol | NEK3 | Gene ID | 4752 |
| Gene name | NIMA related kinase 3 | |
| Gene Alias | HSPK36 | |
| Cytomap | 13q14.3 | |
| Gene Type | protein-coding | GO ID | GO:0000278 | UniProtAcc | P51956 |
Top |
Malignant transformation analysis |
| Identification of the aberrant gene expression in precancerous and cancerous lesions by comparing the gene expression of stem-like cells in diseased tissues with normal stem cells |
| Entrez ID | Symbol | Replicates | Species | Organ | Tissue | Adj P-value | Log2FC | Malignancy |
| 4752 | NEK3 | HCC1_Meng | Human | Liver | HCC | 2.13e-15 | 2.48e-02 | 0.0246 |
| 4752 | NEK3 | HCC2_Meng | Human | Liver | HCC | 5.24e-09 | 6.88e-02 | 0.0107 |
| 4752 | NEK3 | HCC1 | Human | Liver | HCC | 2.07e-03 | 3.20e+00 | 0.5336 |
| 4752 | NEK3 | HCC2 | Human | Liver | HCC | 1.61e-04 | 1.65e+00 | 0.5341 |
| 4752 | NEK3 | S014 | Human | Liver | HCC | 2.95e-07 | 2.80e-01 | 0.2254 |
| 4752 | NEK3 | S015 | Human | Liver | HCC | 1.11e-08 | 4.09e-01 | 0.2375 |
| 4752 | NEK3 | S016 | Human | Liver | HCC | 4.98e-09 | 3.26e-01 | 0.2243 |
| Page: 1 |
| Tissue | Expression Dynamics | Abbreviation |
| Liver | 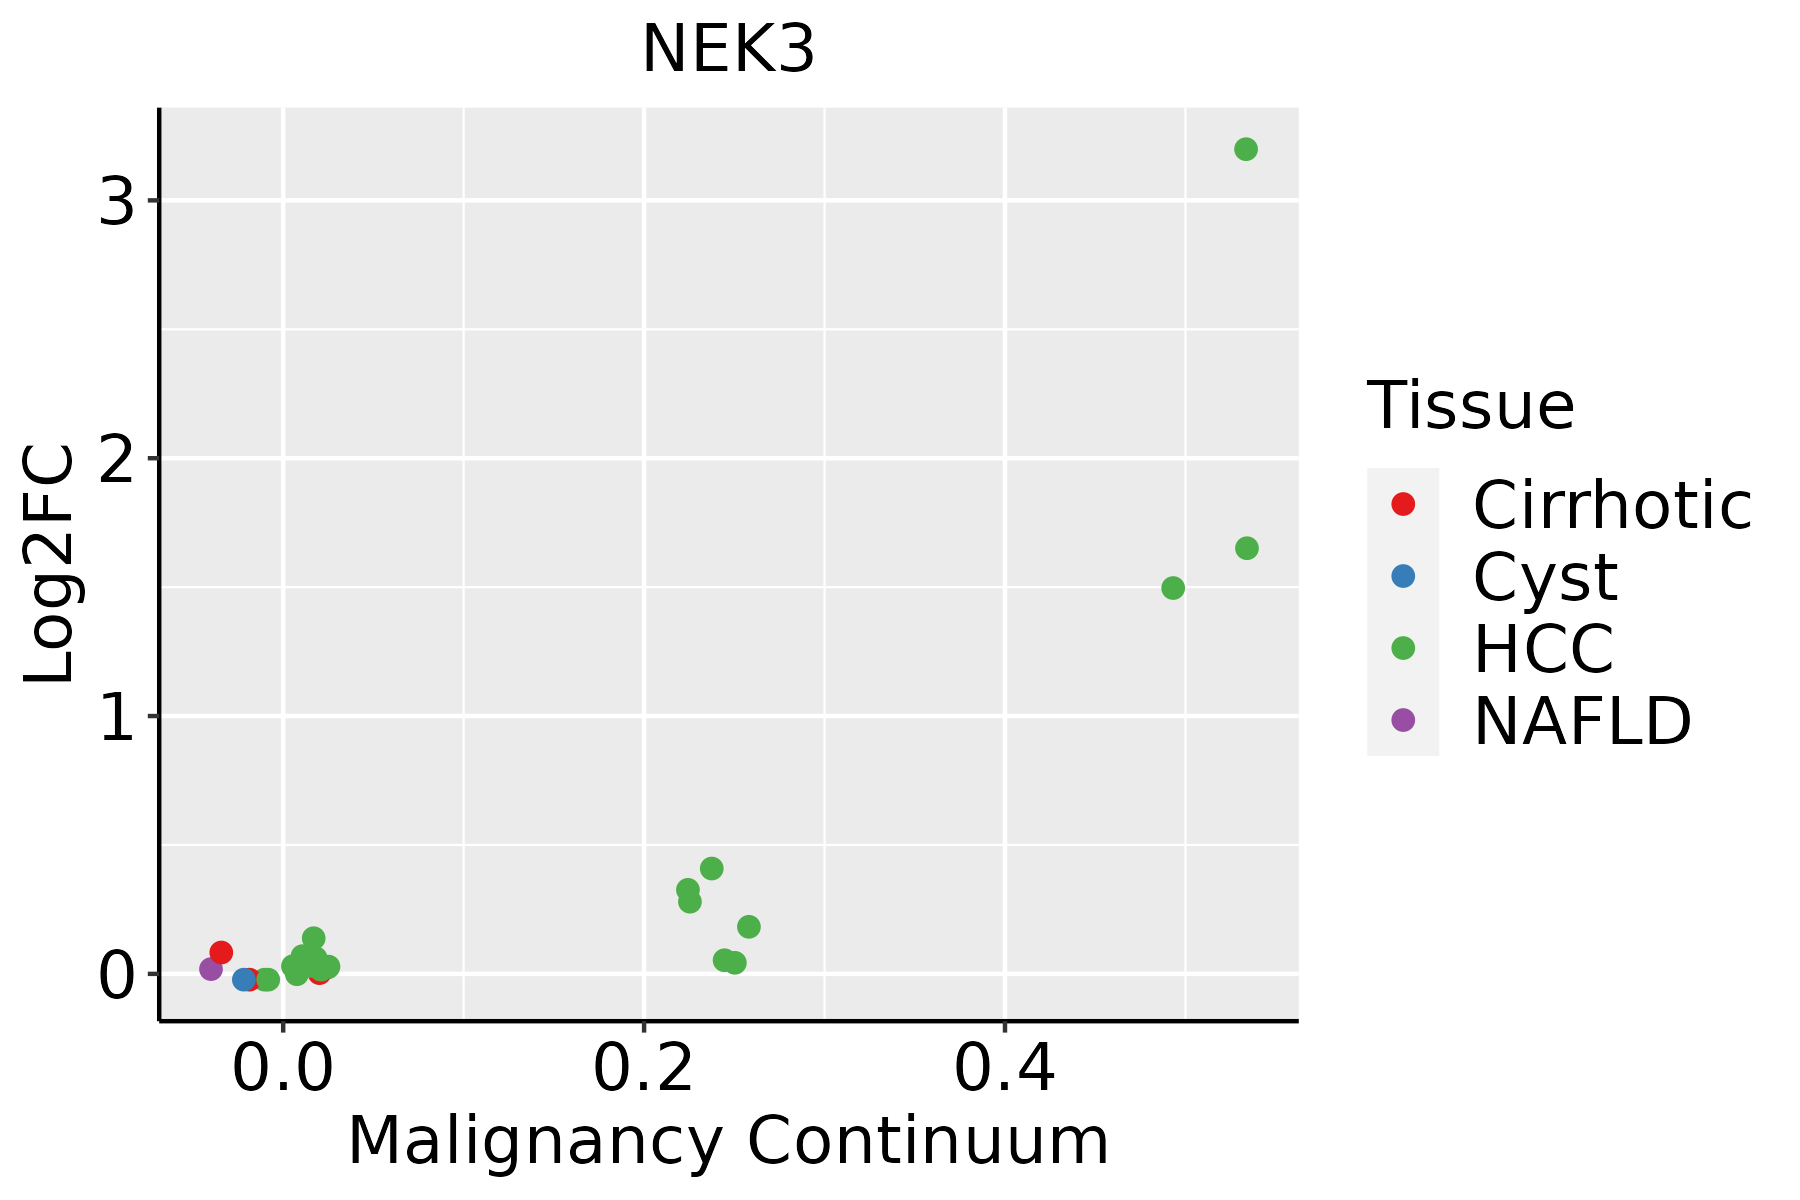 | HCC: Hepatocellular carcinoma |
| NAFLD: Non-alcoholic fatty liver disease |
| ∗log2FC in expression of this searched gene in stem-like cells from each diseased tissue sample relative to stem-like cells in normal samples in each tissue plotted against the malignancy continuum. Samples are colored based on if they are from different disease stage. |
Top |
Malignant transformation related pathway analysis |
| Find out the enriched GO biological processes and KEGG pathways involved in transition from healthy to precancer to cancer |
| Tissue | Disease Stage | Enriched GO biological Processes |
| Colorectum | AD |  |
| Colorectum | SER |  |
| Colorectum | MSS |  |
| Colorectum | MSI-H |  |
| Colorectum | FAP |  |
| ∗Top 15 enriched GO BP terms are showed in the bar plot of each disease state in each tissue. Each row represents a significant GO biological process which is colored according to the -log10(p.adjust). |
| Page: 1 2 3 4 5 6 7 8 9 |
| GO ID | Tissue | Disease Stage | Description | Gene Ratio | Bg Ratio | pvalue | p.adjust | Count |
| GO:000716322 | Liver | HCC | establishment or maintenance of cell polarity | 133/7958 | 218/18723 | 2.48e-08 | 5.73e-07 | 133 |
| GO:003001022 | Liver | HCC | establishment of cell polarity | 82/7958 | 143/18723 | 2.38e-04 | 1.79e-03 | 82 |
| GO:0098732 | Liver | HCC | macromolecule deacylation | 67/7958 | 116/18723 | 6.46e-04 | 3.99e-03 | 67 |
| GO:00356011 | Liver | HCC | protein deacylation | 64/7958 | 112/18723 | 1.23e-03 | 6.83e-03 | 64 |
| GO:00900421 | Liver | HCC | tubulin deacetylation | 11/7958 | 13/18723 | 2.38e-03 | 1.16e-02 | 11 |
| GO:0090311 | Liver | HCC | regulation of protein deacetylation | 30/7958 | 48/18723 | 4.10e-03 | 1.78e-02 | 30 |
| GO:00064761 | Liver | HCC | protein deacetylation | 55/7958 | 101/18723 | 1.01e-02 | 3.79e-02 | 55 |
| Page: 1 |
| Pathway ID | Tissue | Disease Stage | Description | Gene Ratio | Bg Ratio | pvalue | p.adjust | qvalue | Count |
| Page: 1 |
Top |
Cell-cell communication analysis |
| Identification of potential cell-cell interactions between two cell types and their ligand-receptor pairs for different disease states |
| Ligand | Receptor | LRpair | Pathway | Tissue | Disease Stage |
| Page: 1 |
Top |
Single-cell gene regulatory network inference analysis |
| Find out the significant the regulons (TFs) and the target genes of each regulon across cell types for different disease states |
| TF | Cell Type | Tissue | Disease Stage | Target Gene | RSS | Regulon Activity |
| ∗The dot plots of a searched regulon are shown for all cell subpopulations in each disease state of each tissue based on the regulon specific score inferred using pySCENIC and by calculating the average expression. |
| Page: 1 |
Top |
Somatic mutation of malignant transformation related genes |
| Annotation of somatic variants for genes involved in malignant transformation |
| Hugo Symbol | Variant Class | Variant Classification | dbSNP RS | HGVSc | HGVSp | HGVSp Short | SWISSPROT | BIOTYPE | SIFT | PolyPhen | Tumor Sample Barcode | Tissue | Histology | Sex | Age | Stage | Therapy Types | Drugs | Outcome |
| NEK3 | SNV | Missense_Mutation | novel | c.411N>T | p.Gln137His | p.Q137H | P51956 | protein_coding | deleterious(0.04) | benign(0.03) | TCGA-E9-A1RA-01 | Breast | breast invasive carcinoma | Female | <65 | I/II | Hormone Therapy | tamoxiphen | SD |
| NEK3 | SNV | Missense_Mutation | novel | c.1475N>T | p.Ser492Leu | p.S492L | P51956 | protein_coding | deleterious(0.01) | probably_damaging(0.957) | TCGA-5M-AAT6-01 | Colorectum | colon adenocarcinoma | Female | <65 | III/IV | Unknown | Unknown | PD |
| NEK3 | SNV | Missense_Mutation | novel | c.119C>A | p.Ser40Tyr | p.S40Y | P51956 | protein_coding | deleterious(0.01) | possibly_damaging(0.771) | TCGA-AA-3984-01 | Colorectum | colon adenocarcinoma | Female | <65 | I/II | Unknown | Unknown | SD |
| NEK3 | SNV | Missense_Mutation | novel | c.914N>G | p.Glu305Gly | p.E305G | P51956 | protein_coding | tolerated(0.17) | benign(0) | TCGA-AA-A00N-01 | Colorectum | colon adenocarcinoma | Male | >=65 | I/II | Unknown | Unknown | PD |
| NEK3 | SNV | Missense_Mutation | novel | c.1446G>T | p.Glu482Asp | p.E482D | P51956 | protein_coding | tolerated(0.26) | probably_damaging(0.994) | TCGA-AA-A010-01 | Colorectum | colon adenocarcinoma | Female | <65 | I/II | Chemotherapy | folinic | CR |
| NEK3 | SNV | Missense_Mutation | novel | c.1153N>G | p.Leu385Val | p.L385V | P51956 | protein_coding | tolerated(0.72) | benign(0.003) | TCGA-CA-5254-01 | Colorectum | colon adenocarcinoma | Female | <65 | I/II | Chemotherapy | oxaliplatin | CR |
| NEK3 | SNV | Missense_Mutation | novel | c.705N>T | p.Lys235Asn | p.K235N | P51956 | protein_coding | tolerated(0.05) | benign(0.161) | TCGA-D5-6930-01 | Colorectum | colon adenocarcinoma | Male | >=65 | I/II | Unknown | Unknown | SD |
| NEK3 | SNV | Missense_Mutation | novel | c.1310N>A | p.Gly437Asp | p.G437D | P51956 | protein_coding | tolerated(0.15) | benign(0.06) | TCGA-DM-A28F-01 | Colorectum | colon adenocarcinoma | Male | >=65 | III/IV | Unknown | Unknown | SD |
| NEK3 | SNV | Missense_Mutation | rs756770781 | c.1490N>A | p.Arg497Gln | p.R497Q | P51956 | protein_coding | tolerated(0.22) | benign(0.003) | TCGA-EI-6507-01 | Colorectum | rectum adenocarcinoma | Male | <65 | I/II | Unknown | Unknown | SD |
| NEK3 | SNV | Missense_Mutation | novel | c.920G>A | p.Ser307Asn | p.S307N | P51956 | protein_coding | tolerated(0.57) | benign(0.003) | TCGA-EI-6883-01 | Colorectum | rectum adenocarcinoma | Male | <65 | I/II | Chemotherapy | 5fluorouracil+leucovorin | SD |
| Page: 1 2 3 4 5 |
Top |
Related drugs of malignant transformation related genes |
| Identification of chemicals and drugs interact with genes involved in malignant transfromation |
| (DGIdb 4.0) |
| Entrez ID | Symbol | Category | Interaction Types | Drug Claim Name | Drug Name | PMIDs |
| 4752 | NEK3 | KINASE, DRUGGABLE GENOME, ENZYME, SERINE THREONINE KINASE | inhibitor | 249565802 |
| Page: 1 |

Copyright 2023-Present -The University of Texas Health Science Center at Houston |