
|
|||||
|
 | |
| |
| |
| |
| |
| |
|
Gene: NEK11 |
Gene summary for NEK11 |
| Gene information | Species | Human | Gene symbol | NEK11 | Gene ID | 79858 |
| Gene name | NIMA related kinase 11 | |
| Gene Alias | NEK11 | |
| Cytomap | 3q22.1 | |
| Gene Type | protein-coding | GO ID | GO:0000075 | UniProtAcc | B4DM56 |
Top |
Malignant transformation analysis |
| Identification of the aberrant gene expression in precancerous and cancerous lesions by comparing the gene expression of stem-like cells in diseased tissues with normal stem cells |
| Entrez ID | Symbol | Replicates | Species | Organ | Tissue | Adj P-value | Log2FC | Malignancy |
| 79858 | NEK11 | HCC2_Meng | Human | Liver | HCC | 2.17e-03 | 3.00e-02 | 0.0107 |
| 79858 | NEK11 | HCC1 | Human | Liver | HCC | 1.22e-16 | 3.22e+00 | 0.5336 |
| 79858 | NEK11 | HCC2 | Human | Liver | HCC | 1.36e-36 | 3.85e+00 | 0.5341 |
| 79858 | NEK11 | HCC5 | Human | Liver | HCC | 7.15e-05 | 1.85e+00 | 0.4932 |
| 79858 | NEK11 | RNA-P17T-P17T-4 | Human | Lung | IAC | 4.28e-05 | 5.60e-01 | 0.343 |
| 79858 | NEK11 | RNA-P6T1-P6T1-1 | Human | Lung | MIAC | 3.00e-03 | 7.30e-01 | -0.0238 |
| 79858 | NEK11 | RNA-P6T1-P6T1-4 | Human | Lung | MIAC | 2.24e-04 | 7.42e-01 | -0.0263 |
| 79858 | NEK11 | RNA-P6T2-P6T2-1 | Human | Lung | IAC | 8.58e-08 | 3.04e-01 | -0.0166 |
| 79858 | NEK11 | RNA-P6T2-P6T2-2 | Human | Lung | IAC | 6.53e-06 | 2.47e-01 | -0.0132 |
| 79858 | NEK11 | RNA-P6T2-P6T2-3 | Human | Lung | IAC | 1.85e-09 | 3.09e-01 | -0.013 |
| 79858 | NEK11 | RNA-P6T2-P6T2-4 | Human | Lung | IAC | 1.47e-07 | 3.01e-01 | -0.0121 |
| Page: 1 |
| Tissue | Expression Dynamics | Abbreviation |
| Liver | 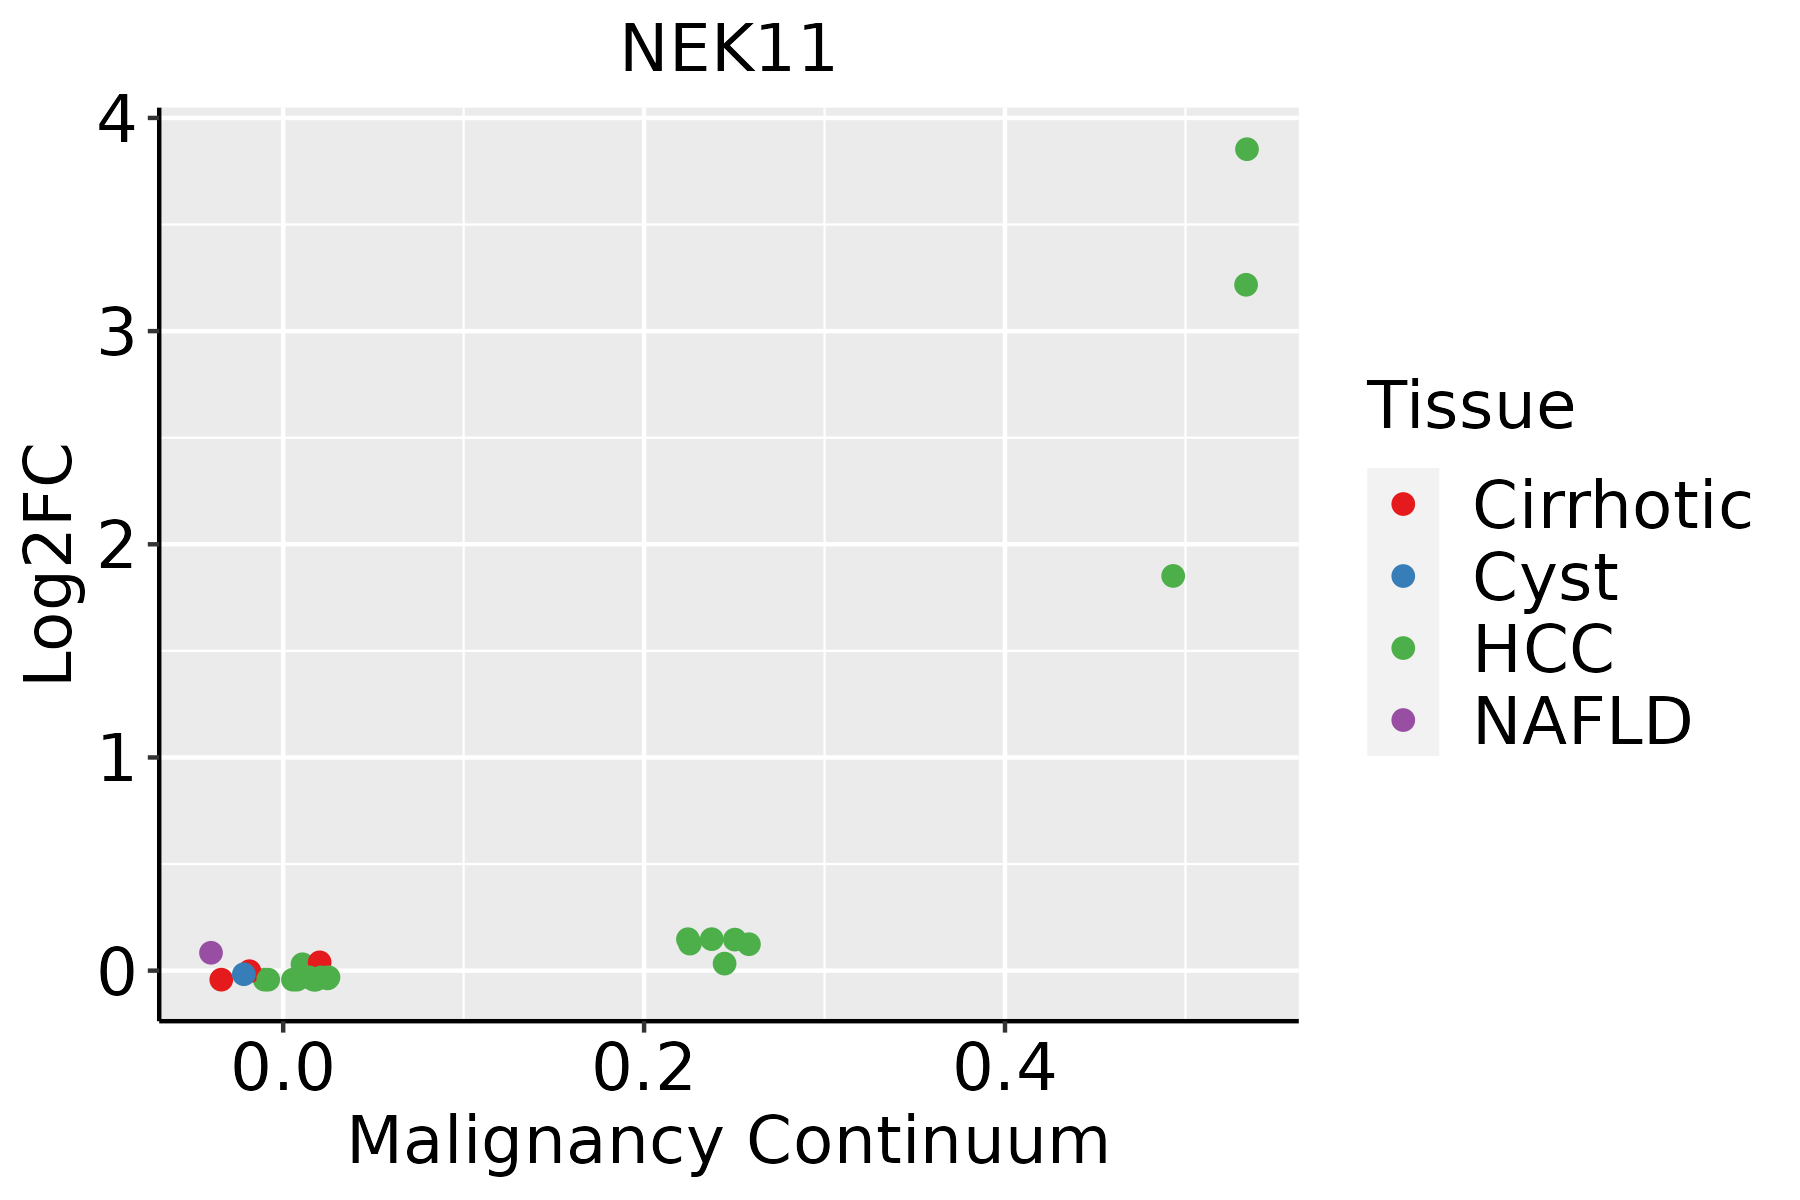 | HCC: Hepatocellular carcinoma |
| NAFLD: Non-alcoholic fatty liver disease | ||
| Lung | 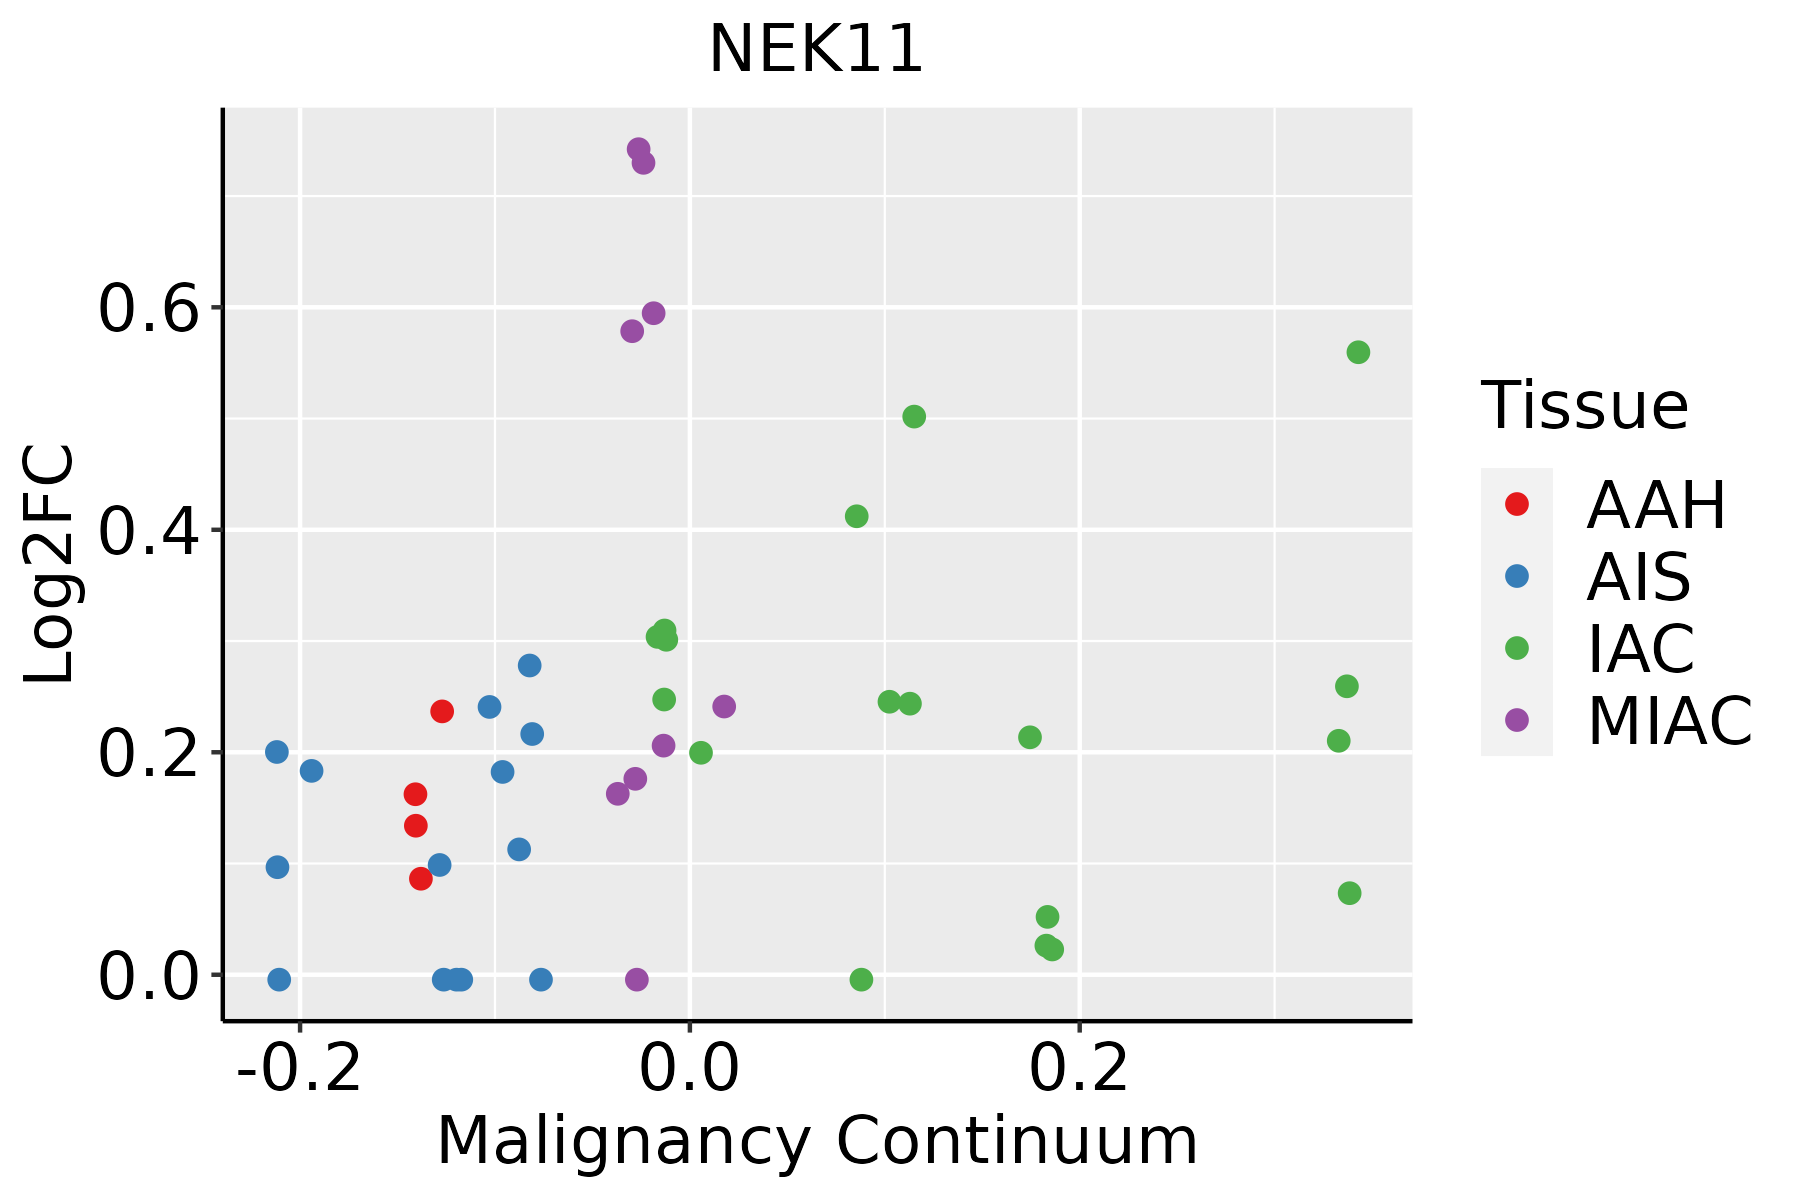 | AAH: Atypical adenomatous hyperplasia |
| AIS: Adenocarcinoma in situ | ||
| IAC: Invasive lung adenocarcinoma | ||
| MIA: Minimally invasive adenocarcinoma |
| ∗log2FC in expression of this searched gene in stem-like cells from each diseased tissue sample relative to stem-like cells in normal samples in each tissue plotted against the malignancy continuum. Samples are colored based on if they are from different disease stage. |
Top |
Malignant transformation related pathway analysis |
| Find out the enriched GO biological processes and KEGG pathways involved in transition from healthy to precancer to cancer |
| Tissue | Disease Stage | Enriched GO biological Processes |
| Colorectum | AD |  |
| Colorectum | SER |  |
| Colorectum | MSS |  |
| Colorectum | MSI-H |  |
| Colorectum | FAP |  |
| ∗Top 15 enriched GO BP terms are showed in the bar plot of each disease state in each tissue. Each row represents a significant GO biological process which is colored according to the -log10(p.adjust). |
| Page: 1 2 3 4 5 6 7 8 9 |
| GO ID | Tissue | Disease Stage | Description | Gene Ratio | Bg Ratio | pvalue | p.adjust | Count |
| GO:001657021 | Liver | HCC | histone modification | 283/7958 | 463/18723 | 2.68e-16 | 2.33e-14 | 283 |
| GO:00447722 | Liver | HCC | mitotic cell cycle phase transition | 240/7958 | 424/18723 | 2.47e-09 | 6.84e-08 | 240 |
| GO:000734611 | Liver | HCC | regulation of mitotic cell cycle | 255/7958 | 457/18723 | 4.96e-09 | 1.30e-07 | 255 |
| GO:0007059 | Liver | HCC | chromosome segregation | 197/7958 | 346/18723 | 3.57e-08 | 7.87e-07 | 197 |
| GO:19019901 | Liver | HCC | regulation of mitotic cell cycle phase transition | 167/7958 | 299/18723 | 1.96e-06 | 2.71e-05 | 167 |
| GO:19019871 | Liver | HCC | regulation of cell cycle phase transition | 211/7958 | 390/18723 | 2.11e-06 | 2.89e-05 | 211 |
| GO:00427702 | Liver | HCC | signal transduction in response to DNA damage | 103/7958 | 172/18723 | 3.05e-06 | 4.04e-05 | 103 |
| GO:00000751 | Liver | HCC | cell cycle checkpoint | 100/7958 | 169/18723 | 8.75e-06 | 1.02e-04 | 100 |
| GO:0045786 | Liver | HCC | negative regulation of cell cycle | 204/7958 | 385/18723 | 1.84e-05 | 1.99e-04 | 204 |
| GO:0045930 | Liver | HCC | negative regulation of mitotic cell cycle | 130/7958 | 235/18723 | 4.69e-05 | 4.50e-04 | 130 |
| GO:0007093 | Liver | HCC | mitotic cell cycle checkpoint | 77/7958 | 129/18723 | 6.00e-05 | 5.50e-04 | 77 |
| GO:00000771 | Liver | HCC | DNA damage checkpoint | 68/7958 | 115/18723 | 2.33e-04 | 1.77e-03 | 68 |
| GO:0031570 | Liver | HCC | DNA integrity checkpoint | 71/7958 | 123/18723 | 4.64e-04 | 3.08e-03 | 71 |
| GO:1901988 | Liver | HCC | negative regulation of cell cycle phase transition | 132/7958 | 249/18723 | 4.97e-04 | 3.25e-03 | 132 |
| GO:0010948 | Liver | HCC | negative regulation of cell cycle process | 152/7958 | 294/18723 | 8.50e-04 | 5.08e-03 | 152 |
| GO:0044773 | Liver | HCC | mitotic DNA damage checkpoint | 48/7958 | 81/18723 | 1.72e-03 | 8.96e-03 | 48 |
| GO:0044774 | Liver | HCC | mitotic DNA integrity checkpoint | 49/7958 | 85/18723 | 3.44e-03 | 1.55e-02 | 49 |
| GO:00165704 | Lung | IAC | histone modification | 93/2061 | 463/18723 | 5.41e-09 | 8.03e-07 | 93 |
| GO:00427704 | Lung | IAC | signal transduction in response to DNA damage | 45/2061 | 172/18723 | 2.06e-08 | 2.55e-06 | 45 |
| GO:00447723 | Lung | IAC | mitotic cell cycle phase transition | 85/2061 | 424/18723 | 2.69e-08 | 3.20e-06 | 85 |
| Page: 1 2 3 |
| Pathway ID | Tissue | Disease Stage | Description | Gene Ratio | Bg Ratio | pvalue | p.adjust | qvalue | Count |
| Page: 1 |
Top |
Cell-cell communication analysis |
| Identification of potential cell-cell interactions between two cell types and their ligand-receptor pairs for different disease states |
| Ligand | Receptor | LRpair | Pathway | Tissue | Disease Stage |
| Page: 1 |
Top |
Single-cell gene regulatory network inference analysis |
| Find out the significant the regulons (TFs) and the target genes of each regulon across cell types for different disease states |
| TF | Cell Type | Tissue | Disease Stage | Target Gene | RSS | Regulon Activity |
| ∗The dot plots of a searched regulon are shown for all cell subpopulations in each disease state of each tissue based on the regulon specific score inferred using pySCENIC and by calculating the average expression. |
| Page: 1 |
Top |
Somatic mutation of malignant transformation related genes |
| Annotation of somatic variants for genes involved in malignant transformation |
| Hugo Symbol | Variant Class | Variant Classification | dbSNP RS | HGVSc | HGVSp | HGVSp Short | SWISSPROT | BIOTYPE | SIFT | PolyPhen | Tumor Sample Barcode | Tissue | Histology | Sex | Age | Stage | Therapy Types | Drugs | Outcome |
| NEK11 | SNV | Missense_Mutation | c.244C>T | p.Leu82Phe | p.L82F | Q8NG66 | protein_coding | deleterious(0) | probably_damaging(0.999) | TCGA-A8-A09Z-01 | Breast | breast invasive carcinoma | Female | >=65 | I/II | Unknown | Unknown | SD | |
| NEK11 | SNV | Missense_Mutation | novel | c.815N>T | p.Pro272Leu | p.P272L | Q8NG66 | protein_coding | deleterious(0) | probably_damaging(0.995) | TCGA-BH-A0HL-01 | Breast | breast invasive carcinoma | Female | <65 | I/II | Chemotherapy | cyclophosphamide | SD |
| NEK11 | SNV | Missense_Mutation | novel | c.1441G>A | p.Asp481Asn | p.D481N | Q8NG66 | protein_coding | deleterious(0) | possibly_damaging(0.78) | TCGA-C8-A3M7-01 | Breast | breast invasive carcinoma | Female | <65 | III/IV | Unknown | Unknown | PD |
| NEK11 | SNV | Missense_Mutation | novel | c.752C>A | p.Ser251Tyr | p.S251Y | Q8NG66 | protein_coding | deleterious(0) | possibly_damaging(0.879) | TCGA-C8-A8HQ-01 | Breast | breast invasive carcinoma | Female | <65 | I/II | Unknown | Unknown | SD |
| NEK11 | SNV | Missense_Mutation | novel | c.298N>A | p.Glu100Lys | p.E100K | Q8NG66 | protein_coding | deleterious(0.01) | probably_damaging(0.995) | TCGA-PE-A5DE-01 | Breast | breast invasive carcinoma | Female | <65 | I/II | Chemotherapy | taxotere | CR |
| NEK11 | SNV | Missense_Mutation | novel | c.731T>G | p.Ile244Ser | p.I244S | Q8NG66 | protein_coding | deleterious(0) | probably_damaging(0.999) | TCGA-2W-A8YY-01 | Cervix | cervical & endocervical cancer | Female | <65 | I/II | Chemotherapy | cisplatin | CR |
| NEK11 | SNV | Missense_Mutation | novel | c.1357N>A | p.Glu453Lys | p.E453K | Q8NG66 | protein_coding | tolerated(0.25) | benign(0.022) | TCGA-C5-A3HD-01 | Cervix | cervical & endocervical cancer | Female | <65 | I/II | Chemotherapy | cisplatin | SD |
| NEK11 | SNV | Missense_Mutation | novel | c.1165N>A | p.Asp389Asn | p.D389N | Q8NG66 | protein_coding | tolerated(0.36) | benign(0.024) | TCGA-C5-A7UE-01 | Cervix | cervical & endocervical cancer | Female | <65 | I/II | Chemotherapy | cisplatin | SD |
| NEK11 | SNV | Missense_Mutation | c.356A>T | p.Lys119Ile | p.K119I | Q8NG66 | protein_coding | deleterious(0) | possibly_damaging(0.624) | TCGA-AY-4071-01 | Colorectum | colon adenocarcinoma | Female | <65 | I/II | Unknown | Unknown | SD | |
| NEK11 | SNV | Missense_Mutation | rs142330323 | c.1141C>T | p.Arg381Trp | p.R381W | Q8NG66 | protein_coding | deleterious(0.02) | possibly_damaging(0.628) | TCGA-AZ-4614-01 | Colorectum | colon adenocarcinoma | Female | >=65 | I/II | Unknown | Unknown | PD |
| Page: 1 2 3 4 5 6 7 8 |
Top |
Related drugs of malignant transformation related genes |
| Identification of chemicals and drugs interact with genes involved in malignant transfromation |
| (DGIdb 4.0) |
| Entrez ID | Symbol | Category | Interaction Types | Drug Claim Name | Drug Name | PMIDs |
| 79858 | NEK11 | DRUGGABLE GENOME, KINASE, SERINE THREONINE KINASE, ENZYME | inhibitor | 249565802 |
| Page: 1 |

Copyright 2023-Present -The University of Texas Health Science Center at Houston |