
|
|||||
|
 | |
| |
| |
| |
| |
| |
|
Gene: NEIL2 |
Gene summary for NEIL2 |
| Gene information | Species | Human | Gene symbol | NEIL2 | Gene ID | 252969 |
| Gene name | nei like DNA glycosylase 2 | |
| Gene Alias | NEH2 | |
| Cytomap | 8p23.1 | |
| Gene Type | protein-coding | GO ID | GO:0006139 | UniProtAcc | A0A024R361 |
Top |
Malignant transformation analysis |
| Identification of the aberrant gene expression in precancerous and cancerous lesions by comparing the gene expression of stem-like cells in diseased tissues with normal stem cells |
| Entrez ID | Symbol | Replicates | Species | Organ | Tissue | Adj P-value | Log2FC | Malignancy |
| 252969 | NEIL2 | LZE8T | Human | Esophagus | ESCC | 6.44e-04 | 1.44e-01 | 0.067 |
| 252969 | NEIL2 | LZE24T | Human | Esophagus | ESCC | 2.68e-03 | 1.76e-01 | 0.0596 |
| 252969 | NEIL2 | LZE21T | Human | Esophagus | ESCC | 2.67e-02 | 1.59e-01 | 0.0655 |
| 252969 | NEIL2 | P2T-E | Human | Esophagus | ESCC | 6.56e-15 | 2.16e-01 | 0.1177 |
| 252969 | NEIL2 | P5T-E | Human | Esophagus | ESCC | 1.66e-02 | 6.73e-02 | 0.1327 |
| 252969 | NEIL2 | P8T-E | Human | Esophagus | ESCC | 4.17e-05 | 1.17e-01 | 0.0889 |
| 252969 | NEIL2 | P9T-E | Human | Esophagus | ESCC | 5.08e-14 | 1.53e-01 | 0.1131 |
| 252969 | NEIL2 | P10T-E | Human | Esophagus | ESCC | 2.03e-09 | 1.62e-01 | 0.116 |
| 252969 | NEIL2 | P11T-E | Human | Esophagus | ESCC | 2.63e-03 | 2.00e-01 | 0.1426 |
| 252969 | NEIL2 | P12T-E | Human | Esophagus | ESCC | 4.12e-11 | 1.92e-01 | 0.1122 |
| 252969 | NEIL2 | P15T-E | Human | Esophagus | ESCC | 1.29e-02 | 6.42e-02 | 0.1149 |
| 252969 | NEIL2 | P16T-E | Human | Esophagus | ESCC | 5.05e-21 | 3.18e-01 | 0.1153 |
| 252969 | NEIL2 | P17T-E | Human | Esophagus | ESCC | 2.96e-04 | 2.15e-01 | 0.1278 |
| 252969 | NEIL2 | P19T-E | Human | Esophagus | ESCC | 4.08e-03 | 4.40e-01 | 0.1662 |
| 252969 | NEIL2 | P20T-E | Human | Esophagus | ESCC | 1.43e-19 | 3.89e-01 | 0.1124 |
| 252969 | NEIL2 | P21T-E | Human | Esophagus | ESCC | 6.62e-20 | 3.35e-01 | 0.1617 |
| 252969 | NEIL2 | P22T-E | Human | Esophagus | ESCC | 7.31e-14 | 2.68e-01 | 0.1236 |
| 252969 | NEIL2 | P23T-E | Human | Esophagus | ESCC | 2.13e-09 | 1.18e-01 | 0.108 |
| 252969 | NEIL2 | P24T-E | Human | Esophagus | ESCC | 2.06e-08 | 1.97e-01 | 0.1287 |
| 252969 | NEIL2 | P26T-E | Human | Esophagus | ESCC | 4.17e-05 | 1.21e-01 | 0.1276 |
| Page: 1 2 3 |
| Tissue | Expression Dynamics | Abbreviation |
| Esophagus | 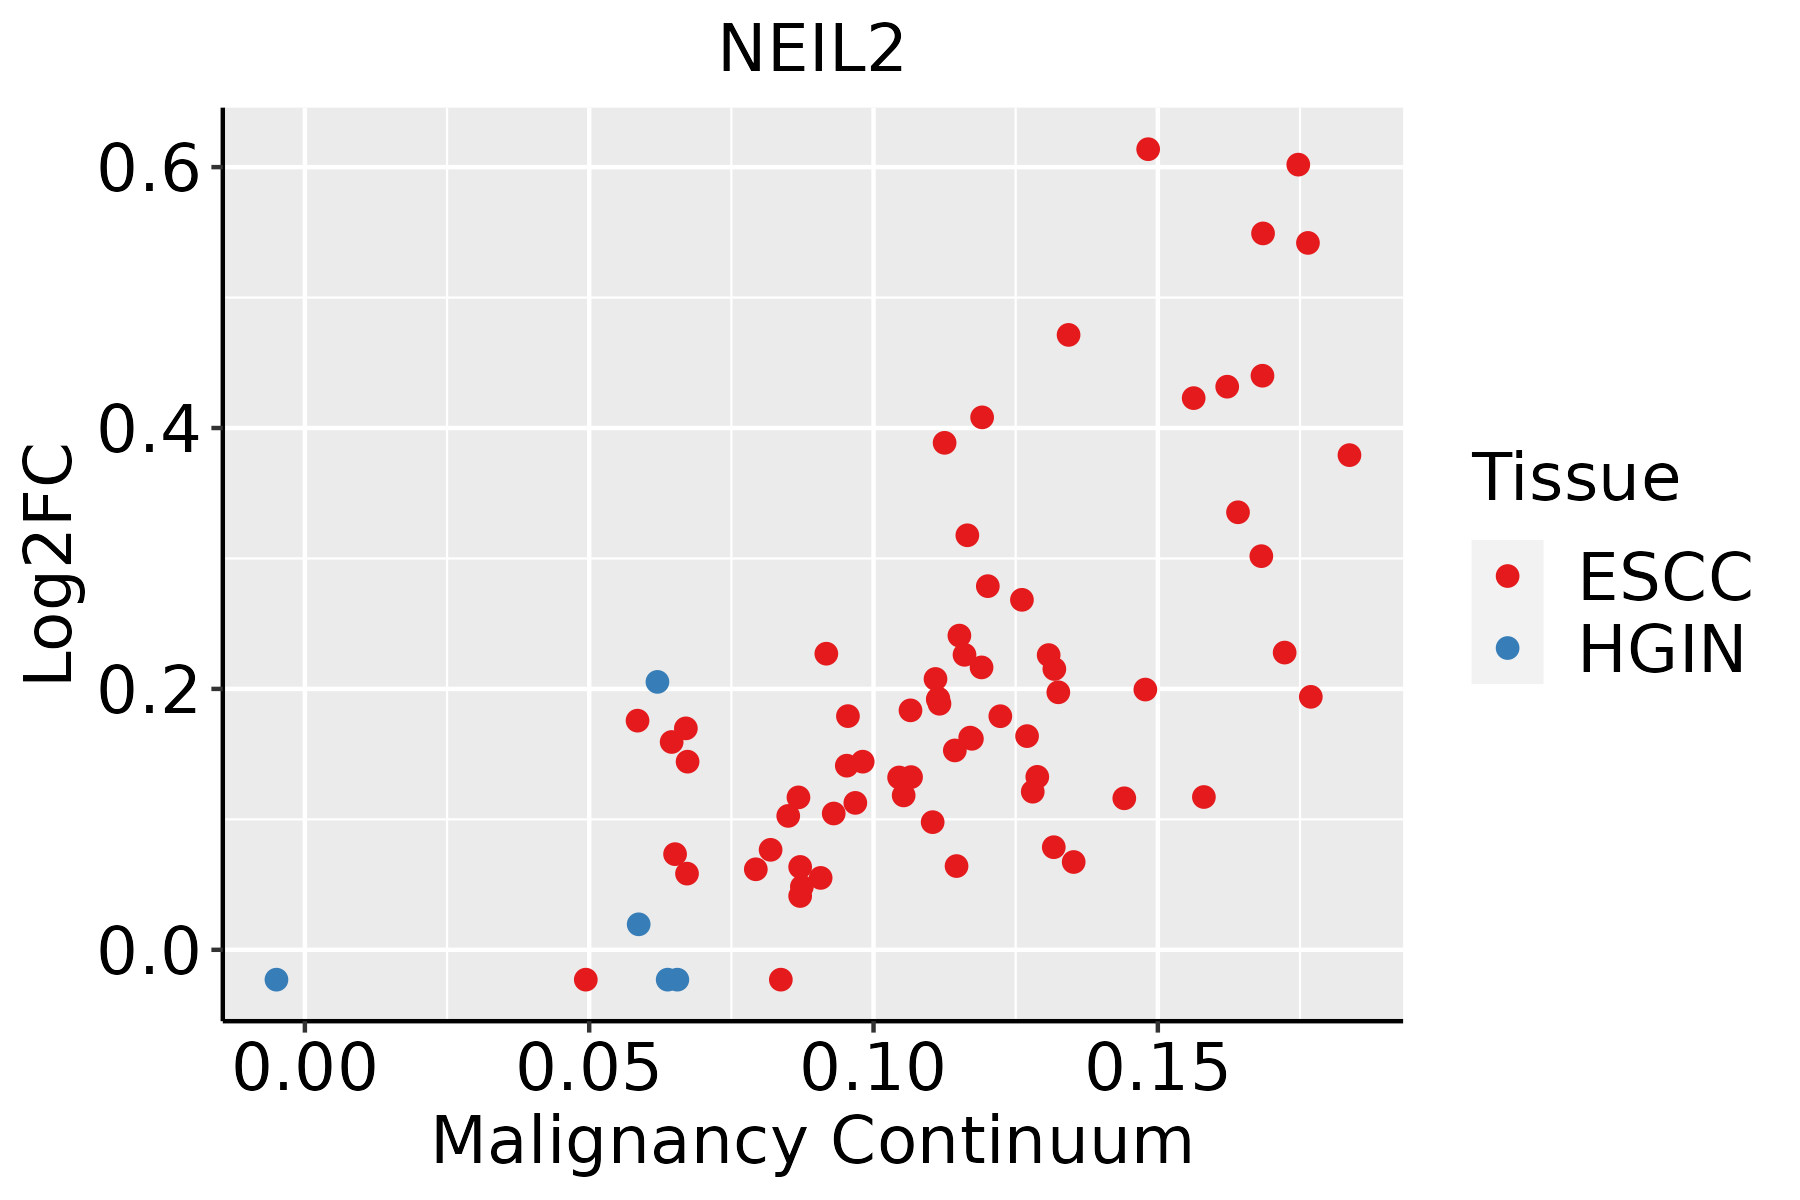 | ESCC: Esophageal squamous cell carcinoma |
| HGIN: High-grade intraepithelial neoplasias | ||
| LGIN: Low-grade intraepithelial neoplasias |
| ∗log2FC in expression of this searched gene in stem-like cells from each diseased tissue sample relative to stem-like cells in normal samples in each tissue plotted against the malignancy continuum. Samples are colored based on if they are from different disease stage. |
Top |
Malignant transformation related pathway analysis |
| Find out the enriched GO biological processes and KEGG pathways involved in transition from healthy to precancer to cancer |
| Tissue | Disease Stage | Enriched GO biological Processes |
| Colorectum | AD |  |
| Colorectum | SER |  |
| Colorectum | MSS |  |
| Colorectum | MSI-H |  |
| Colorectum | FAP |  |
| ∗Top 15 enriched GO BP terms are showed in the bar plot of each disease state in each tissue. Each row represents a significant GO biological process which is colored according to the -log10(p.adjust). |
| Page: 1 2 3 4 5 6 7 8 9 |
| GO ID | Tissue | Disease Stage | Description | Gene Ratio | Bg Ratio | pvalue | p.adjust | Count |
| GO:0034655110 | Esophagus | ESCC | nucleobase-containing compound catabolic process | 272/8552 | 407/18723 | 2.92e-18 | 2.90e-16 | 272 |
| GO:004670018 | Esophagus | ESCC | heterocycle catabolic process | 286/8552 | 445/18723 | 1.12e-15 | 7.47e-14 | 286 |
| GO:004427019 | Esophagus | ESCC | cellular nitrogen compound catabolic process | 288/8552 | 451/18723 | 3.03e-15 | 1.79e-13 | 288 |
| GO:001943918 | Esophagus | ESCC | aromatic compound catabolic process | 295/8552 | 467/18723 | 1.09e-14 | 5.98e-13 | 295 |
| GO:190136118 | Esophagus | ESCC | organic cyclic compound catabolic process | 307/8552 | 495/18723 | 9.99e-14 | 4.80e-12 | 307 |
| GO:0006753110 | Esophagus | ESCC | nucleoside phosphate metabolic process | 288/8552 | 497/18723 | 1.80e-08 | 3.50e-07 | 288 |
| GO:0009117111 | Esophagus | ESCC | nucleotide metabolic process | 282/8552 | 489/18723 | 4.70e-08 | 8.50e-07 | 282 |
| GO:00062843 | Esophagus | ESCC | base-excision repair | 33/8552 | 43/18723 | 3.25e-05 | 2.69e-04 | 33 |
| GO:00062203 | Esophagus | ESCC | pyrimidine nucleotide metabolic process | 35/8552 | 50/18723 | 4.33e-04 | 2.44e-03 | 35 |
| GO:000926212 | Esophagus | ESCC | deoxyribonucleotide metabolic process | 31/8552 | 44/18723 | 7.70e-04 | 3.99e-03 | 31 |
| GO:00725273 | Esophagus | ESCC | pyrimidine-containing compound metabolic process | 52/8552 | 82/18723 | 9.03e-04 | 4.61e-03 | 52 |
| GO:19011362 | Esophagus | ESCC | carbohydrate derivative catabolic process | 99/8552 | 172/18723 | 1.11e-03 | 5.54e-03 | 99 |
| GO:001969212 | Esophagus | ESCC | deoxyribose phosphate metabolic process | 29/8552 | 42/18723 | 1.87e-03 | 8.46e-03 | 29 |
| GO:000939412 | Esophagus | ESCC | 2'-deoxyribonucleotide metabolic process | 27/8552 | 40/18723 | 4.39e-03 | 1.73e-02 | 27 |
| GO:0006304 | Esophagus | ESCC | DNA modification | 68/8552 | 120/18723 | 9.95e-03 | 3.42e-02 | 68 |
| GO:000921912 | Esophagus | ESCC | pyrimidine deoxyribonucleotide metabolic process | 17/8552 | 24/18723 | 1.13e-02 | 3.81e-02 | 17 |
| Page: 1 |
| Pathway ID | Tissue | Disease Stage | Description | Gene Ratio | Bg Ratio | pvalue | p.adjust | qvalue | Count |
| hsa034104 | Esophagus | ESCC | Base excision repair | 38/4205 | 44/8465 | 3.59e-07 | 2.62e-06 | 1.34e-06 | 38 |
| hsa0341011 | Esophagus | ESCC | Base excision repair | 38/4205 | 44/8465 | 3.59e-07 | 2.62e-06 | 1.34e-06 | 38 |
| Page: 1 |
Top |
Cell-cell communication analysis |
| Identification of potential cell-cell interactions between two cell types and their ligand-receptor pairs for different disease states |
| Ligand | Receptor | LRpair | Pathway | Tissue | Disease Stage |
| Page: 1 |
Top |
Single-cell gene regulatory network inference analysis |
| Find out the significant the regulons (TFs) and the target genes of each regulon across cell types for different disease states |
| TF | Cell Type | Tissue | Disease Stage | Target Gene | RSS | Regulon Activity |
| ∗The dot plots of a searched regulon are shown for all cell subpopulations in each disease state of each tissue based on the regulon specific score inferred using pySCENIC and by calculating the average expression. |
| Page: 1 |
Top |
Somatic mutation of malignant transformation related genes |
| Annotation of somatic variants for genes involved in malignant transformation |
| Hugo Symbol | Variant Class | Variant Classification | dbSNP RS | HGVSc | HGVSp | HGVSp Short | SWISSPROT | BIOTYPE | SIFT | PolyPhen | Tumor Sample Barcode | Tissue | Histology | Sex | Age | Stage | Therapy Types | Drugs | Outcome |
| NEIL2 | insertion | Frame_Shift_Ins | novel | c.811_812insTAGGACCATGGGAGTCCCTGTGCACTCAGGAGCGAAGAGCCGTC | p.Trp271LeufsTer43 | p.W271Lfs*43 | Q969S2 | protein_coding | TCGA-B6-A0RE-01 | Breast | breast invasive carcinoma | Female | <65 | I/II | Unknown | Unknown | SD | ||
| NEIL2 | insertion | In_Frame_Ins | novel | c.708_709insGACTCAGTCCACTGTGGGTTACTAAAGATTGCAATGAAT | p.Glu236_Ala237insAspSerValHisCysGlyLeuLeuLysIleAlaMetAsn | p.E236_A237insDSVHCGLLKIAMN | Q969S2 | protein_coding | TCGA-BH-A0B1-01 | Breast | breast invasive carcinoma | Female | >=65 | I/II | Chemotherapy | adriamycin | SD | ||
| NEIL2 | insertion | Frame_Shift_Ins | novel | c.981_982insTTTTGTAGAGA | p.Gln328PhefsTer43 | p.Q328Ffs*43 | Q969S2 | protein_coding | TCGA-BH-A0HK-01 | Breast | breast invasive carcinoma | Female | >=65 | I/II | Hormone Therapy | arimidex | SD | ||
| NEIL2 | insertion | Frame_Shift_Ins | novel | c.983_984insAGAAGCTCTCACT | p.Cys329GlufsTer25 | p.C329Efs*25 | Q969S2 | protein_coding | TCGA-BH-A0HK-01 | Breast | breast invasive carcinoma | Female | >=65 | I/II | Hormone Therapy | arimidex | SD | ||
| NEIL2 | SNV | Missense_Mutation | c.197N>T | p.Gly66Val | p.G66V | Q969S2 | protein_coding | deleterious(0.03) | possibly_damaging(0.643) | TCGA-AA-3833-01 | Colorectum | colon adenocarcinoma | Female | <65 | I/II | Unknown | Unknown | SD | |
| NEIL2 | SNV | Missense_Mutation | c.253N>T | p.Asp85Tyr | p.D85Y | Q969S2 | protein_coding | deleterious(0.03) | possibly_damaging(0.556) | TCGA-AA-3858-01 | Colorectum | colon adenocarcinoma | Male | >=65 | I/II | Unknown | Unknown | SD | |
| NEIL2 | SNV | Missense_Mutation | c.138G>T | p.Gln46His | p.Q46H | Q969S2 | protein_coding | deleterious(0) | probably_damaging(0.964) | TCGA-AA-3966-01 | Colorectum | colon adenocarcinoma | Female | >=65 | I/II | Unknown | Unknown | SD | |
| NEIL2 | deletion | Frame_Shift_Del | novel | c.190delN | p.Pro65LeufsTer79 | p.P65Lfs*79 | Q969S2 | protein_coding | TCGA-AA-3950-01 | Colorectum | colon adenocarcinoma | Female | >=65 | I/II | Unknown | Unknown | SD | ||
| NEIL2 | SNV | Missense_Mutation | rs148057216 | c.767G>A | p.Arg256His | p.R256H | Q969S2 | protein_coding | tolerated(0.27) | benign(0.001) | TCGA-A5-A0G2-01 | Endometrium | uterine corpus endometrioid carcinoma | Female | <65 | III/IV | Unknown | Unknown | SD |
| NEIL2 | SNV | Missense_Mutation | c.31N>T | p.His11Tyr | p.H11Y | Q969S2 | protein_coding | tolerated(0.06) | probably_damaging(0.977) | TCGA-AX-A06D-01 | Endometrium | uterine corpus endometrioid carcinoma | Female | >=65 | III/IV | Chemotherapy | carboplatin | PD |
| Page: 1 2 3 |
Top |
Related drugs of malignant transformation related genes |
| Identification of chemicals and drugs interact with genes involved in malignant transfromation |
| (DGIdb 4.0) |
| Entrez ID | Symbol | Category | Interaction Types | Drug Claim Name | Drug Name | PMIDs |
| Page: 1 |

Copyright 2023-Present -The University of Texas Health Science Center at Houston |