
|
|||||
|
 | |
| |
| |
| |
| |
| |
|
Gene: NEFM |
Gene summary for NEFM |
| Gene information | Species | Human | Gene symbol | NEFM | Gene ID | 4741 |
| Gene name | neurofilament medium chain | |
| Gene Alias | NEF3 | |
| Cytomap | 8p21.2 | |
| Gene Type | protein-coding | GO ID | GO:0006996 | UniProtAcc | Q9UK51 |
Top |
Malignant transformation analysis |
| Identification of the aberrant gene expression in precancerous and cancerous lesions by comparing the gene expression of stem-like cells in diseased tissues with normal stem cells |
| Entrez ID | Symbol | Replicates | Species | Organ | Tissue | Adj P-value | Log2FC | Malignancy |
| 4741 | NEFM | P5T-E | Human | Esophagus | ESCC | 1.54e-08 | 4.19e-01 | 0.1327 |
| 4741 | NEFM | P10T-E | Human | Esophagus | ESCC | 5.12e-07 | 1.88e-01 | 0.116 |
| 4741 | NEFM | P24T-E | Human | Esophagus | ESCC | 3.43e-04 | 1.14e-01 | 0.1287 |
| 4741 | NEFM | P26T-E | Human | Esophagus | ESCC | 9.64e-05 | 1.95e-01 | 0.1276 |
| 4741 | NEFM | P30T-E | Human | Esophagus | ESCC | 4.55e-14 | 1.16e+00 | 0.137 |
| 4741 | NEFM | P36T-E | Human | Esophagus | ESCC | 3.91e-06 | 8.26e-01 | 0.1187 |
| 4741 | NEFM | P47T-E | Human | Esophagus | ESCC | 1.51e-08 | 2.23e-01 | 0.1067 |
| 4741 | NEFM | P107T-E | Human | Esophagus | ESCC | 1.54e-74 | 3.06e+00 | 0.171 |
| 4741 | NEFM | P1_cSCC | Human | Skin | cSCC | 2.52e-18 | 1.22e+00 | 0.0292 |
| 4741 | NEFM | P10_cSCC | Human | Skin | cSCC | 6.21e-29 | 1.64e+00 | 0.1017 |
| Page: 1 |
| Tissue | Expression Dynamics | Abbreviation |
| Esophagus |  | ESCC: Esophageal squamous cell carcinoma |
| HGIN: High-grade intraepithelial neoplasias | ||
| LGIN: Low-grade intraepithelial neoplasias | ||
| Skin | 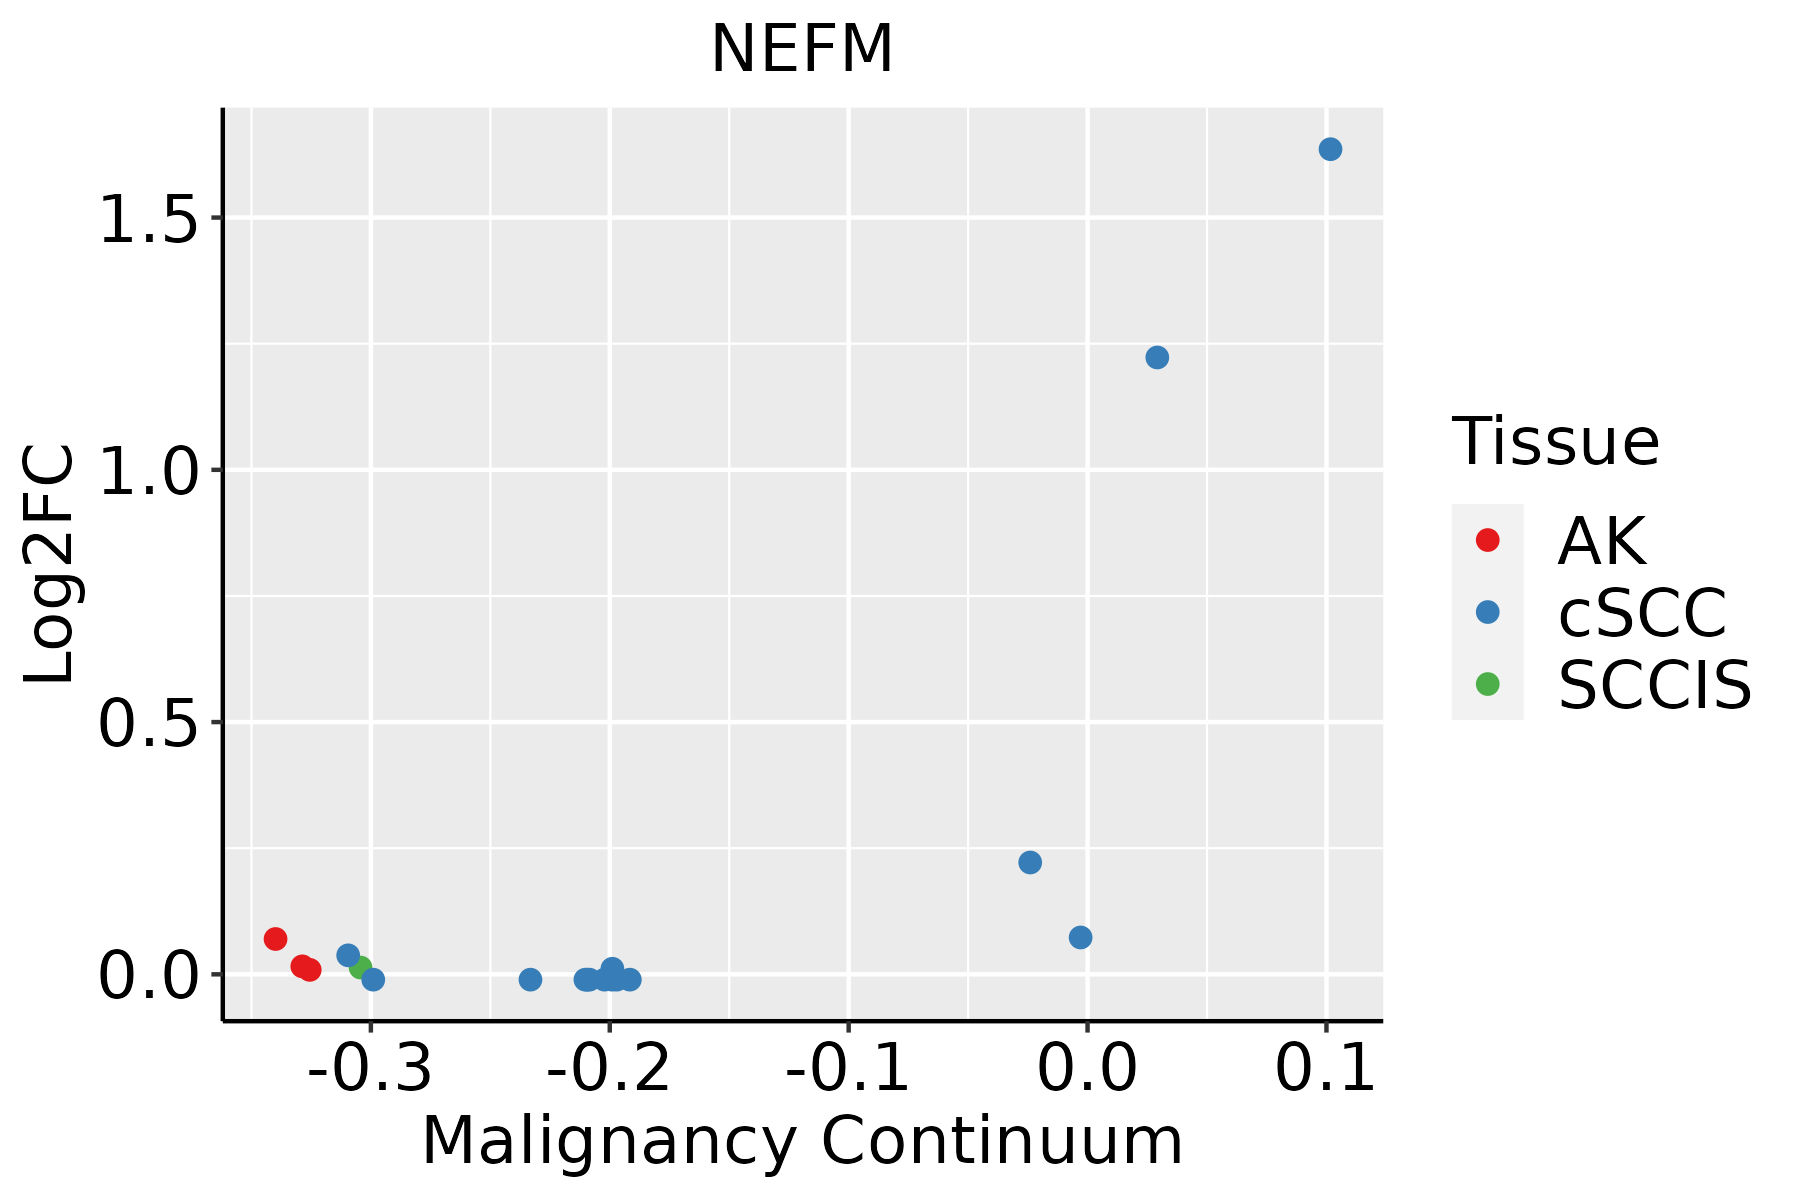 | AK: Actinic keratosis |
| cSCC: Cutaneous squamous cell carcinoma | ||
| SCCIS:squamous cell carcinoma in situ |
| ∗log2FC in expression of this searched gene in stem-like cells from each diseased tissue sample relative to stem-like cells in normal samples in each tissue plotted against the malignancy continuum. Samples are colored based on if they are from different disease stage. |
Top |
Malignant transformation related pathway analysis |
| Find out the enriched GO biological processes and KEGG pathways involved in transition from healthy to precancer to cancer |
| Tissue | Disease Stage | Enriched GO biological Processes |
| Colorectum | AD |  |
| Colorectum | SER |  |
| Colorectum | MSS |  |
| Colorectum | MSI-H |  |
| Colorectum | FAP |  |
| ∗Top 15 enriched GO BP terms are showed in the bar plot of each disease state in each tissue. Each row represents a significant GO biological process which is colored according to the -log10(p.adjust). |
| Page: 1 2 3 4 5 6 7 8 9 |
| GO ID | Tissue | Disease Stage | Description | Gene Ratio | Bg Ratio | pvalue | p.adjust | Count |
| GO:00451035 | Esophagus | ESCC | intermediate filament-based process | 32/8552 | 52/18723 | 1.55e-02 | 4.97e-02 | 32 |
| GO:004510423 | Skin | cSCC | intermediate filament cytoskeleton organization | 24/4864 | 51/18723 | 9.43e-04 | 6.42e-03 | 24 |
| GO:004510323 | Skin | cSCC | intermediate filament-based process | 24/4864 | 52/18723 | 1.32e-03 | 8.50e-03 | 24 |
| Page: 1 |
| Pathway ID | Tissue | Disease Stage | Description | Gene Ratio | Bg Ratio | pvalue | p.adjust | qvalue | Count |
| hsa05014210 | Esophagus | ESCC | Amyotrophic lateral sclerosis | 266/4205 | 364/8465 | 1.31e-20 | 2.20e-18 | 1.13e-18 | 266 |
| hsa05022210 | Esophagus | ESCC | Pathways of neurodegeneration - multiple diseases | 318/4205 | 476/8465 | 6.10e-15 | 2.04e-13 | 1.05e-13 | 318 |
| hsa0501438 | Esophagus | ESCC | Amyotrophic lateral sclerosis | 266/4205 | 364/8465 | 1.31e-20 | 2.20e-18 | 1.13e-18 | 266 |
| hsa0502238 | Esophagus | ESCC | Pathways of neurodegeneration - multiple diseases | 318/4205 | 476/8465 | 6.10e-15 | 2.04e-13 | 1.05e-13 | 318 |
| Page: 1 |
Top |
Cell-cell communication analysis |
| Identification of potential cell-cell interactions between two cell types and their ligand-receptor pairs for different disease states |
| Ligand | Receptor | LRpair | Pathway | Tissue | Disease Stage |
| Page: 1 |
Top |
Single-cell gene regulatory network inference analysis |
| Find out the significant the regulons (TFs) and the target genes of each regulon across cell types for different disease states |
| TF | Cell Type | Tissue | Disease Stage | Target Gene | RSS | Regulon Activity |
| ∗The dot plots of a searched regulon are shown for all cell subpopulations in each disease state of each tissue based on the regulon specific score inferred using pySCENIC and by calculating the average expression. |
| Page: 1 |
Top |
Somatic mutation of malignant transformation related genes |
| Annotation of somatic variants for genes involved in malignant transformation |
| Hugo Symbol | Variant Class | Variant Classification | dbSNP RS | HGVSc | HGVSp | HGVSp Short | SWISSPROT | BIOTYPE | SIFT | PolyPhen | Tumor Sample Barcode | Tissue | Histology | Sex | Age | Stage | Therapy Types | Drugs | Outcome |
| NEFM | SNV | Missense_Mutation | rs778764312 | c.1498G>A | p.Glu500Lys | p.E500K | P07197 | protein_coding | tolerated(0.14) | benign(0.124) | TCGA-A8-A07I-01 | Breast | breast invasive carcinoma | Female | >=65 | III/IV | Chemotherapy | 5-fluorouracil | CR |
| NEFM | SNV | Missense_Mutation | rs61751047 | c.1444N>A | p.Val482Ile | p.V482I | P07197 | protein_coding | tolerated(0.18) | benign(0) | TCGA-B6-A0I5-01 | Breast | breast invasive carcinoma | Female | <65 | I/II | Unknown | Unknown | SD |
| NEFM | SNV | Missense_Mutation | c.1759N>G | p.Lys587Glu | p.K587E | P07197 | protein_coding | tolerated(0.16) | benign(0.007) | TCGA-BH-A1EN-01 | Breast | breast invasive carcinoma | Female | >=65 | I/II | Unknown | Unknown | SD | |
| NEFM | SNV | Missense_Mutation | c.499N>A | p.Glu167Lys | p.E167K | P07197 | protein_coding | deleterious(0.02) | possibly_damaging(0.448) | TCGA-BH-A1FC-01 | Breast | breast invasive carcinoma | Female | >=65 | I/II | Unknown | Unknown | SD | |
| NEFM | SNV | Missense_Mutation | novel | c.2477N>G | p.Glu826Gly | p.E826G | P07197 | protein_coding | deleterious_low_confidence(0) | benign(0.165) | TCGA-EW-A1PC-01 | Breast | breast invasive carcinoma | Female | >=65 | I/II | Hormone Therapy | tamoxiphen | SD |
| NEFM | SNV | Missense_Mutation | c.1513G>C | p.Glu505Gln | p.E505Q | P07197 | protein_coding | tolerated(0.25) | benign(0.001) | TCGA-C5-A2LX-01 | Cervix | cervical & endocervical cancer | Female | <65 | I/II | Chemotherapy | cisplatin | SD | |
| NEFM | SNV | Missense_Mutation | novel | c.375N>T | p.Gln125His | p.Q125H | P07197 | protein_coding | tolerated(0.43) | probably_damaging(0.989) | TCGA-JW-A5VJ-01 | Cervix | cervical & endocervical cancer | Female | <65 | I/II | Unknown | Unknown | PD |
| NEFM | SNV | Missense_Mutation | novel | c.1004N>A | p.Arg335His | p.R335H | P07197 | protein_coding | deleterious(0.04) | benign(0.244) | TCGA-VS-A9UJ-01 | Cervix | cervical & endocervical cancer | Female | <65 | I/II | Unknown | Unknown | PD |
| NEFM | SNV | Missense_Mutation | c.1411N>A | p.Glu471Lys | p.E471K | P07197 | protein_coding | deleterious(0.01) | benign(0.086) | TCGA-ZJ-AAXN-01 | Cervix | cervical & endocervical cancer | Female | <65 | I/II | Unknown | Unknown | SD | |
| NEFM | SNV | Missense_Mutation | c.2719N>A | p.Ala907Thr | p.A907T | P07197 | protein_coding | deleterious_low_confidence(0) | probably_damaging(0.99) | TCGA-A6-3809-01 | Colorectum | colon adenocarcinoma | Female | >=65 | I/II | Unknown | Unknown | SD |
| Page: 1 2 3 4 5 6 7 8 9 10 11 12 |
Top |
Related drugs of malignant transformation related genes |
| Identification of chemicals and drugs interact with genes involved in malignant transfromation |
| (DGIdb 4.0) |
| Entrez ID | Symbol | Category | Interaction Types | Drug Claim Name | Drug Name | PMIDs |
| Page: 1 |

Copyright 2023-Present -The University of Texas Health Science Center at Houston |