
|
|||||
|
 | |
| |
| |
| |
| |
| |
|
Gene: NEFL |
Gene summary for NEFL |
| Gene information | Species | Human | Gene symbol | NEFL | Gene ID | 4747 |
| Gene name | neurofilament light chain | |
| Gene Alias | CMT1F | |
| Cytomap | 8p21.2 | |
| Gene Type | protein-coding | GO ID | GO:0000226 | UniProtAcc | P07196 |
Top |
Malignant transformation analysis |
| Identification of the aberrant gene expression in precancerous and cancerous lesions by comparing the gene expression of stem-like cells in diseased tissues with normal stem cells |
| Entrez ID | Symbol | Replicates | Species | Organ | Tissue | Adj P-value | Log2FC | Malignancy |
| 4747 | NEFL | LZE2T | Human | Esophagus | ESCC | 5.44e-10 | 9.23e-01 | 0.082 |
| 4747 | NEFL | LZE4T | Human | Esophagus | ESCC | 3.78e-08 | 8.93e-01 | 0.0811 |
| 4747 | NEFL | LZE7T | Human | Esophagus | ESCC | 4.33e-11 | 1.46e+00 | 0.0667 |
| 4747 | NEFL | P4T-E | Human | Esophagus | ESCC | 2.81e-62 | 2.66e+00 | 0.1323 |
| 4747 | NEFL | P5T-E | Human | Esophagus | ESCC | 2.17e-71 | 1.77e+00 | 0.1327 |
| 4747 | NEFL | P9T-E | Human | Esophagus | ESCC | 1.37e-15 | 4.78e-01 | 0.1131 |
| 4747 | NEFL | P11T-E | Human | Esophagus | ESCC | 1.23e-16 | 1.11e+00 | 0.1426 |
| 4747 | NEFL | P17T-E | Human | Esophagus | ESCC | 1.45e-12 | 8.58e-01 | 0.1278 |
| 4747 | NEFL | P19T-E | Human | Esophagus | ESCC | 7.97e-13 | 2.95e+00 | 0.1662 |
| 4747 | NEFL | P20T-E | Human | Esophagus | ESCC | 1.35e-11 | 3.51e-01 | 0.1124 |
| 4747 | NEFL | P21T-E | Human | Esophagus | ESCC | 4.53e-61 | 1.84e+00 | 0.1617 |
| 4747 | NEFL | P22T-E | Human | Esophagus | ESCC | 5.26e-21 | 6.46e-01 | 0.1236 |
| 4747 | NEFL | P24T-E | Human | Esophagus | ESCC | 2.27e-42 | 1.77e+00 | 0.1287 |
| 4747 | NEFL | P26T-E | Human | Esophagus | ESCC | 1.88e-06 | 2.04e-01 | 0.1276 |
| 4747 | NEFL | P30T-E | Human | Esophagus | ESCC | 5.30e-14 | 9.86e-01 | 0.137 |
| 4747 | NEFL | P32T-E | Human | Esophagus | ESCC | 2.13e-66 | 2.55e+00 | 0.1666 |
| 4747 | NEFL | P36T-E | Human | Esophagus | ESCC | 1.47e-14 | 1.29e+00 | 0.1187 |
| 4747 | NEFL | P37T-E | Human | Esophagus | ESCC | 6.39e-85 | 2.88e+00 | 0.1371 |
| 4747 | NEFL | P39T-E | Human | Esophagus | ESCC | 2.06e-04 | 2.21e-01 | 0.0894 |
| 4747 | NEFL | P44T-E | Human | Esophagus | ESCC | 4.27e-08 | 4.18e-01 | 0.1096 |
| Page: 1 2 3 |
| Tissue | Expression Dynamics | Abbreviation |
| Esophagus | 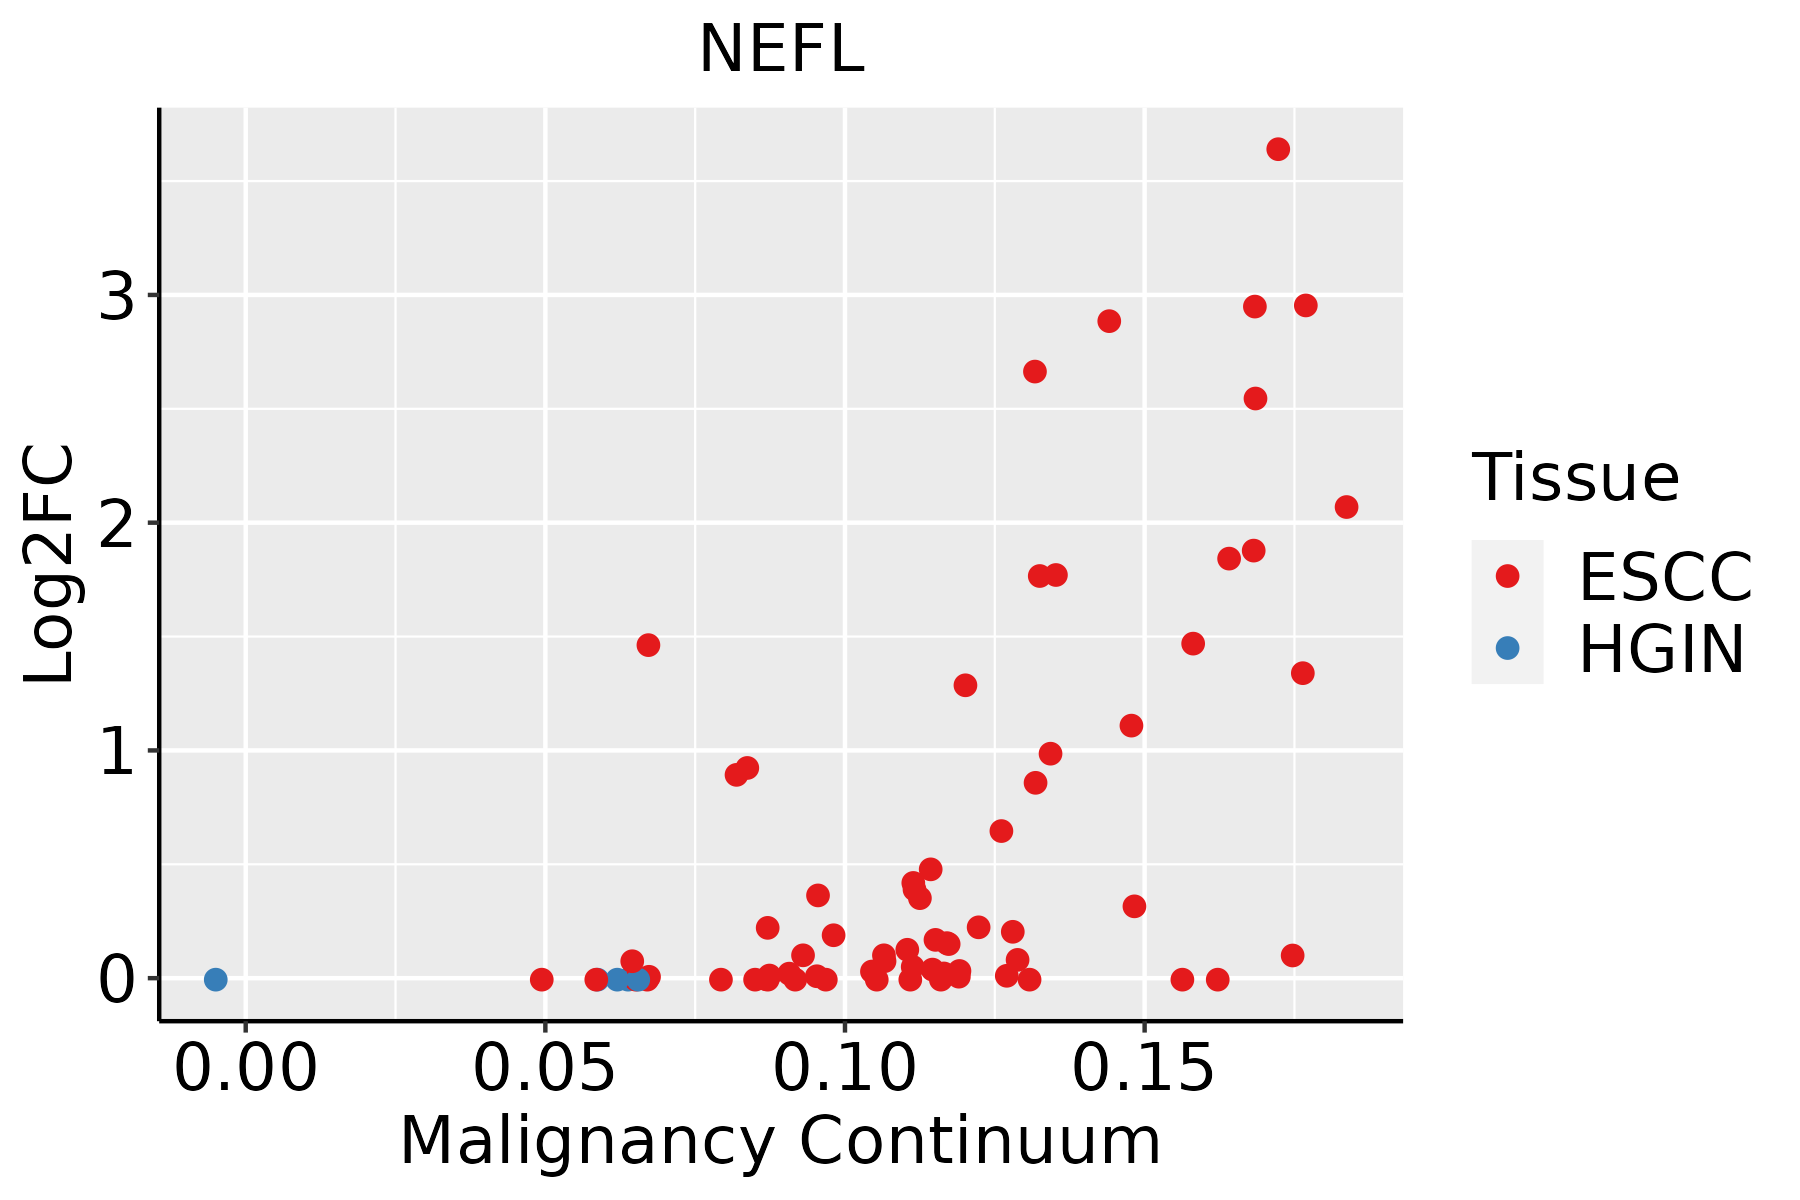 | ESCC: Esophageal squamous cell carcinoma |
| HGIN: High-grade intraepithelial neoplasias | ||
| LGIN: Low-grade intraepithelial neoplasias | ||
| Oral Cavity |  | EOLP: Erosive Oral lichen planus |
| LP: leukoplakia | ||
| NEOLP: Non-erosive oral lichen planus | ||
| OSCC: Oral squamous cell carcinoma |
| ∗log2FC in expression of this searched gene in stem-like cells from each diseased tissue sample relative to stem-like cells in normal samples in each tissue plotted against the malignancy continuum. Samples are colored based on if they are from different disease stage. |
Top |
Malignant transformation related pathway analysis |
| Find out the enriched GO biological processes and KEGG pathways involved in transition from healthy to precancer to cancer |
| Tissue | Disease Stage | Enriched GO biological Processes |
| Colorectum | AD |  |
| Colorectum | SER |  |
| Colorectum | MSS |  |
| Colorectum | MSI-H |  |
| Colorectum | FAP |  |
| ∗Top 15 enriched GO BP terms are showed in the bar plot of each disease state in each tissue. Each row represents a significant GO biological process which is colored according to the -log10(p.adjust). |
| Page: 1 2 3 4 5 6 7 8 9 |
| GO ID | Tissue | Disease Stage | Description | Gene Ratio | Bg Ratio | pvalue | p.adjust | Count |
| GO:005165617 | Esophagus | ESCC | establishment of organelle localization | 273/8552 | 390/18723 | 9.13e-23 | 1.81e-20 | 273 |
| GO:003070518 | Esophagus | ESCC | cytoskeleton-dependent intracellular transport | 133/8552 | 195/18723 | 1.48e-10 | 4.27e-09 | 133 |
| GO:001097013 | Esophagus | ESCC | transport along microtubule | 107/8552 | 155/18723 | 3.17e-09 | 6.80e-08 | 107 |
| GO:00723846 | Esophagus | ESCC | organelle transport along microtubule | 65/8552 | 85/18723 | 6.61e-09 | 1.35e-07 | 65 |
| GO:0051258111 | Esophagus | ESCC | protein polymerization | 183/8552 | 297/18723 | 1.94e-08 | 3.75e-07 | 183 |
| GO:000808810 | Esophagus | ESCC | axo-dendritic transport | 58/8552 | 75/18723 | 2.09e-08 | 4.02e-07 | 58 |
| GO:0070997111 | Esophagus | ESCC | neuron death | 216/8552 | 361/18723 | 3.49e-08 | 6.45e-07 | 216 |
| GO:0048545111 | Esophagus | ESCC | response to steroid hormone | 204/8552 | 339/18723 | 4.47e-08 | 8.11e-07 | 204 |
| GO:003253520 | Esophagus | ESCC | regulation of cellular component size | 227/8552 | 383/18723 | 4.77e-08 | 8.60e-07 | 227 |
| GO:004668514 | Esophagus | ESCC | response to arsenic-containing substance | 30/8552 | 33/18723 | 5.73e-08 | 1.02e-06 | 30 |
| GO:00989304 | Esophagus | ESCC | axonal transport | 49/8552 | 64/18723 | 4.54e-07 | 6.15e-06 | 49 |
| GO:0051402110 | Esophagus | ESCC | neuron apoptotic process | 148/8552 | 246/18723 | 3.08e-06 | 3.47e-05 | 148 |
| GO:1901214111 | Esophagus | ESCC | regulation of neuron death | 186/8552 | 319/18723 | 3.35e-06 | 3.73e-05 | 186 |
| GO:003109910 | Esophagus | ESCC | regeneration | 122/8552 | 198/18723 | 4.26e-06 | 4.57e-05 | 122 |
| GO:0043434111 | Esophagus | ESCC | response to peptide hormone | 234/8552 | 414/18723 | 4.93e-06 | 5.21e-05 | 234 |
| GO:003134616 | Esophagus | ESCC | positive regulation of cell projection organization | 201/8552 | 353/18723 | 1.19e-05 | 1.11e-04 | 201 |
| GO:1901654111 | Esophagus | ESCC | response to ketone | 118/8552 | 194/18723 | 1.45e-05 | 1.31e-04 | 118 |
| GO:001072010 | Esophagus | ESCC | positive regulation of cell development | 172/8552 | 298/18723 | 1.74e-05 | 1.55e-04 | 172 |
| GO:00991114 | Esophagus | ESCC | microtubule-based transport | 115/8552 | 190/18723 | 2.54e-05 | 2.15e-04 | 115 |
| GO:00080892 | Esophagus | ESCC | anterograde axonal transport | 37/8552 | 50/18723 | 4.42e-05 | 3.51e-04 | 37 |
| Page: 1 2 3 4 5 6 |
| Pathway ID | Tissue | Disease Stage | Description | Gene Ratio | Bg Ratio | pvalue | p.adjust | qvalue | Count |
| hsa05014210 | Esophagus | ESCC | Amyotrophic lateral sclerosis | 266/4205 | 364/8465 | 1.31e-20 | 2.20e-18 | 1.13e-18 | 266 |
| hsa05022210 | Esophagus | ESCC | Pathways of neurodegeneration - multiple diseases | 318/4205 | 476/8465 | 6.10e-15 | 2.04e-13 | 1.05e-13 | 318 |
| hsa0501438 | Esophagus | ESCC | Amyotrophic lateral sclerosis | 266/4205 | 364/8465 | 1.31e-20 | 2.20e-18 | 1.13e-18 | 266 |
| hsa0502238 | Esophagus | ESCC | Pathways of neurodegeneration - multiple diseases | 318/4205 | 476/8465 | 6.10e-15 | 2.04e-13 | 1.05e-13 | 318 |
| hsa0501428 | Oral cavity | OSCC | Amyotrophic lateral sclerosis | 246/3704 | 364/8465 | 6.65e-21 | 1.11e-18 | 5.67e-19 | 246 |
| hsa0502228 | Oral cavity | OSCC | Pathways of neurodegeneration - multiple diseases | 292/3704 | 476/8465 | 1.60e-15 | 4.47e-14 | 2.28e-14 | 292 |
| hsa05014112 | Oral cavity | OSCC | Amyotrophic lateral sclerosis | 246/3704 | 364/8465 | 6.65e-21 | 1.11e-18 | 5.67e-19 | 246 |
| hsa05022112 | Oral cavity | OSCC | Pathways of neurodegeneration - multiple diseases | 292/3704 | 476/8465 | 1.60e-15 | 4.47e-14 | 2.28e-14 | 292 |
| hsa0502229 | Oral cavity | LP | Pathways of neurodegeneration - multiple diseases | 232/2418 | 476/8465 | 7.77e-22 | 3.69e-20 | 2.38e-20 | 232 |
| hsa0502237 | Oral cavity | LP | Pathways of neurodegeneration - multiple diseases | 232/2418 | 476/8465 | 7.77e-22 | 3.69e-20 | 2.38e-20 | 232 |
| Page: 1 |
Top |
Cell-cell communication analysis |
| Identification of potential cell-cell interactions between two cell types and their ligand-receptor pairs for different disease states |
| Ligand | Receptor | LRpair | Pathway | Tissue | Disease Stage |
| Page: 1 |
Top |
Single-cell gene regulatory network inference analysis |
| Find out the significant the regulons (TFs) and the target genes of each regulon across cell types for different disease states |
| TF | Cell Type | Tissue | Disease Stage | Target Gene | RSS | Regulon Activity |
| ∗The dot plots of a searched regulon are shown for all cell subpopulations in each disease state of each tissue based on the regulon specific score inferred using pySCENIC and by calculating the average expression. |
| Page: 1 |
Top |
Somatic mutation of malignant transformation related genes |
| Annotation of somatic variants for genes involved in malignant transformation |
| Hugo Symbol | Variant Class | Variant Classification | dbSNP RS | HGVSc | HGVSp | HGVSp Short | SWISSPROT | BIOTYPE | SIFT | PolyPhen | Tumor Sample Barcode | Tissue | Histology | Sex | Age | Stage | Therapy Types | Drugs | Outcome |
| NEFL | SNV | Missense_Mutation | novel | c.1154N>T | p.Glu385Val | p.E385V | P07196 | protein_coding | deleterious(0) | probably_damaging(0.999) | TCGA-AN-A041-01 | Breast | breast invasive carcinoma | Female | <65 | I/II | Unknown | Unknown | SD |
| NEFL | SNV | Missense_Mutation | novel | c.239N>A | p.Ser80Asn | p.S80N | P07196 | protein_coding | tolerated(0.46) | benign(0.177) | TCGA-AN-A046-01 | Breast | breast invasive carcinoma | Female | >=65 | I/II | Unknown | Unknown | SD |
| NEFL | SNV | Missense_Mutation | novel | c.787G>A | p.Ala263Thr | p.A263T | P07196 | protein_coding | deleterious(0.02) | possibly_damaging(0.85) | TCGA-AN-A0AK-01 | Breast | breast invasive carcinoma | Female | >=65 | I/II | Unknown | Unknown | SD |
| NEFL | insertion | Nonsense_Mutation | novel | c.674_675insTTGAGGACCACAAAG | p.Lys225delinsAsnTerGlyProGlnArg | p.K225delinsN*GPQR | P07196 | protein_coding | TCGA-A8-A08H-01 | Breast | breast invasive carcinoma | Female | >=65 | I/II | Unknown | Unknown | SD | ||
| NEFL | SNV | Missense_Mutation | novel | c.1262G>A | p.Arg421Gln | p.R421Q | P07196 | protein_coding | tolerated(0.09) | possibly_damaging(0.905) | TCGA-EA-A410-01 | Cervix | cervical & endocervical cancer | Female | <65 | I/II | Unknown | Unknown | SD |
| NEFL | SNV | Missense_Mutation | novel | c.722N>T | p.Ala241Val | p.A241V | P07196 | protein_coding | deleterious(0.01) | benign(0.354) | TCGA-AA-3663-01 | Colorectum | colon adenocarcinoma | Male | <65 | I/II | Unknown | Unknown | SD |
| NEFL | SNV | Missense_Mutation | rs558065942 | c.1459N>A | p.Glu487Lys | p.E487K | P07196 | protein_coding | tolerated_low_confidence(0.3) | benign(0.05) | TCGA-AA-3713-01 | Colorectum | colon adenocarcinoma | Male | >=65 | III/IV | Chemotherapy | 5-fluorouracil | PR |
| NEFL | SNV | Missense_Mutation | novel | c.682N>A | p.Glu228Lys | p.E228K | P07196 | protein_coding | deleterious(0) | benign(0.284) | TCGA-AA-3977-01 | Colorectum | colon adenocarcinoma | Male | >=65 | I/II | Unknown | Unknown | SD |
| NEFL | SNV | Missense_Mutation | novel | c.1045N>A | p.Asp349Asn | p.D349N | P07196 | protein_coding | tolerated(0.08) | probably_damaging(0.988) | TCGA-AA-3984-01 | Colorectum | colon adenocarcinoma | Female | <65 | I/II | Unknown | Unknown | SD |
| NEFL | SNV | Missense_Mutation | novel | c.232N>A | p.Ala78Thr | p.A78T | P07196 | protein_coding | tolerated(0.06) | probably_damaging(0.913) | TCGA-AA-3989-01 | Colorectum | colon adenocarcinoma | Male | >=65 | III/IV | Unknown | Unknown | PD |
| Page: 1 2 3 4 5 6 7 8 9 |
Top |
Related drugs of malignant transformation related genes |
| Identification of chemicals and drugs interact with genes involved in malignant transfromation |
| (DGIdb 4.0) |
| Entrez ID | Symbol | Category | Interaction Types | Drug Claim Name | Drug Name | PMIDs |
| Page: 1 |

Copyright 2023-Present -The University of Texas Health Science Center at Houston |