
|
|||||
|
 | |
| |
| |
| |
| |
| |
|
Gene: NEFH |
Gene summary for NEFH |
| Gene information | Species | Human | Gene symbol | NEFH | Gene ID | 4744 |
| Gene name | neurofilament heavy chain | |
| Gene Alias | CMT2CC | |
| Cytomap | 22q12.2 | |
| Gene Type | protein-coding | GO ID | GO:0000226 | UniProtAcc | P12036 |
Top |
Malignant transformation analysis |
| Identification of the aberrant gene expression in precancerous and cancerous lesions by comparing the gene expression of stem-like cells in diseased tissues with normal stem cells |
| Entrez ID | Symbol | Replicates | Species | Organ | Tissue | Adj P-value | Log2FC | Malignancy |
| 4744 | NEFH | C43 | Human | Oral cavity | OSCC | 2.03e-17 | 2.97e-01 | 0.1704 |
| 4744 | NEFH | C86 | Human | Oral cavity | OSCC | 4.47e-05 | 6.76e-01 | 0.161 |
| 4744 | NEFH | LN22 | Human | Oral cavity | OSCC | 1.18e-14 | 1.09e+00 | 0.1733 |
| 4744 | NEFH | ATC13 | Human | Thyroid | ATC | 6.62e-35 | 7.70e-01 | 0.34 |
| 4744 | NEFH | ATC5 | Human | Thyroid | ATC | 1.18e-45 | 8.59e-01 | 0.34 |
| Page: 1 |
| Tissue | Expression Dynamics | Abbreviation |
| Oral Cavity | 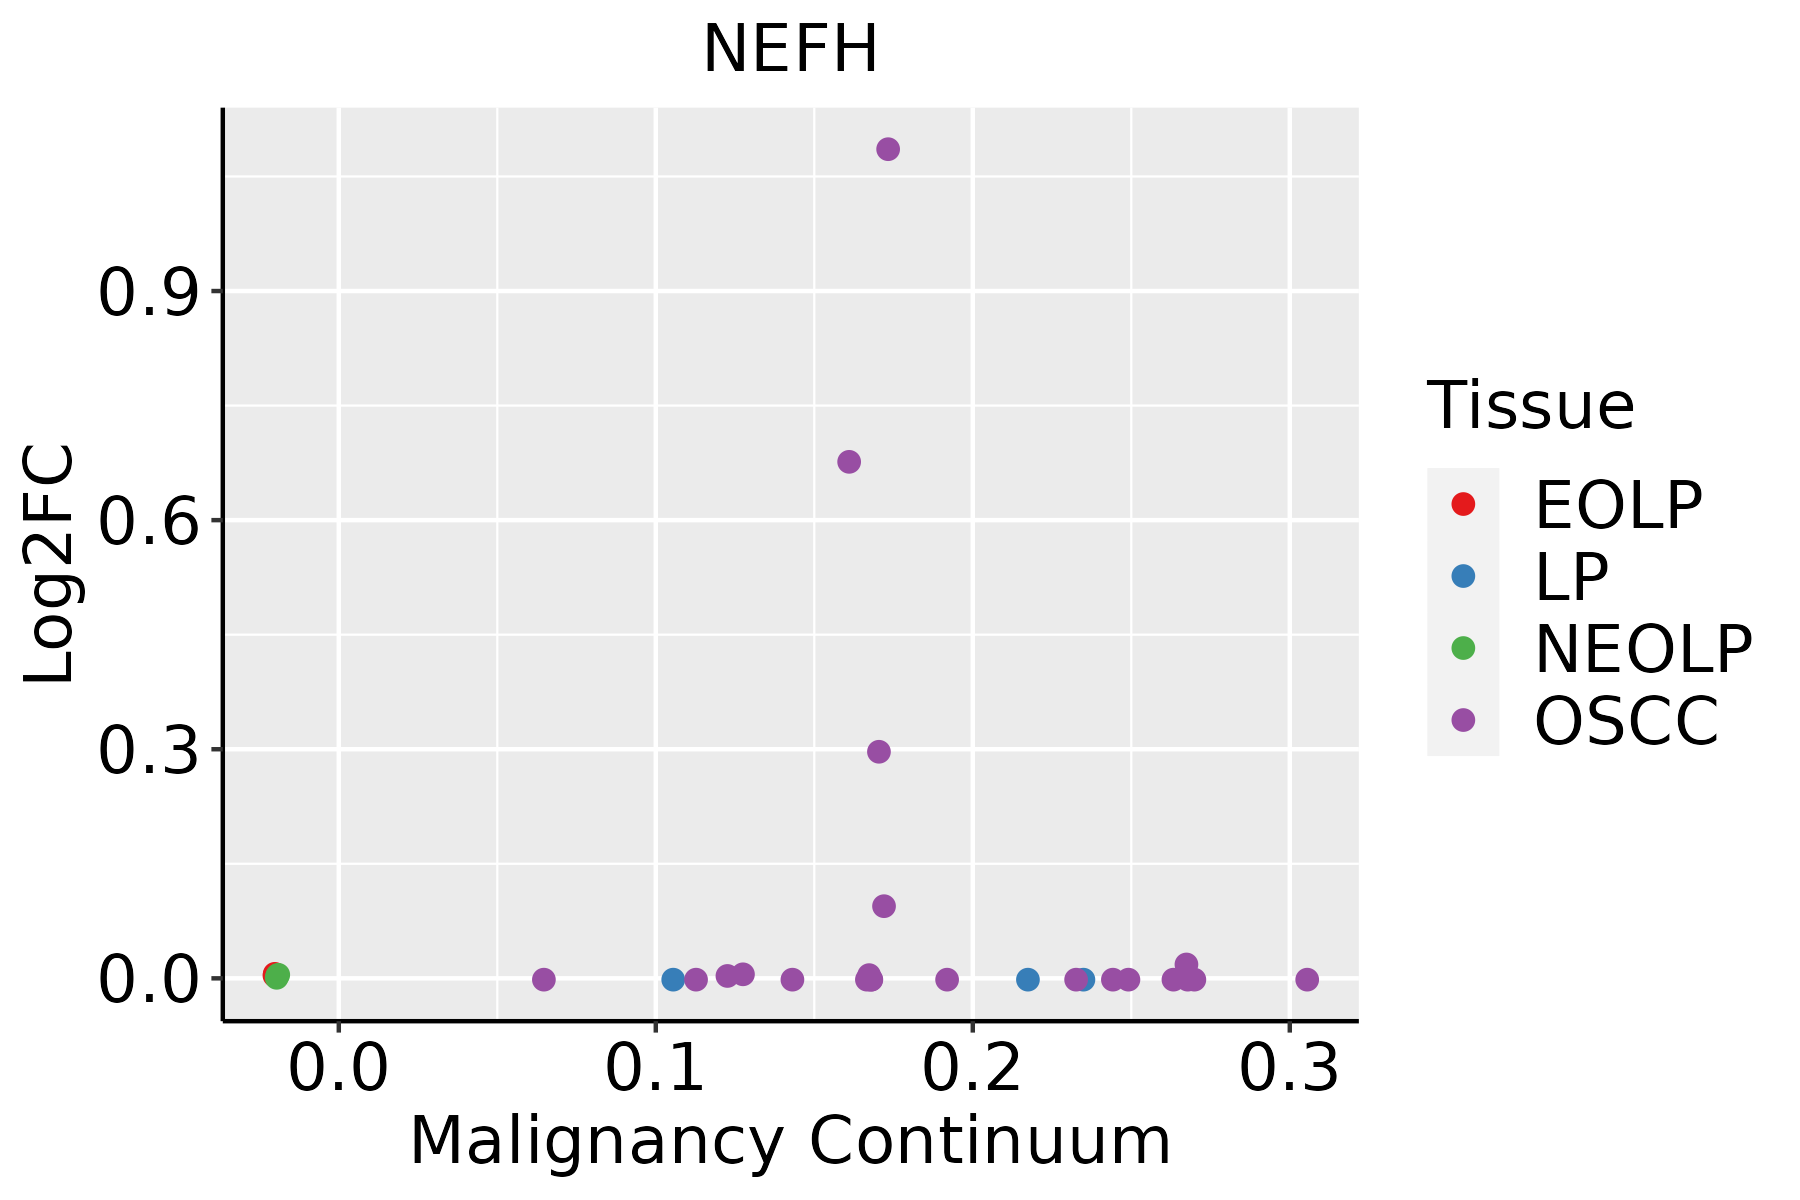 | EOLP: Erosive Oral lichen planus |
| LP: leukoplakia | ||
| NEOLP: Non-erosive oral lichen planus | ||
| OSCC: Oral squamous cell carcinoma | ||
| Thyroid | 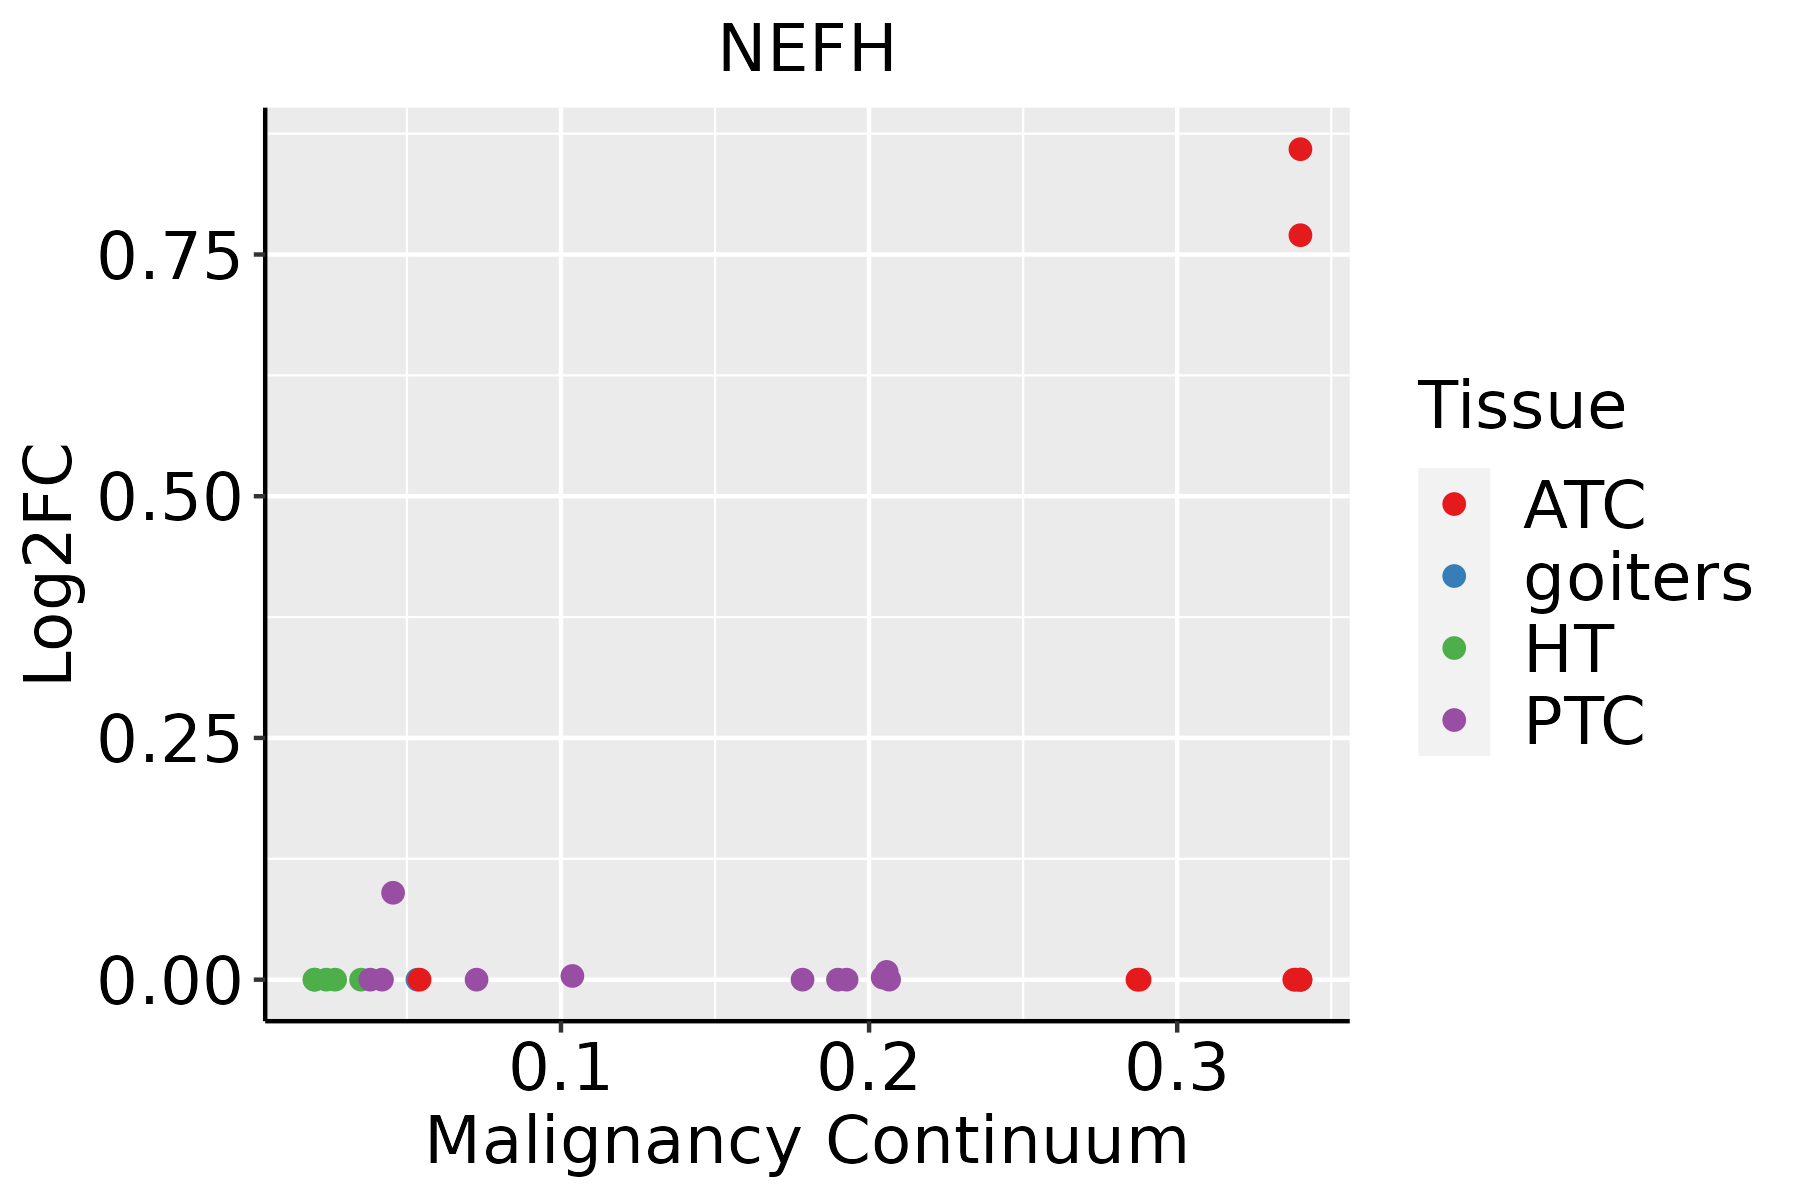 | ATC: Anaplastic thyroid cancer |
| HT: Hashimoto's thyroiditis | ||
| PTC: Papillary thyroid cancer |
| ∗log2FC in expression of this searched gene in stem-like cells from each diseased tissue sample relative to stem-like cells in normal samples in each tissue plotted against the malignancy continuum. Samples are colored based on if they are from different disease stage. |
Top |
Malignant transformation related pathway analysis |
| Find out the enriched GO biological processes and KEGG pathways involved in transition from healthy to precancer to cancer |
| Tissue | Disease Stage | Enriched GO biological Processes |
| Colorectum | AD |  |
| Colorectum | SER |  |
| Colorectum | MSS |  |
| Colorectum | MSI-H |  |
| Colorectum | FAP |  |
| ∗Top 15 enriched GO BP terms are showed in the bar plot of each disease state in each tissue. Each row represents a significant GO biological process which is colored according to the -log10(p.adjust). |
| Page: 1 2 3 4 5 6 7 8 9 |
| GO ID | Tissue | Disease Stage | Description | Gene Ratio | Bg Ratio | pvalue | p.adjust | Count |
| GO:003238615 | Oral cavity | OSCC | regulation of intracellular transport | 218/7305 | 337/18723 | 6.91e-22 | 1.41e-19 | 218 |
| GO:005165610 | Oral cavity | OSCC | establishment of organelle localization | 239/7305 | 390/18723 | 2.46e-19 | 3.31e-17 | 239 |
| GO:003070510 | Oral cavity | OSCC | cytoskeleton-dependent intracellular transport | 113/7305 | 195/18723 | 6.03e-08 | 1.09e-06 | 113 |
| GO:00109706 | Oral cavity | OSCC | transport along microtubule | 88/7305 | 155/18723 | 5.35e-06 | 6.02e-05 | 88 |
| GO:00723845 | Oral cavity | OSCC | organelle transport along microtubule | 53/7305 | 85/18723 | 1.10e-05 | 1.14e-04 | 53 |
| GO:19908237 | Oral cavity | OSCC | response to leukemia inhibitory factor | 58/7305 | 95/18723 | 1.10e-05 | 1.14e-04 | 58 |
| GO:19908307 | Oral cavity | OSCC | cellular response to leukemia inhibitory factor | 57/7305 | 94/18723 | 1.75e-05 | 1.71e-04 | 57 |
| GO:00991113 | Oral cavity | OSCC | microtubule-based transport | 96/7305 | 190/18723 | 7.92e-04 | 4.27e-03 | 96 |
| GO:00451044 | Oral cavity | OSCC | intermediate filament cytoskeleton organization | 31/7305 | 51/18723 | 1.34e-03 | 6.62e-03 | 31 |
| GO:00451034 | Oral cavity | OSCC | intermediate filament-based process | 31/7305 | 52/18723 | 2.08e-03 | 9.59e-03 | 31 |
| GO:00328863 | Oral cavity | OSCC | regulation of microtubule-based process | 115/7305 | 240/18723 | 2.95e-03 | 1.28e-02 | 115 |
| GO:006156410 | Oral cavity | OSCC | axon development | 207/7305 | 467/18723 | 1.01e-02 | 3.51e-02 | 207 |
| GO:00991884 | Oral cavity | OSCC | postsynaptic cytoskeleton organization | 10/7305 | 14/18723 | 1.44e-02 | 4.69e-02 | 10 |
| GO:003238632 | Thyroid | ATC | regulation of intracellular transport | 203/6293 | 337/18723 | 6.16e-24 | 1.85e-21 | 203 |
| GO:005165625 | Thyroid | ATC | establishment of organelle localization | 206/6293 | 390/18723 | 2.62e-15 | 1.84e-13 | 206 |
| GO:006156423 | Thyroid | ATC | axon development | 220/6293 | 467/18723 | 6.85e-10 | 1.80e-08 | 220 |
| GO:003070532 | Thyroid | ATC | cytoskeleton-dependent intracellular transport | 105/6293 | 195/18723 | 4.31e-09 | 9.70e-08 | 105 |
| GO:000740919 | Thyroid | ATC | axonogenesis | 197/6293 | 418/18723 | 5.09e-09 | 1.13e-07 | 197 |
| GO:001097022 | Thyroid | ATC | transport along microtubule | 83/6293 | 155/18723 | 2.38e-07 | 3.70e-06 | 83 |
| GO:003288613 | Thyroid | ATC | regulation of microtubule-based process | 114/6293 | 240/18723 | 5.17e-06 | 5.59e-05 | 114 |
| Page: 1 2 |
| Pathway ID | Tissue | Disease Stage | Description | Gene Ratio | Bg Ratio | pvalue | p.adjust | qvalue | Count |
| hsa0501428 | Oral cavity | OSCC | Amyotrophic lateral sclerosis | 246/3704 | 364/8465 | 6.65e-21 | 1.11e-18 | 5.67e-19 | 246 |
| hsa0502228 | Oral cavity | OSCC | Pathways of neurodegeneration - multiple diseases | 292/3704 | 476/8465 | 1.60e-15 | 4.47e-14 | 2.28e-14 | 292 |
| hsa05014112 | Oral cavity | OSCC | Amyotrophic lateral sclerosis | 246/3704 | 364/8465 | 6.65e-21 | 1.11e-18 | 5.67e-19 | 246 |
| hsa05022112 | Oral cavity | OSCC | Pathways of neurodegeneration - multiple diseases | 292/3704 | 476/8465 | 1.60e-15 | 4.47e-14 | 2.28e-14 | 292 |
| Page: 1 |
Top |
Cell-cell communication analysis |
| Identification of potential cell-cell interactions between two cell types and their ligand-receptor pairs for different disease states |
| Ligand | Receptor | LRpair | Pathway | Tissue | Disease Stage |
| Page: 1 |
Top |
Single-cell gene regulatory network inference analysis |
| Find out the significant the regulons (TFs) and the target genes of each regulon across cell types for different disease states |
| TF | Cell Type | Tissue | Disease Stage | Target Gene | RSS | Regulon Activity |
| ∗The dot plots of a searched regulon are shown for all cell subpopulations in each disease state of each tissue based on the regulon specific score inferred using pySCENIC and by calculating the average expression. |
| Page: 1 |
Top |
Somatic mutation of malignant transformation related genes |
| Annotation of somatic variants for genes involved in malignant transformation |
| Hugo Symbol | Variant Class | Variant Classification | dbSNP RS | HGVSc | HGVSp | HGVSp Short | SWISSPROT | BIOTYPE | SIFT | PolyPhen | Tumor Sample Barcode | Tissue | Histology | Sex | Age | Stage | Therapy Types | Drugs | Outcome |
| NEFH | SNV | Missense_Mutation | c.2434A>G | p.Lys812Glu | p.K812E | P12036 | protein_coding | deleterious_low_confidence(0.03) | benign(0.146) | TCGA-A8-A094-01 | Breast | breast invasive carcinoma | Female | >=65 | I/II | Unknown | Unknown | SD | |
| NEFH | SNV | Missense_Mutation | rs548556825 | c.1682C>T | p.Pro561Leu | p.P561L | P12036 | protein_coding | deleterious(0.02) | benign(0.142) | TCGA-AN-A046-01 | Breast | breast invasive carcinoma | Female | >=65 | I/II | Unknown | Unknown | SD |
| NEFH | SNV | Missense_Mutation | novel | c.1657N>T | p.Pro553Ser | p.P553S | P12036 | protein_coding | deleterious(0.01) | probably_damaging(0.999) | TCGA-BH-A0B6-01 | Breast | breast invasive carcinoma | Female | <65 | I/II | Unknown | Unknown | SD |
| NEFH | SNV | Missense_Mutation | novel | c.1486G>T | p.Gly496Trp | p.G496W | P12036 | protein_coding | deleterious(0.01) | benign(0.394) | TCGA-GI-A2C9-01 | Breast | breast invasive carcinoma | Female | <65 | I/II | Unspecific | SD | |
| NEFH | insertion | Nonsense_Mutation | novel | c.1389_1390insACCTCTTAA | p.Thr464_Gln465insSerTerThr | p.T464_Q465insS*T | P12036 | protein_coding | TCGA-A7-A0CE-01 | Breast | breast invasive carcinoma | Female | <65 | I/II | Chemotherapy | adriamycin | SD | ||
| NEFH | insertion | In_Frame_Ins | novel | c.1681_1682insTTGGGT | p.Pro561delinsLeuGlySer | p.P561delinsLGS | P12036 | protein_coding | TCGA-AR-A0TU-01 | Breast | breast invasive carcinoma | Female | <65 | I/II | Unspecific | Doxorubicin | SD | ||
| NEFH | SNV | Missense_Mutation | rs758082890 | c.2896G>A | p.Glu966Lys | p.E966K | P12036 | protein_coding | tolerated_low_confidence(0.12) | benign(0.079) | TCGA-C5-A1BK-01 | Cervix | cervical & endocervical cancer | Female | <65 | I/II | Unknown | Unknown | SD |
| NEFH | SNV | Missense_Mutation | c.2692N>A | p.Glu898Lys | p.E898K | P12036 | protein_coding | tolerated_low_confidence(0.27) | benign(0.003) | TCGA-DS-A0VM-01 | Cervix | cervical & endocervical cancer | Female | <65 | I/II | Chemotherapy | cisplatin | PD | |
| NEFH | SNV | Missense_Mutation | c.991N>A | p.Glu331Lys | p.E331K | P12036 | protein_coding | deleterious(0) | probably_damaging(0.959) | TCGA-EK-A3GK-01 | Cervix | cervical & endocervical cancer | Female | <65 | I/II | Unknown | Unknown | SD | |
| NEFH | SNV | Missense_Mutation | c.991N>C | p.Glu331Gln | p.E331Q | P12036 | protein_coding | deleterious(0.01) | possibly_damaging(0.87) | TCGA-JW-A5VL-01 | Cervix | cervical & endocervical cancer | Female | <65 | I/II | Unknown | Unknown | SD |
| Page: 1 2 3 4 5 6 7 8 |
Top |
Related drugs of malignant transformation related genes |
| Identification of chemicals and drugs interact with genes involved in malignant transfromation |
| (DGIdb 4.0) |
| Entrez ID | Symbol | Category | Interaction Types | Drug Claim Name | Drug Name | PMIDs |
| Page: 1 |

Copyright 2023-Present -The University of Texas Health Science Center at Houston |