Schematic overview of the cellular and molecular mechanisms involved in the cancer progression, including the proposed cellular and molecular mechanisms in cancer cells trajectory. AT1: alveolar type 1 cells; AT2: alveolar type 2 cells; AAH: atypical adenomatous hyperplasia; AIS: adenocarcinoma in situ; MIA: minimally invasive adenocarcinoma; IA: invasive adenocarcinoma; EMT: epithelial-mesenchymal transition

Home

Download

Statistics

Help

Contact

Center for Computational Systems Medicine
leaf

Gene summary

leaf

Malignant transformation analysis

leaf

Malignant transformation related pathway analysis

leaf

Cell-cell communication analysis

leaf

Single-cell gene regulatory network inference analysis

leaf

Somatic mutation of malignant transformation related genes

leaf

Related drugs of malignant transformation related genes

Gene: NEDD9

Gene summary for NEDD9

check button Gene summary.

Gene informationSpeciesHuman
Gene symbol

NEDD9

Gene ID

4739

Gene nameneural precursor cell expressed, developmentally down-regulated 9
Gene AliasCAS-L
Cytomap6p24.2
Gene Typeprotein-coding
GO ID

GO:0000902

UniProtAcc

A0A024QZV9


Top

Malignant transformation analysis

check button Identification of the aberrant gene expression in precancerous and cancerous lesions by comparing the gene expression of stem-like cells in diseased tissues with normal stem cells
check button Malignant transformation involving gene list.
Entrez IDSymbolReplicatesSpeciesOrganTissueAdj P-valueLog2FCMalignancy
4739NEDD9AEH-subject1HumanEndometriumAEH2.15e-134.33e-01-0.3059
4739NEDD9AEH-subject2HumanEndometriumAEH1.67e-033.03e-01-0.2525
4739NEDD9AEH-subject3HumanEndometriumAEH1.08e-073.79e-01-0.2576
4739NEDD9AEH-subject4HumanEndometriumAEH4.46e-125.59e-01-0.2657
4739NEDD9AEH-subject5HumanEndometriumAEH7.40e-338.64e-01-0.2953
4739NEDD9EEC-subject1HumanEndometriumEEC3.84e-104.91e-01-0.2682
4739NEDD9EEC-subject2HumanEndometriumEEC1.35e-022.77e-01-0.2607
4739NEDD9EEC-subject3HumanEndometriumEEC5.54e-042.46e-01-0.2525
4739NEDD9EEC-subject4HumanEndometriumEEC9.96e-144.85e-01-0.2571
4739NEDD9EEC-subject5HumanEndometriumEEC7.17e-124.51e-01-0.249
4739NEDD9GSM6177620_NYU_UCEC1_lib1_lib1HumanEndometriumEEC4.31e-02-4.17e-03-0.1869
4739NEDD9GSM6177620_NYU_UCEC1_lib2_lib2HumanEndometriumEEC1.33e-031.05e-02-0.1875
4739NEDD9GSM6177620_NYU_UCEC1_lib3_lib3HumanEndometriumEEC5.00e-041.69e-02-0.1883
4739NEDD9GSM6177621_NYU_UCEC2_lib1_lib1HumanEndometriumEEC2.99e-034.34e-02-0.1934
4739NEDD9GSM6177622_NYU_UCEC3_lib1_lib1HumanEndometriumEEC1.83e-102.83e-01-0.1917
4739NEDD9GSM6177622_NYU_UCEC3_lib2_lib2HumanEndometriumEEC2.26e-081.91e-01-0.1916
4739NEDD9GSM6177623_NYU_UCEC3_VisHumanEndometriumEEC4.38e-053.16e-01-0.1269
4739NEDD9LZE4THumanEsophagusESCC1.11e-139.13e-010.0811
4739NEDD9LZE7THumanEsophagusESCC9.41e-111.56e+000.0667
4739NEDD9LZE24THumanEsophagusESCC8.45e-111.13e+000.0596
Page: 1 2 3 4 5 6 7 8 

check button Transcriptomic changes along malignancy continuum.
TissueExpression DynamicsAbbreviation
EndometriumThe image shows the transcriptomic changes along malignancy continuum.log2FC in expression of this searched gene in stem-like cells from each diseased tissue sample relative to stem-like cells in normal samples in each tissue plotted against the malignancy continuum. Samples are colored based on if they are from different disease stage.AEH: Atypical endometrial hyperplasia
EEC: Endometrioid Cancer
EsophagusThe image shows the transcriptomic changes along malignancy continuum.log2FC in expression of this searched gene in stem-like cells from each diseased tissue sample relative to stem-like cells in normal samples in each tissue plotted against the malignancy continuum. Samples are colored based on if they are from different disease stage.
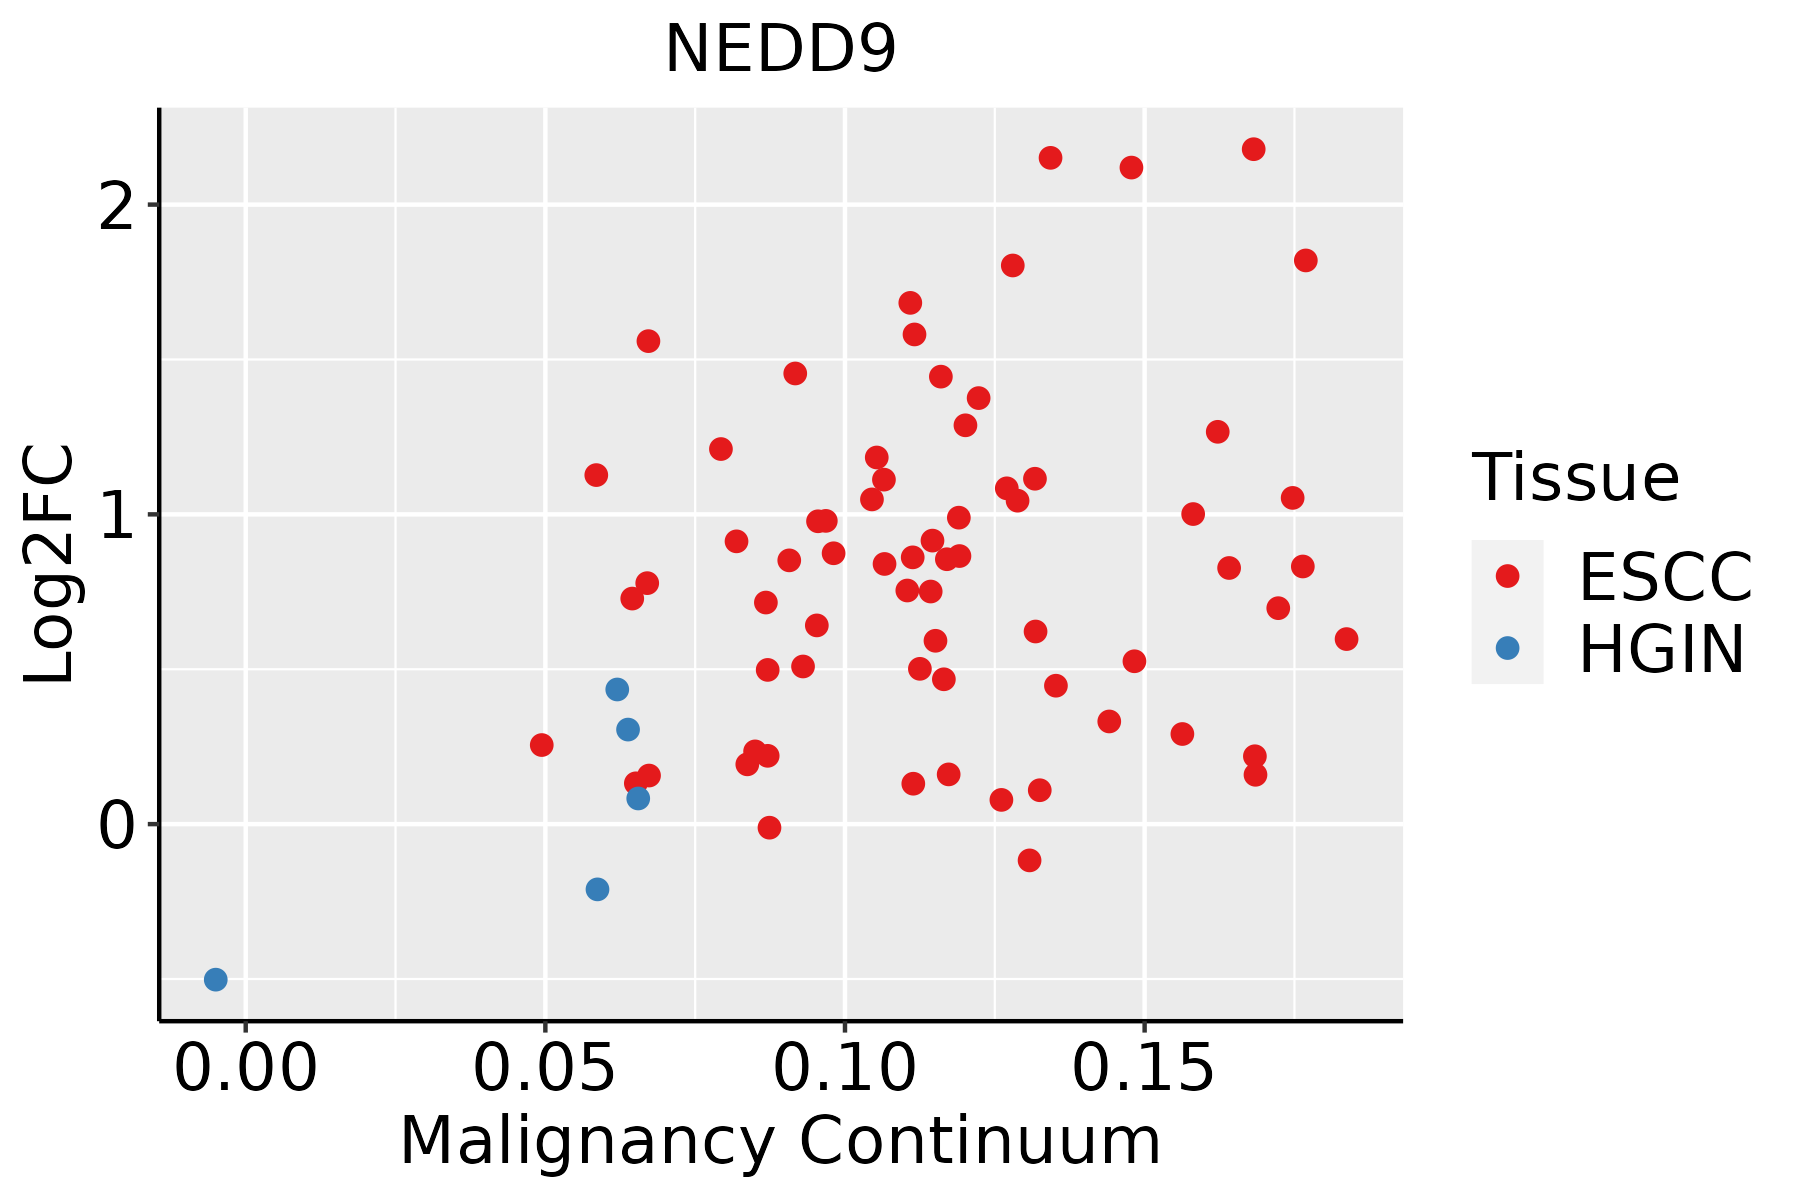
ESCC: Esophageal squamous cell carcinoma
HGIN: High-grade intraepithelial neoplasias
LGIN: Low-grade intraepithelial neoplasias
LiverThe image shows the transcriptomic changes along malignancy continuum.log2FC in expression of this searched gene in stem-like cells from each diseased tissue sample relative to stem-like cells in normal samples in each tissue plotted against the malignancy continuum. Samples are colored based on if they are from different disease stage.
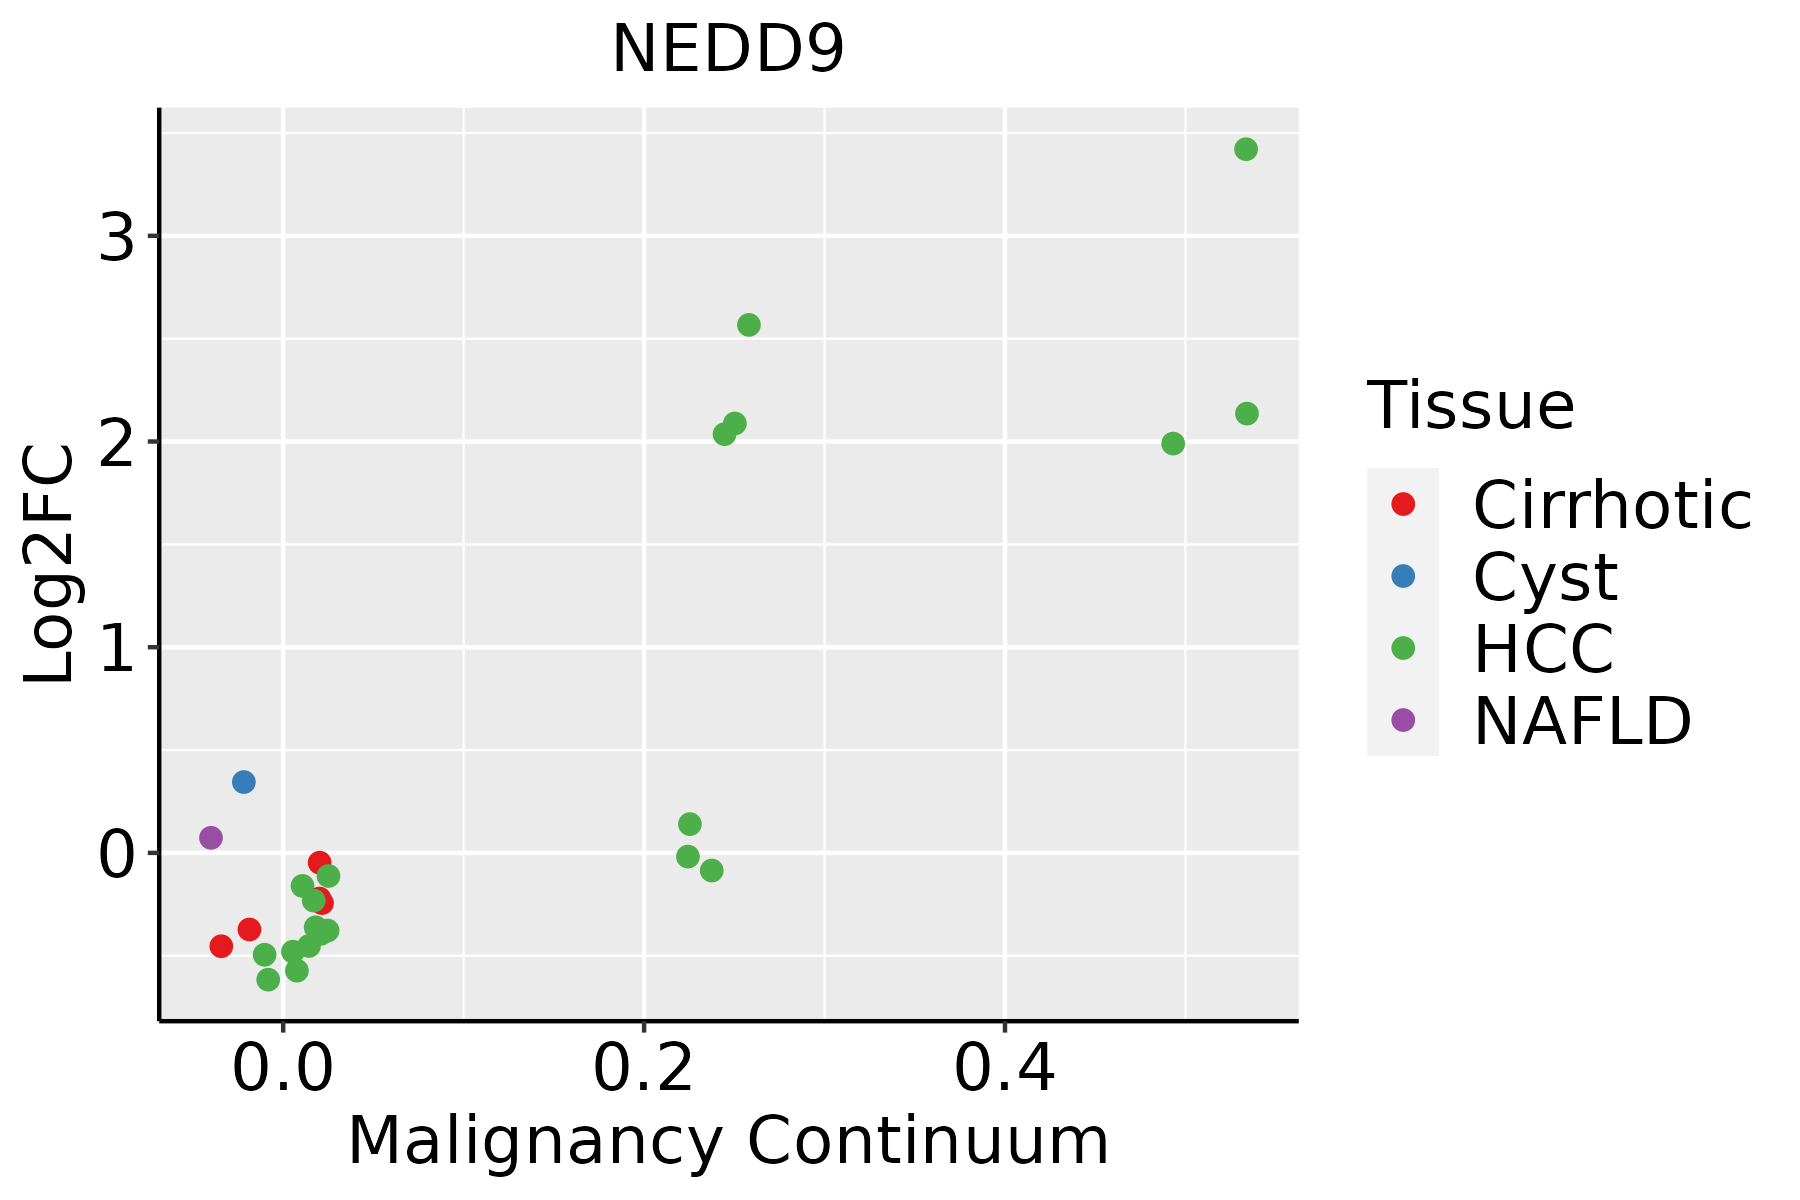
HCC: Hepatocellular carcinoma
NAFLD: Non-alcoholic fatty liver disease
LungThe image shows the transcriptomic changes along malignancy continuum.log2FC in expression of this searched gene in stem-like cells from each diseased tissue sample relative to stem-like cells in normal samples in each tissue plotted against the malignancy continuum. Samples are colored based on if they are from different disease stage.
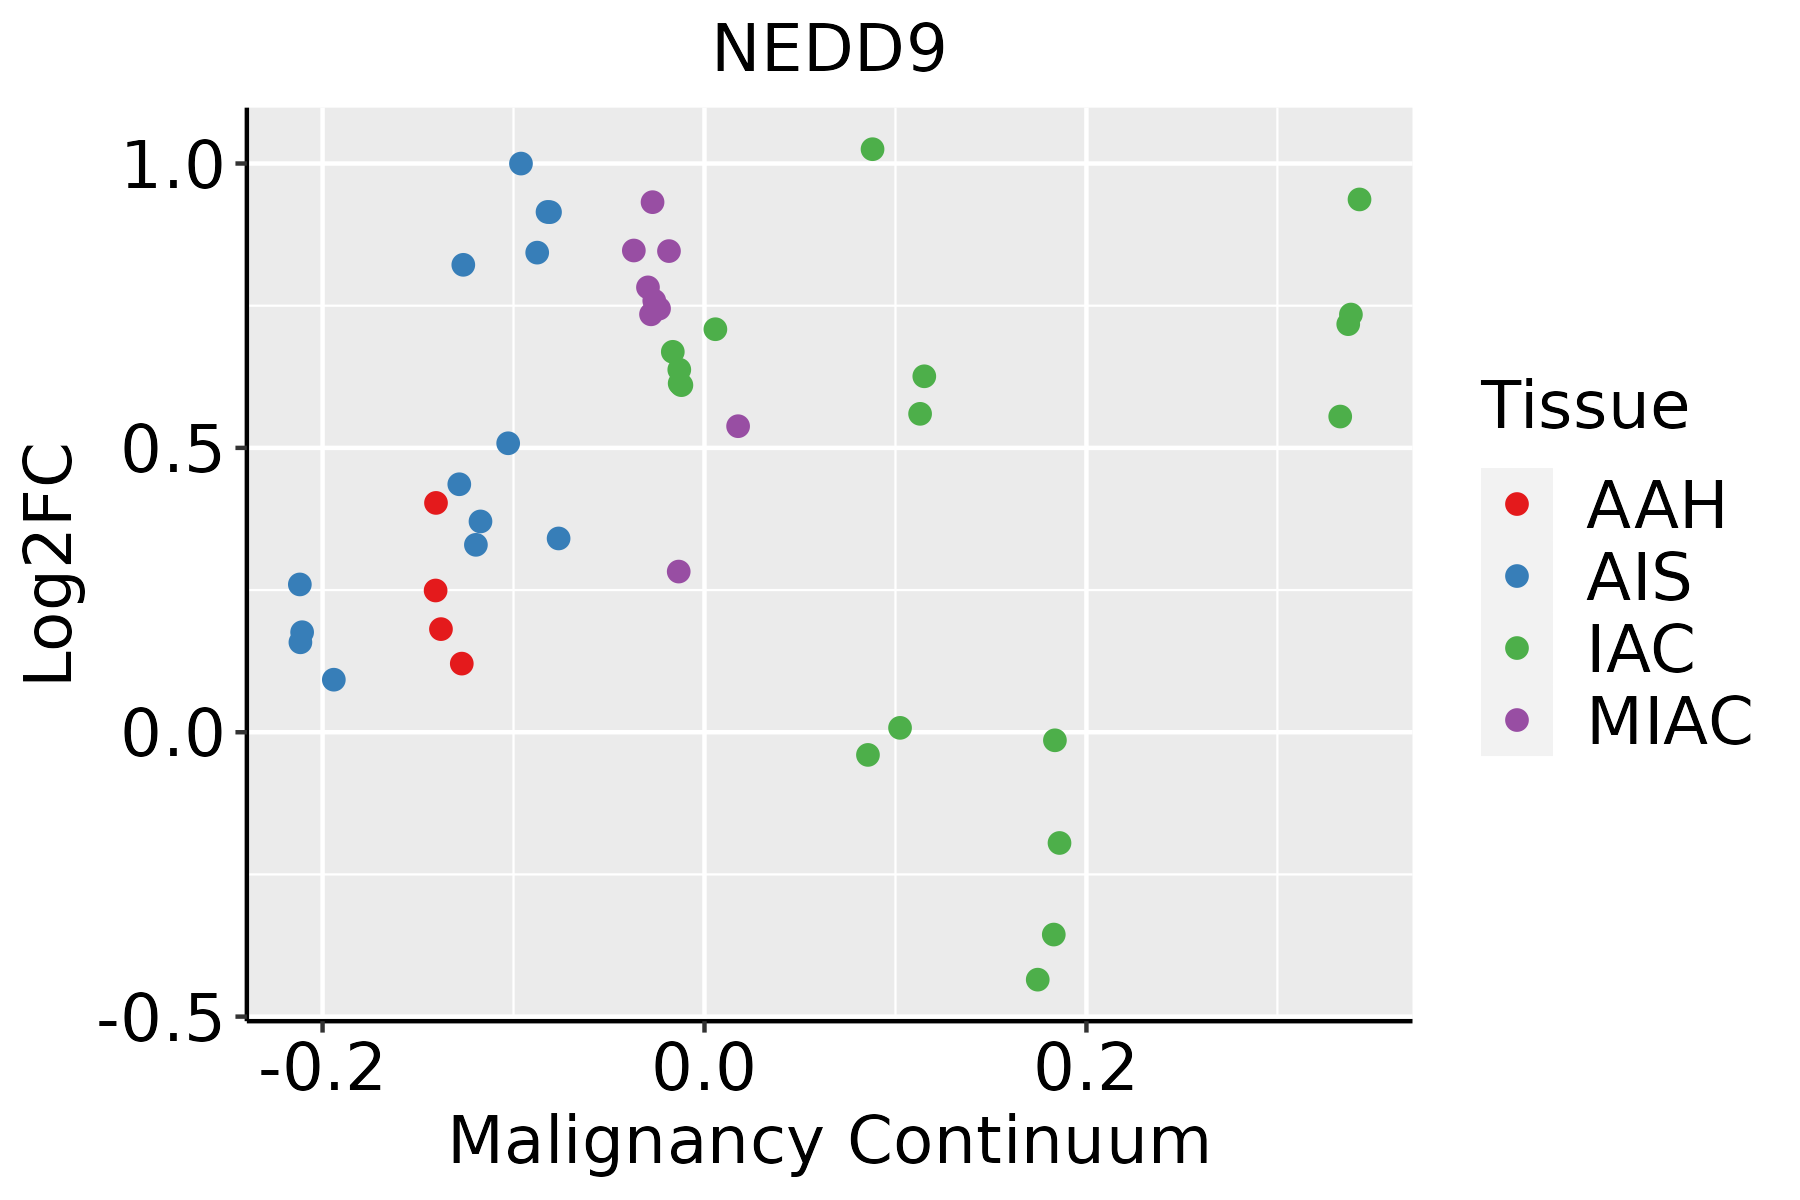
AAH: Atypical adenomatous hyperplasia
AIS: Adenocarcinoma in situ
IAC: Invasive lung adenocarcinoma
MIA: Minimally invasive adenocarcinoma
Oral CavityThe image shows the transcriptomic changes along malignancy continuum.log2FC in expression of this searched gene in stem-like cells from each diseased tissue sample relative to stem-like cells in normal samples in each tissue plotted against the malignancy continuum. Samples are colored based on if they are from different disease stage.
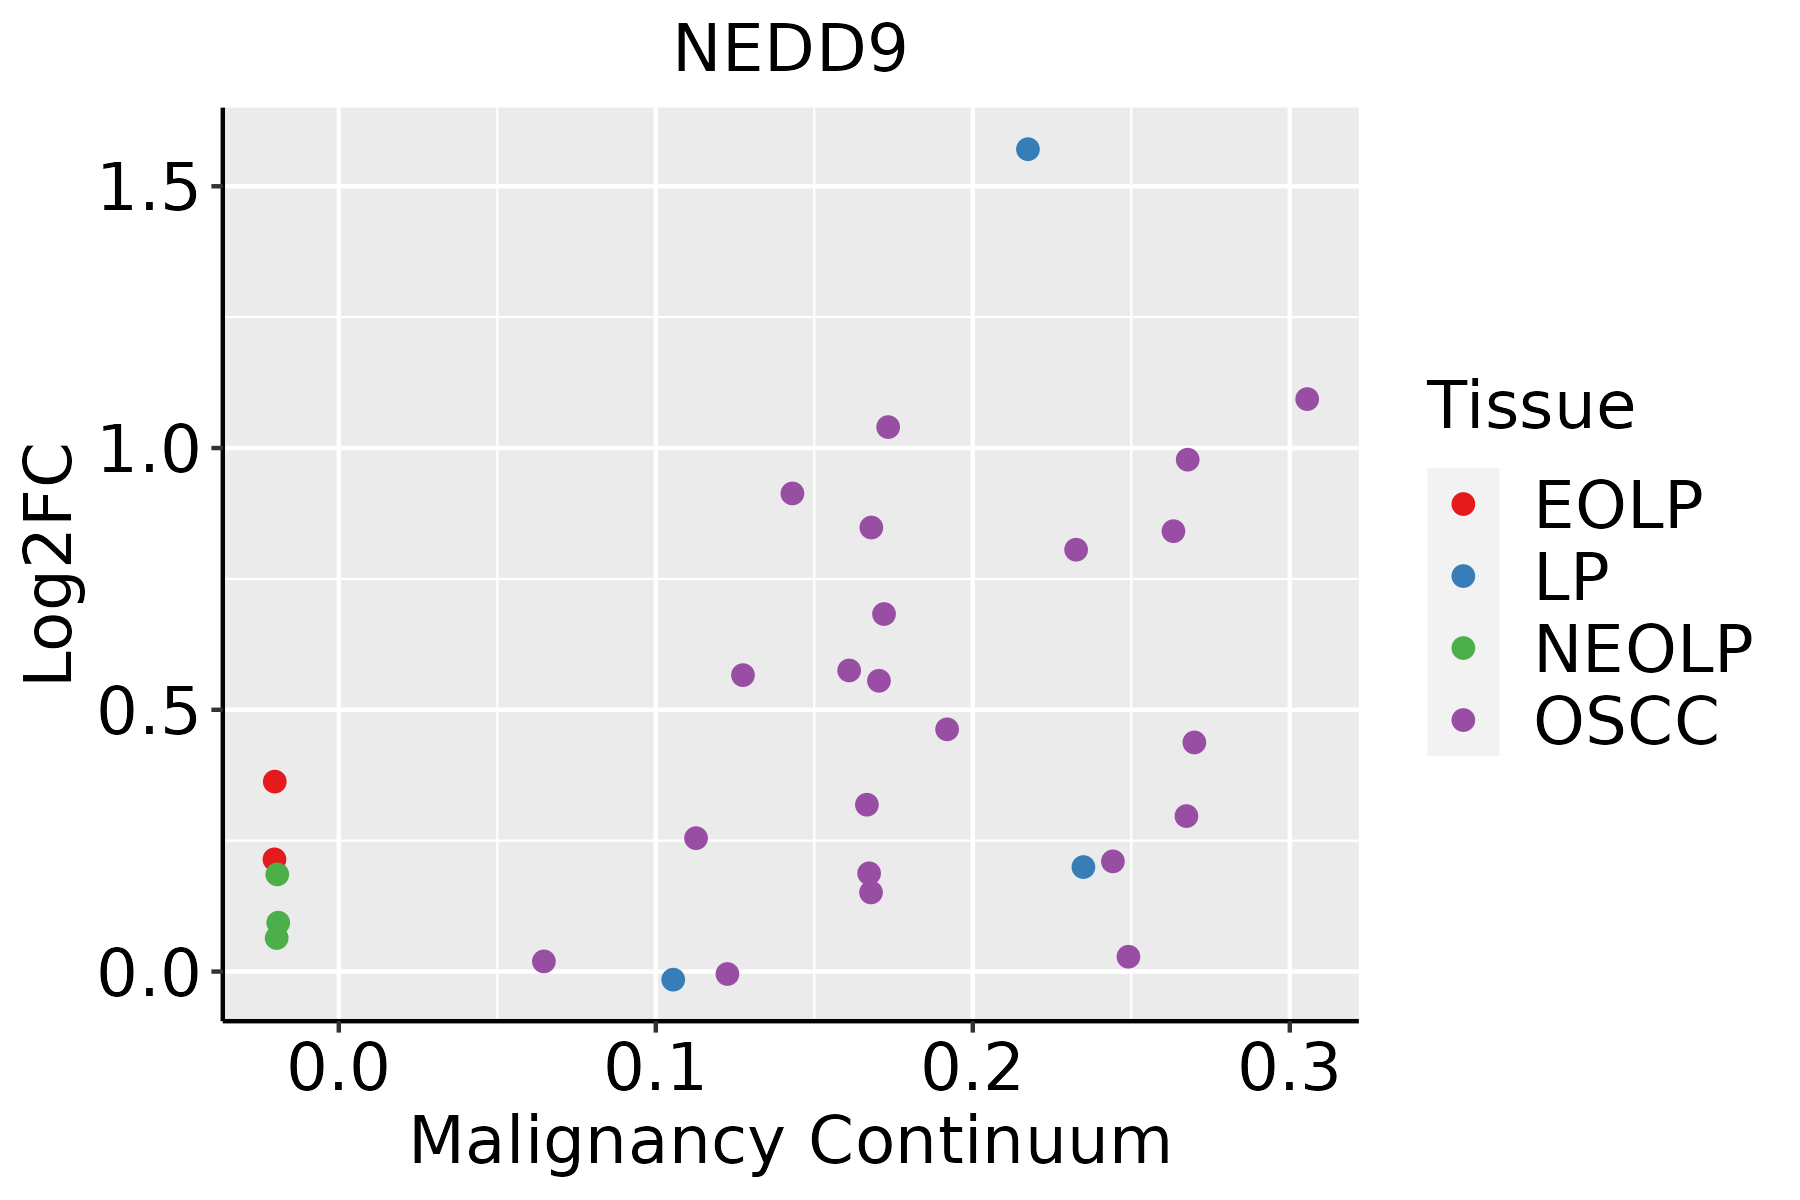
EOLP: Erosive Oral lichen planus
LP: leukoplakia
NEOLP: Non-erosive oral lichen planus
OSCC: Oral squamous cell carcinoma
ProstateThe image shows the transcriptomic changes along malignancy continuum.log2FC in expression of this searched gene in stem-like cells from each diseased tissue sample relative to stem-like cells in normal samples in each tissue plotted against the malignancy continuum. Samples are colored based on if they are from different disease stage.
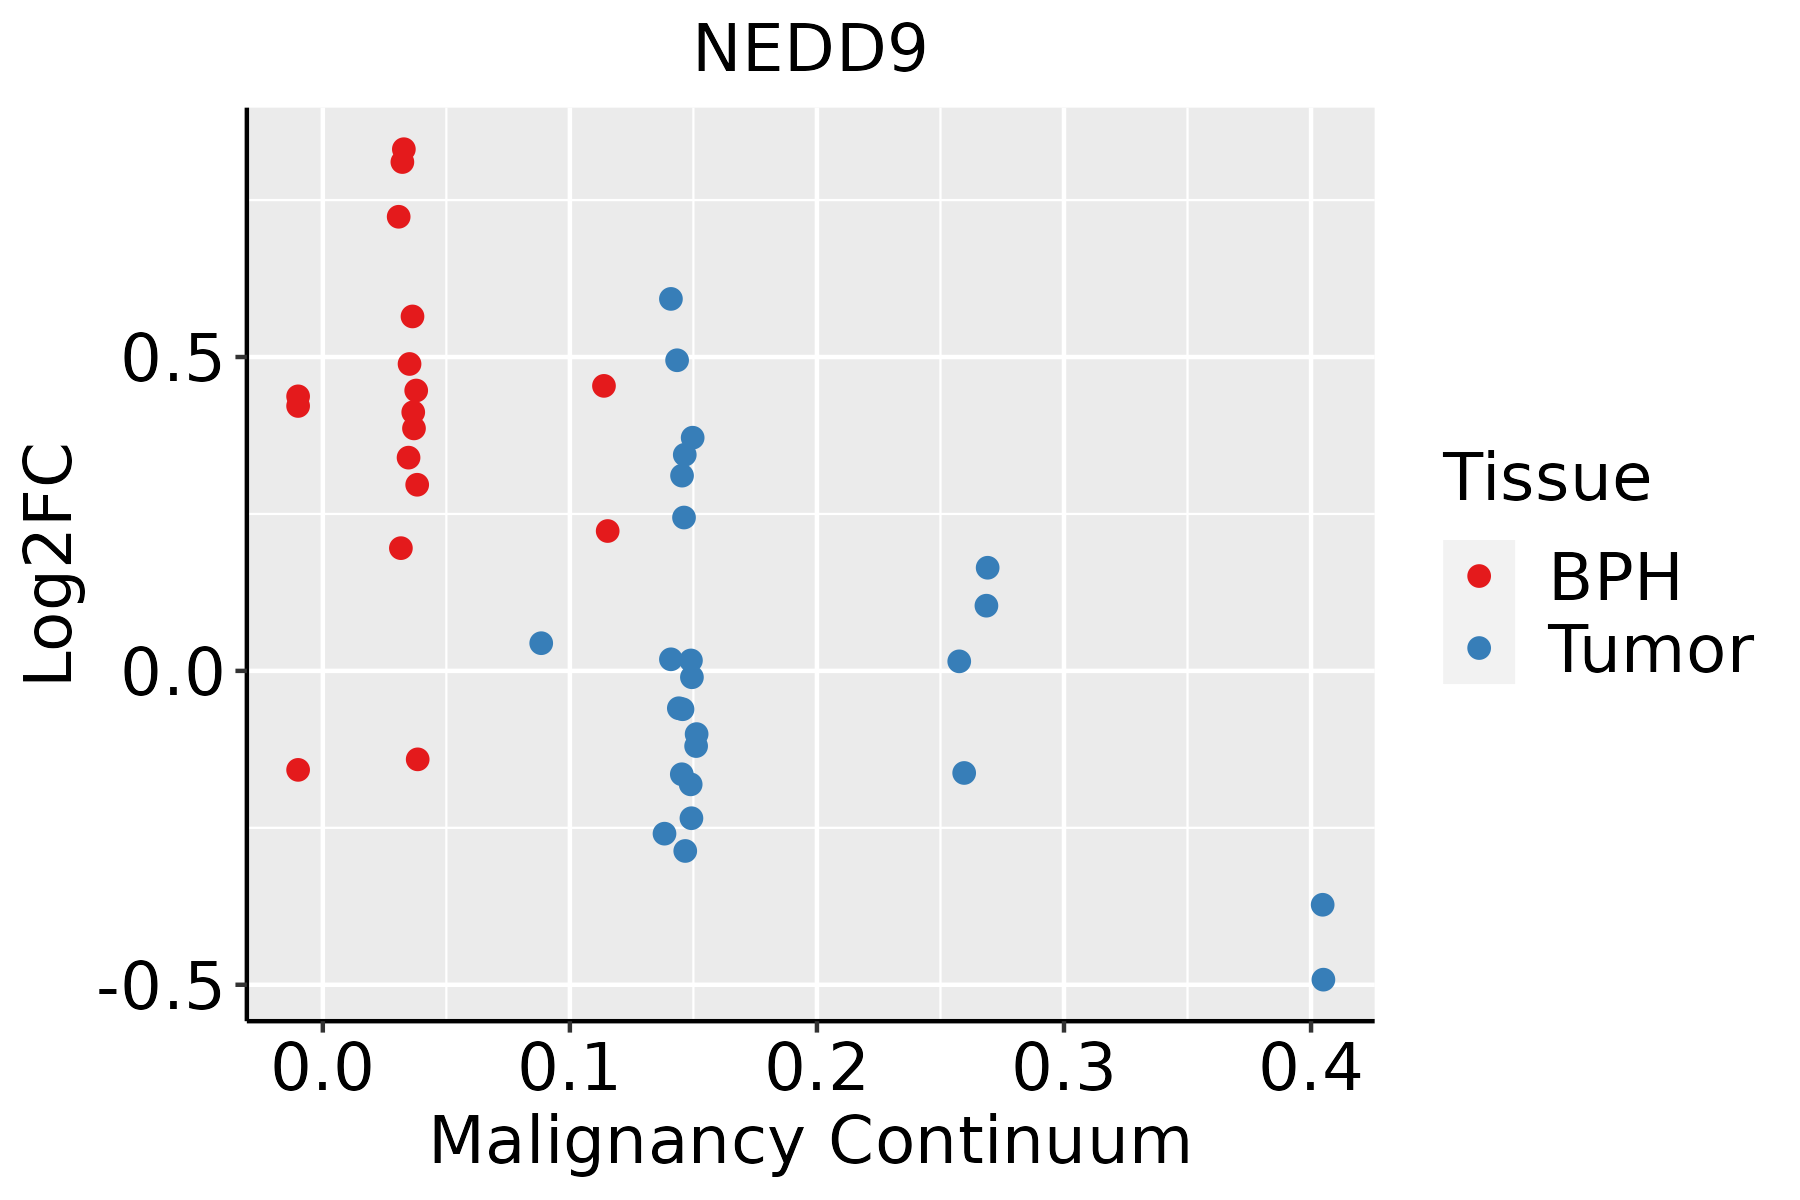
BPH: Benign Prostatic Hyperplasia
SkinThe image shows the transcriptomic changes along malignancy continuum.log2FC in expression of this searched gene in stem-like cells from each diseased tissue sample relative to stem-like cells in normal samples in each tissue plotted against the malignancy continuum. Samples are colored based on if they are from different disease stage.AK: Actinic keratosis
cSCC: Cutaneous squamous cell carcinoma
SCCIS:squamous cell carcinoma in situ
ThyroidThe image shows the transcriptomic changes along malignancy continuum.log2FC in expression of this searched gene in stem-like cells from each diseased tissue sample relative to stem-like cells in normal samples in each tissue plotted against the malignancy continuum. Samples are colored based on if they are from different disease stage.
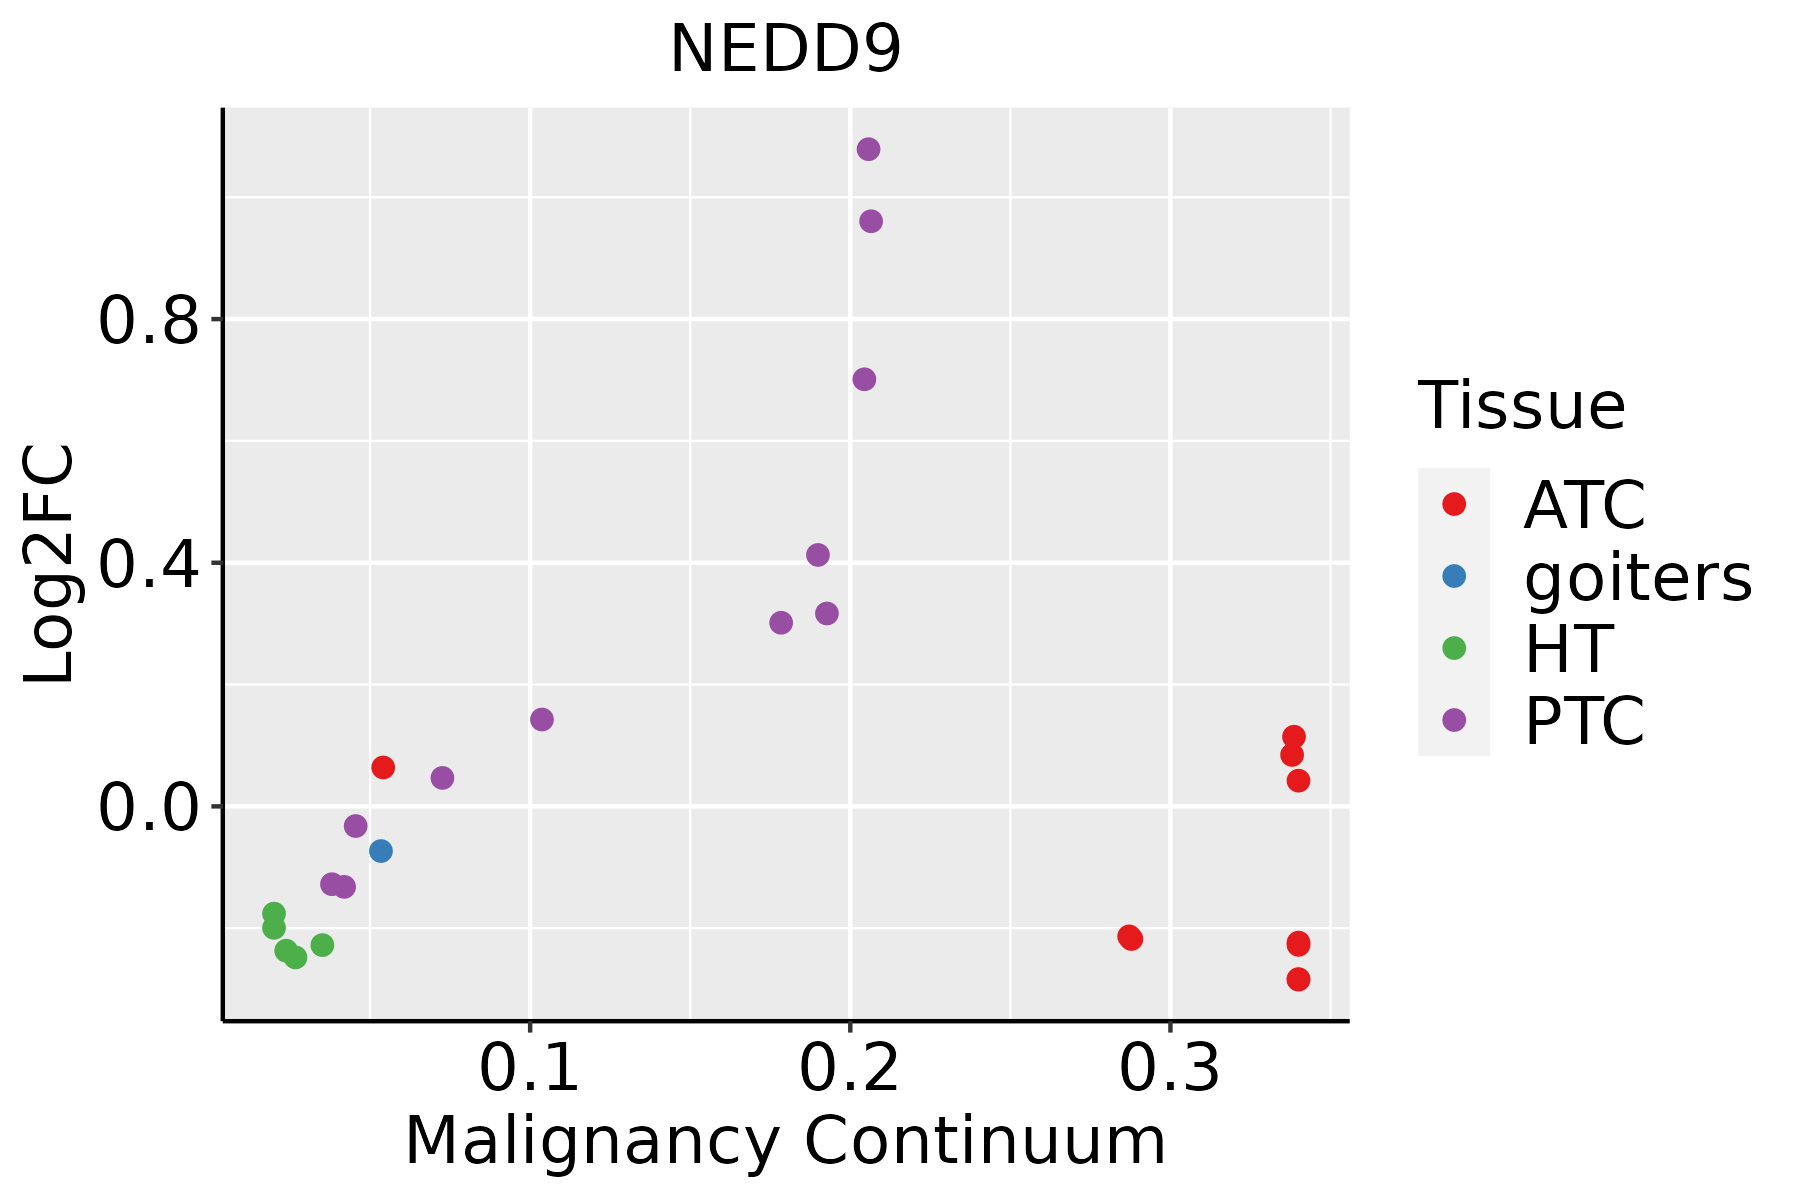
ATC: Anaplastic thyroid cancer
HT: Hashimoto's thyroiditis
PTC: Papillary thyroid cancer
∗log2FC in expression of this searched gene in stem-like cells from each diseased tissue sample relative to stem-like cells in normal samples in each tissue plotted against the malignancy continuum. Samples are colored based on if they are from different disease stage.

Top

Malignant transformation related pathway analysis

check buttonFind out the enriched GO biological processes and KEGG pathways involved in transition from healthy to precancer to cancer
check button Figure of enriched GO biological processes.
TissueDisease StageEnriched GO biological Processes
ColorectumADGO analysis - Figure of enriched GO biological processes: Top 15 enriched GO BP terms are showed in the bar plot of each disease state in each tissue. Each row represents a significant GO biological process which is colored according to the -log10(p.adjust).
ColorectumSERGO analysis - Figure of enriched GO biological processes: Top 15 enriched GO BP terms are showed in the bar plot of each disease state in each tissue. Each row represents a significant GO biological process which is colored according to the -log10(p.adjust).
ColorectumMSSGO analysis - Figure of enriched GO biological processes: Top 15 enriched GO BP terms are showed in the bar plot of each disease state in each tissue. Each row represents a significant GO biological process which is colored according to the -log10(p.adjust).
ColorectumMSI-HGO analysis - Figure of enriched GO biological processes: Top 15 enriched GO BP terms are showed in the bar plot of each disease state in each tissue. Each row represents a significant GO biological process which is colored according to the -log10(p.adjust).
ColorectumFAPGO analysis - Figure of enriched GO biological processes: Top 15 enriched GO BP terms are showed in the bar plot of each disease state in each tissue. Each row represents a significant GO biological process which is colored according to the -log10(p.adjust).
∗Top 15 enriched GO BP terms are showed in the bar plot of each disease state in each tissue. Each row represents a significant GO biological process which is colored according to the -log10(p.adjust).
Page: 1 2 3 4 5 6 7 8 9 

check button Enriched GO biological processes.
GO IDTissueDisease StageDescriptionGene RatioBg Ratiopvaluep.adjustCount
GO:001081015EndometriumAEHregulation of cell-substrate adhesion64/2100221/187233.85e-139.62e-1164
GO:002260415EndometriumAEHregulation of cell morphogenesis79/2100309/187231.04e-122.24e-1079
GO:00315899EndometriumAEHcell-substrate adhesion87/2100363/187233.51e-125.70e-1087
GO:190002410EndometriumAEHregulation of substrate adhesion-dependent cell spreading27/210057/187239.07e-121.43e-0927
GO:000701516EndometriumAEHactin filament organization98/2100442/187231.99e-112.98e-0998
GO:004578516EndometriumAEHpositive regulation of cell adhesion96/2100437/187235.50e-117.18e-0996
GO:190002610EndometriumAEHpositive regulation of substrate adhesion-dependent cell spreading20/210041/187232.36e-091.89e-0720
GO:001081116EndometriumAEHpositive regulation of cell-substrate adhesion38/2100123/187233.08e-092.26e-0738
GO:001076910EndometriumAEHregulation of cell morphogenesis involved in differentiation31/210096/187232.70e-081.56e-0631
GO:003444610EndometriumAEHsubstrate adhesion-dependent cell spreading33/2100108/187234.45e-082.43e-0633
GO:00072296EndometriumAEHintegrin-mediated signaling pathway32/2100107/187231.24e-075.80e-0632
GO:00315329EndometriumAEHactin cytoskeleton reorganization32/2100107/187231.24e-075.80e-0632
GO:005101716EndometriumAEHactin filament bundle assembly39/2100157/187231.21e-063.91e-0539
GO:006157216EndometriumAEHactin filament bundle organization39/2100161/187232.36e-066.86e-0539
GO:00107709EndometriumAEHpositive regulation of cell morphogenesis involved in differentiation24/210079/187233.33e-069.03e-0524
GO:00430878EndometriumAEHregulation of GTPase activity66/2100348/187231.26e-052.77e-0466
GO:00107207EndometriumAEHpositive regulation of cell development57/2100298/187233.72e-056.49e-0457
GO:003367414EndometriumAEHpositive regulation of kinase activity78/2100467/187232.03e-042.54e-0378
GO:00435477EndometriumAEHpositive regulation of GTPase activity48/2100255/187232.18e-042.67e-0348
GO:00458609EndometriumAEHpositive regulation of protein kinase activity66/2100386/187233.14e-043.53e-0366
Page: 1 2 3 4 5 6 7 8 9 10 11 12 13 14 15 16 17 

check button Enriched KEGG pathways.
Pathway IDTissueDisease StageDescriptionGene RatioBg Ratiopvaluep.adjustqvalueCount
Page: 1 

Top

Cell-cell communication analysis

check buttonIdentification of potential cell-cell interactions between two cell types and their ligand-receptor pairs for different disease states
LigandReceptorLRpairPathwayTissueDisease Stage
Page: 1 

Top

Single-cell gene regulatory network inference analysis

check buttonFind out the significant the regulons (TFs) and the target genes of each regulon across cell types for different disease states
TFCell TypeTissueDisease StageTarget GeneRSSRegulon Activity
∗The dot plots of a searched regulon are shown for all cell subpopulations in each disease state of each tissue based on the regulon specific score inferred using pySCENIC and by calculating the average expression.
Page: 1 

Top

Somatic mutation of malignant transformation related genes

check buttonAnnotation of somatic variants for genes involved in malignant transformation
Hugo SymbolVariant ClassVariant ClassificationdbSNP RSHGVScHGVSpHGVSp ShortSWISSPROTBIOTYPESIFTPolyPhenTumor Sample BarcodeTissueHistologySexAgeStageTherapy TypesDrugsOutcome
NEDD9SNVMissense_Mutationc.417N>Cp.Gln139Hisp.Q139HQ14511protein_codingtolerated(0.17)benign(0.04)TCGA-A2-A0CX-01Breastbreast invasive carcinomaFemale<65I/IIChemotherapyadriamycinSD
NEDD9SNVMissense_Mutationc.932G>Ap.Gly311Aspp.G311DQ14511protein_codingtolerated(0.16)benign(0.003)TCGA-A8-A07W-01Breastbreast invasive carcinomaFemale>=65III/IVHormone TherapyexemestaneSD
NEDD9SNVMissense_Mutationrs759739278c.74N>Ap.Arg25Hisp.R25HQ14511protein_codingdeleterious(0)probably_damaging(1)TCGA-A8-A09A-01Breastbreast invasive carcinomaFemale<65I/IIHormone TherapytamoxiphenSD
NEDD9SNVMissense_Mutationrs748033858c.499N>Ap.Glu167Lysp.E167KQ14511protein_codingdeleterious(0.03)possibly_damaging(0.736)TCGA-BH-A0BT-01Breastbreast invasive carcinomaFemale<65I/IIChemotherapyadriamycinCR
NEDD9SNVMissense_Mutationrs200047696c.967N>Ap.Val323Ilep.V323IQ14511protein_codingtolerated(0.69)benign(0.003)TCGA-BH-A1ET-01Breastbreast invasive carcinomaFemale<65I/IIUnknownUnknownSD
NEDD9SNVMissense_Mutationc.1080N>Gp.Asp360Glup.D360EQ14511protein_codingtolerated(0.41)possibly_damaging(0.622)TCGA-D8-A1JG-01Breastbreast invasive carcinomaFemale<65I/IIChemotherapydoxorubicinSD
NEDD9SNVMissense_Mutationc.1879N>Tp.Asp627Tyrp.D627YQ14511protein_codingdeleterious(0)probably_damaging(0.995)TCGA-D8-A27F-01Breastbreast invasive carcinomaFemale<65I/IIChemotherapyadriamycin+cyclophosphamideSD
NEDD9SNVMissense_Mutationc.1157N>Tp.Ser386Phep.S386FQ14511protein_codingdeleterious(0.02)benign(0.406)TCGA-D8-A27G-01Breastbreast invasive carcinomaFemale>=65I/IIUnknownUnknownSD
NEDD9SNVMissense_Mutationnovelc.2378N>Ap.Ala793Glup.A793EQ14511protein_codingdeleterious(0)probably_damaging(0.983)TCGA-D8-A3Z5-01Breastbreast invasive carcinomaFemale<65III/IVUnknownUnknownSD
NEDD9SNVMissense_Mutationrs3734401c.1730N>Tp.Thr577Metp.T577MQ14511protein_codingtolerated(0.06)benign(0.115)TCGA-E9-A1RH-01Breastbreast invasive carcinomaFemale<65I/IIChemotherapy5-fluorouracilSD
Page: 1 2 3 4 5 6 7 8 9 10 

Top

Related drugs of malignant transformation related genes

check buttonIdentification of chemicals and drugs interact with genes involved in malignant transfromation
(DGIdb 4.0)
Entrez IDSymbolCategoryInteraction TypesDrug Claim NameDrug NamePMIDs
Page: 1