
|
|||||
|
 | |
| |
| |
| |
| |
| |
|
Gene: NEDD4L |
Gene summary for NEDD4L |
| Gene information | Species | Human | Gene symbol | NEDD4L | Gene ID | 23327 |
| Gene name | NEDD4 like E3 ubiquitin protein ligase | |
| Gene Alias | NEDD4-2 | |
| Cytomap | 18q21.31 | |
| Gene Type | protein-coding | GO ID | GO:0000209 | UniProtAcc | A0A024R2A4 |
Top |
Malignant transformation analysis |
| Identification of the aberrant gene expression in precancerous and cancerous lesions by comparing the gene expression of stem-like cells in diseased tissues with normal stem cells |
| Entrez ID | Symbol | Replicates | Species | Organ | Tissue | Adj P-value | Log2FC | Malignancy |
| 23327 | NEDD4L | CCI_1 | Human | Cervix | CC | 7.51e-25 | 1.54e+00 | 0.528 |
| 23327 | NEDD4L | CCI_2 | Human | Cervix | CC | 3.57e-15 | 1.54e+00 | 0.5249 |
| 23327 | NEDD4L | CCI_3 | Human | Cervix | CC | 1.32e-21 | 1.33e+00 | 0.516 |
| 23327 | NEDD4L | CCII_1 | Human | Cervix | CC | 1.56e-09 | 4.95e-01 | 0.3249 |
| 23327 | NEDD4L | sample1 | Human | Cervix | CC | 3.05e-09 | 5.17e-01 | 0.0959 |
| 23327 | NEDD4L | H2 | Human | Cervix | HSIL_HPV | 5.87e-06 | 2.28e-01 | 0.0632 |
| 23327 | NEDD4L | T1 | Human | Cervix | CC | 1.63e-22 | 6.34e-01 | 0.0918 |
| 23327 | NEDD4L | HTA11_3410_2000001011 | Human | Colorectum | AD | 1.20e-24 | -6.52e-01 | 0.0155 |
| 23327 | NEDD4L | HTA11_2951_2000001011 | Human | Colorectum | AD | 1.17e-07 | -9.52e-01 | 0.0216 |
| 23327 | NEDD4L | HTA11_347_2000001011 | Human | Colorectum | AD | 1.01e-08 | 5.69e-01 | -0.1954 |
| 23327 | NEDD4L | HTA11_411_2000001011 | Human | Colorectum | SER | 1.05e-10 | 1.18e+00 | -0.2602 |
| 23327 | NEDD4L | HTA11_2112_2000001011 | Human | Colorectum | SER | 1.25e-02 | 5.58e-01 | -0.2196 |
| 23327 | NEDD4L | HTA11_9341_2000001011 | Human | Colorectum | SER | 3.57e-02 | -5.89e-01 | -0.00410000000000005 |
| 23327 | NEDD4L | HTA11_866_3004761011 | Human | Colorectum | AD | 2.46e-04 | -4.98e-01 | 0.096 |
| 23327 | NEDD4L | HTA11_8622_2000001021 | Human | Colorectum | SER | 4.51e-02 | -5.17e-01 | 0.0528 |
| 23327 | NEDD4L | HTA11_99999970781_79442 | Human | Colorectum | MSS | 2.13e-04 | -3.57e-01 | 0.294 |
| 23327 | NEDD4L | HTA11_99999965104_69814 | Human | Colorectum | MSS | 2.28e-03 | 4.10e-01 | 0.281 |
| 23327 | NEDD4L | HTA11_99999971662_82457 | Human | Colorectum | MSS | 1.79e-12 | -4.95e-01 | 0.3859 |
| 23327 | NEDD4L | HTA11_99999973899_84307 | Human | Colorectum | MSS | 3.84e-14 | -9.36e-01 | 0.2585 |
| 23327 | NEDD4L | HTA11_99999974143_84620 | Human | Colorectum | MSS | 1.04e-38 | -8.51e-01 | 0.3005 |
| Page: 1 2 3 4 5 6 7 8 9 10 11 12 |
| Tissue | Expression Dynamics | Abbreviation |
| Cervix |  | CC: Cervix cancer |
| HSIL_HPV: HPV-infected high-grade squamous intraepithelial lesions | ||
| N_HPV: HPV-infected normal cervix | ||
| Colorectum (GSE201348) |  | FAP: Familial adenomatous polyposis |
| CRC: Colorectal cancer | ||
| Colorectum (HTA11) |  | AD: Adenomas |
| SER: Sessile serrated lesions | ||
| MSI-H: Microsatellite-high colorectal cancer | ||
| MSS: Microsatellite stable colorectal cancer | ||
| Endometrium | 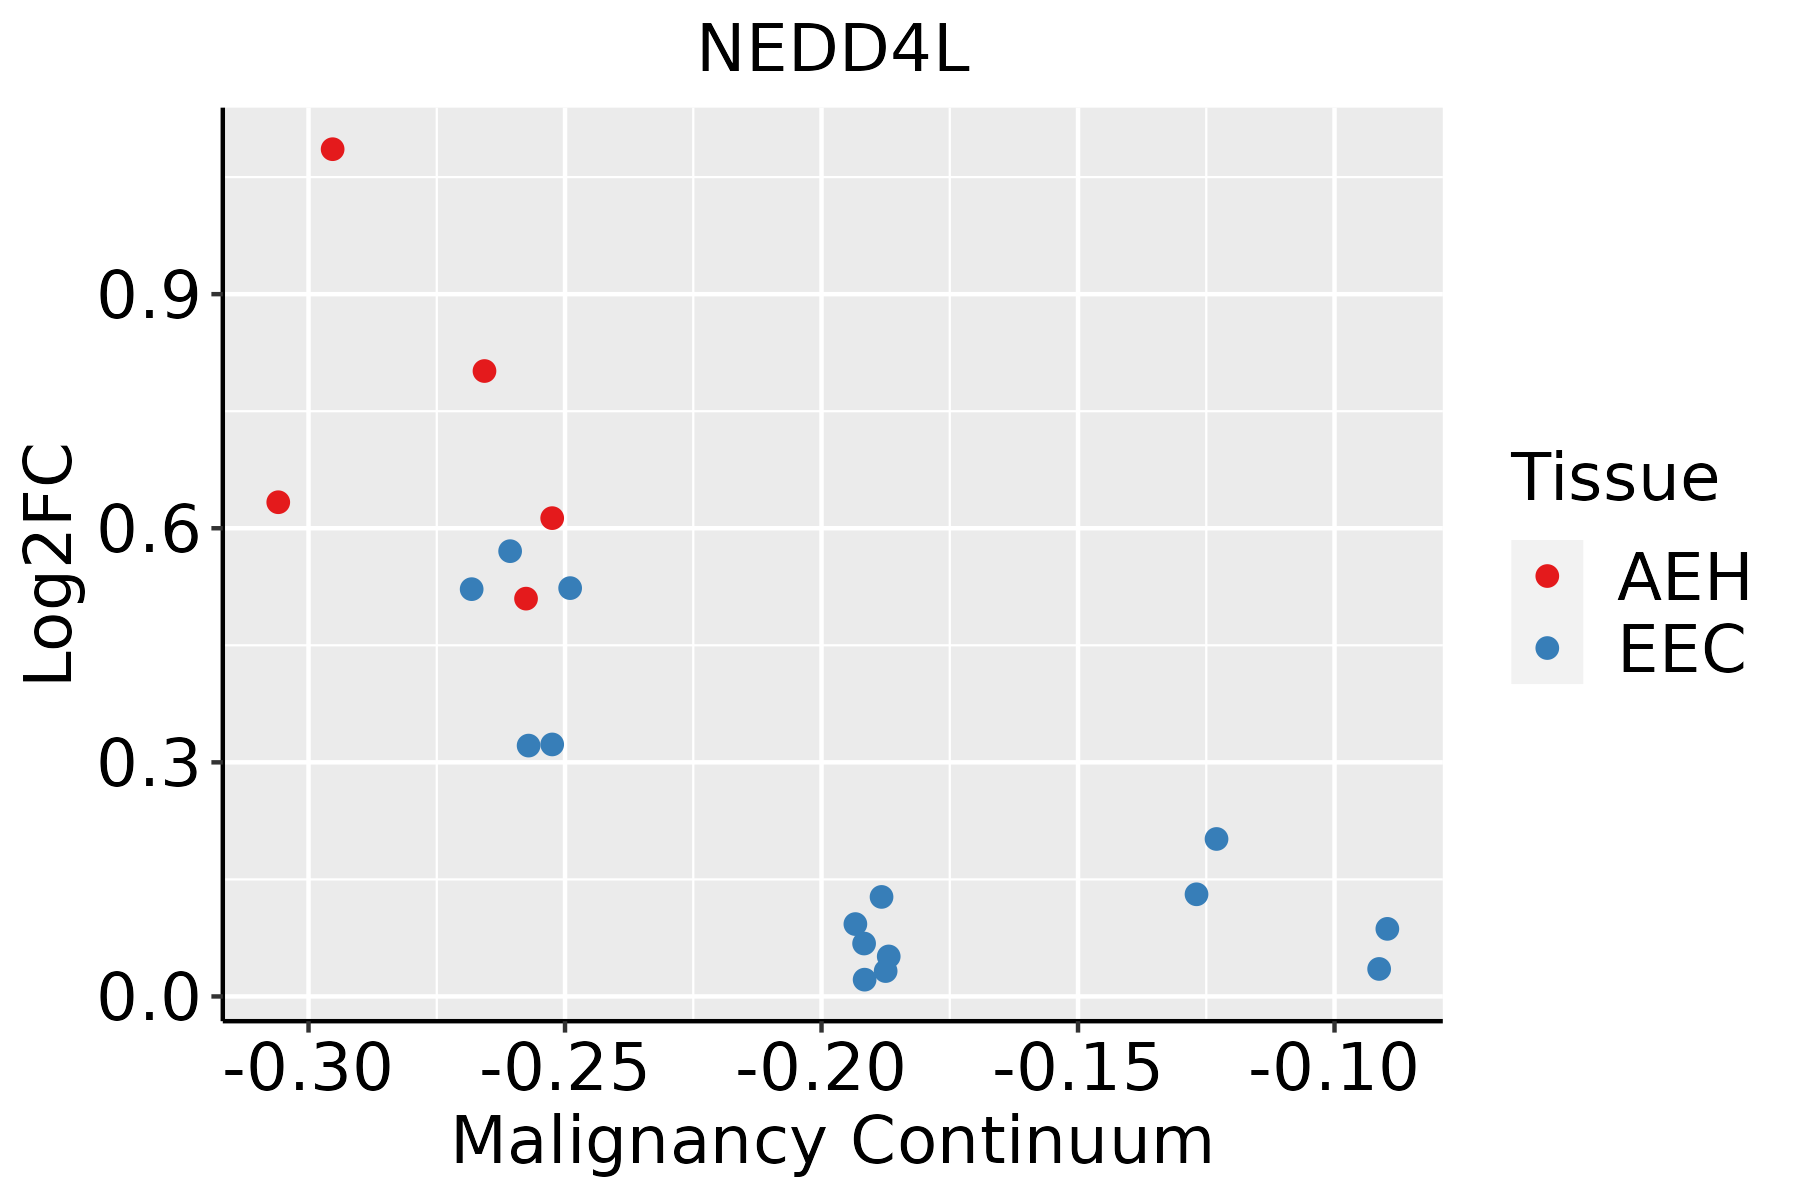 | AEH: Atypical endometrial hyperplasia |
| EEC: Endometrioid Cancer | ||
| Esophagus | 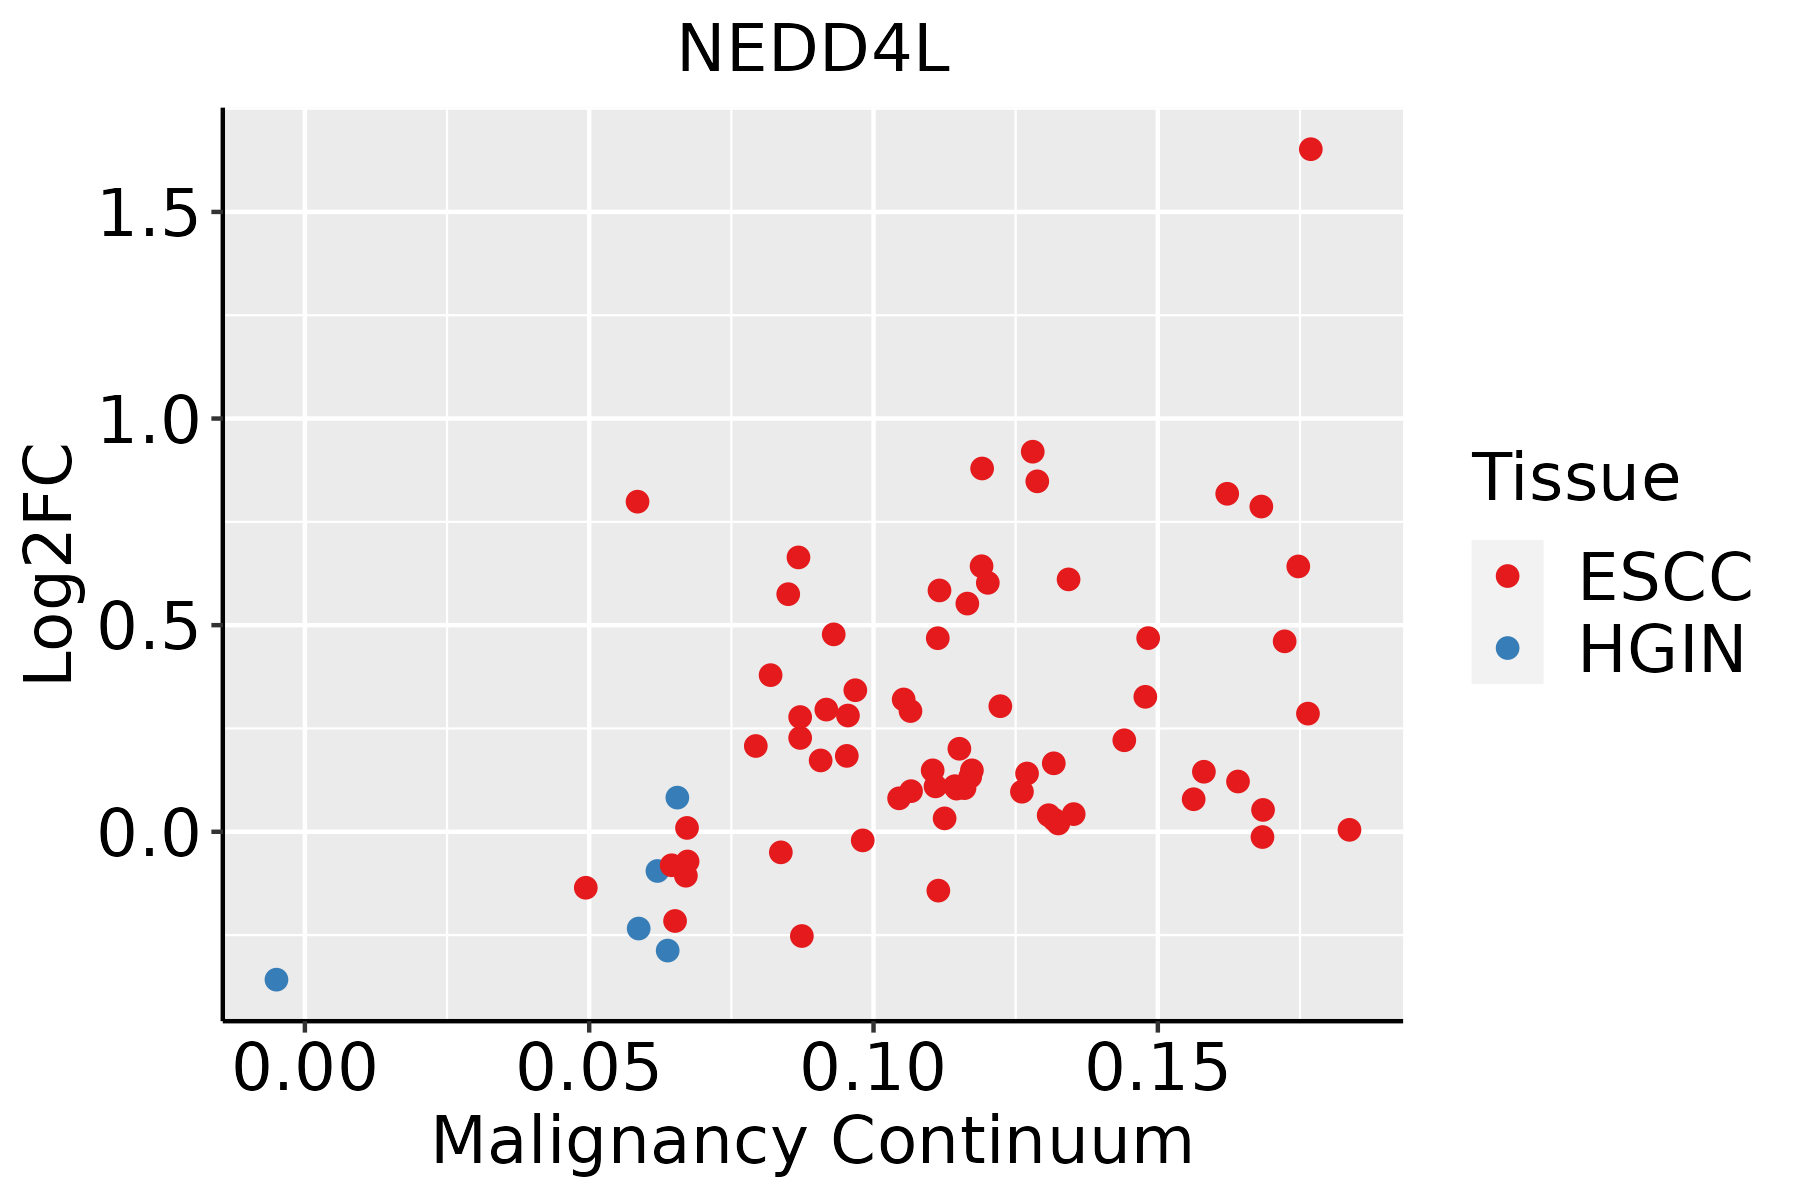 | ESCC: Esophageal squamous cell carcinoma |
| HGIN: High-grade intraepithelial neoplasias | ||
| LGIN: Low-grade intraepithelial neoplasias | ||
| GC | 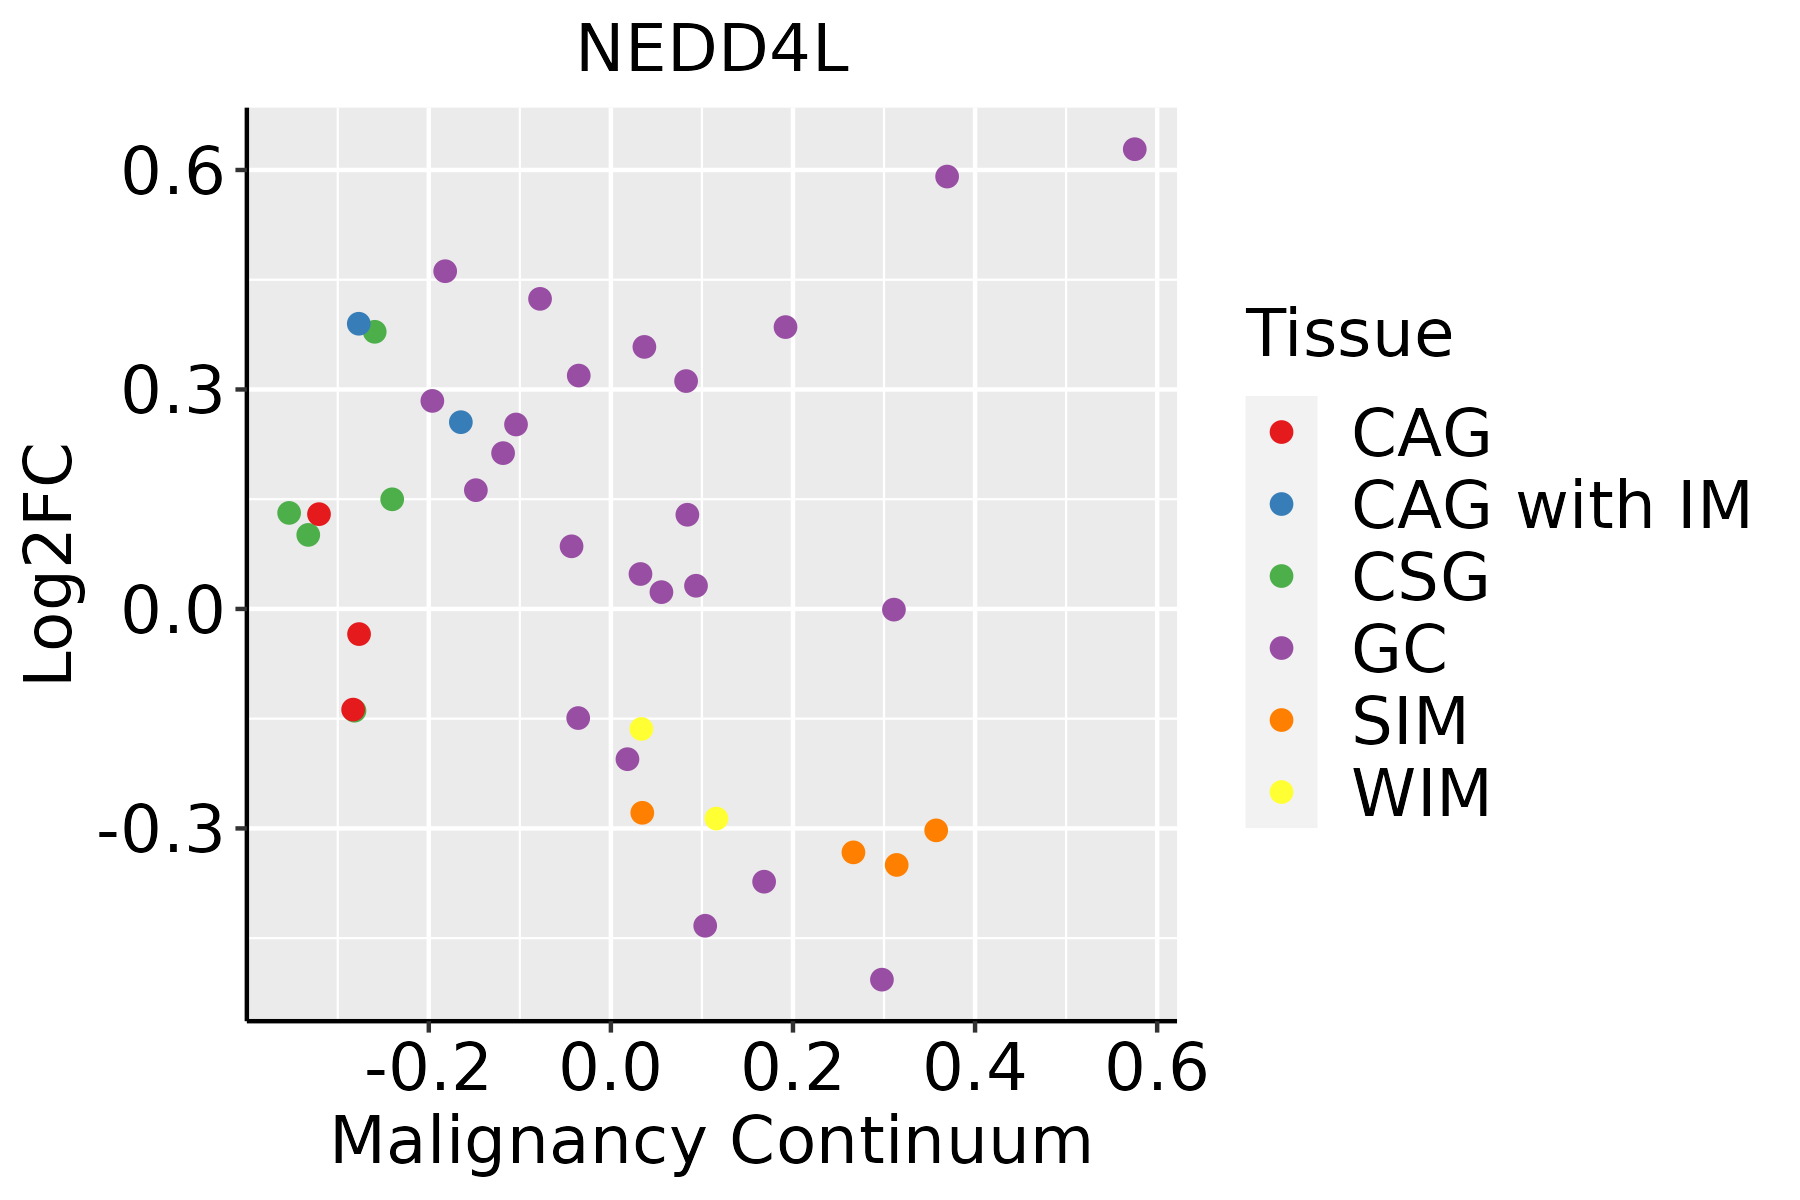 | CAG: Chronic atrophic gastritis |
| CAG with IM: Chronic atrophic gastritis with intestinal metaplasia | ||
| CSG: Chronic superficial gastritis | ||
| GC: Gastric cancer | ||
| SIM: Severe intestinal metaplasia | ||
| WIM: Wild intestinal metaplasia | ||
| Liver | 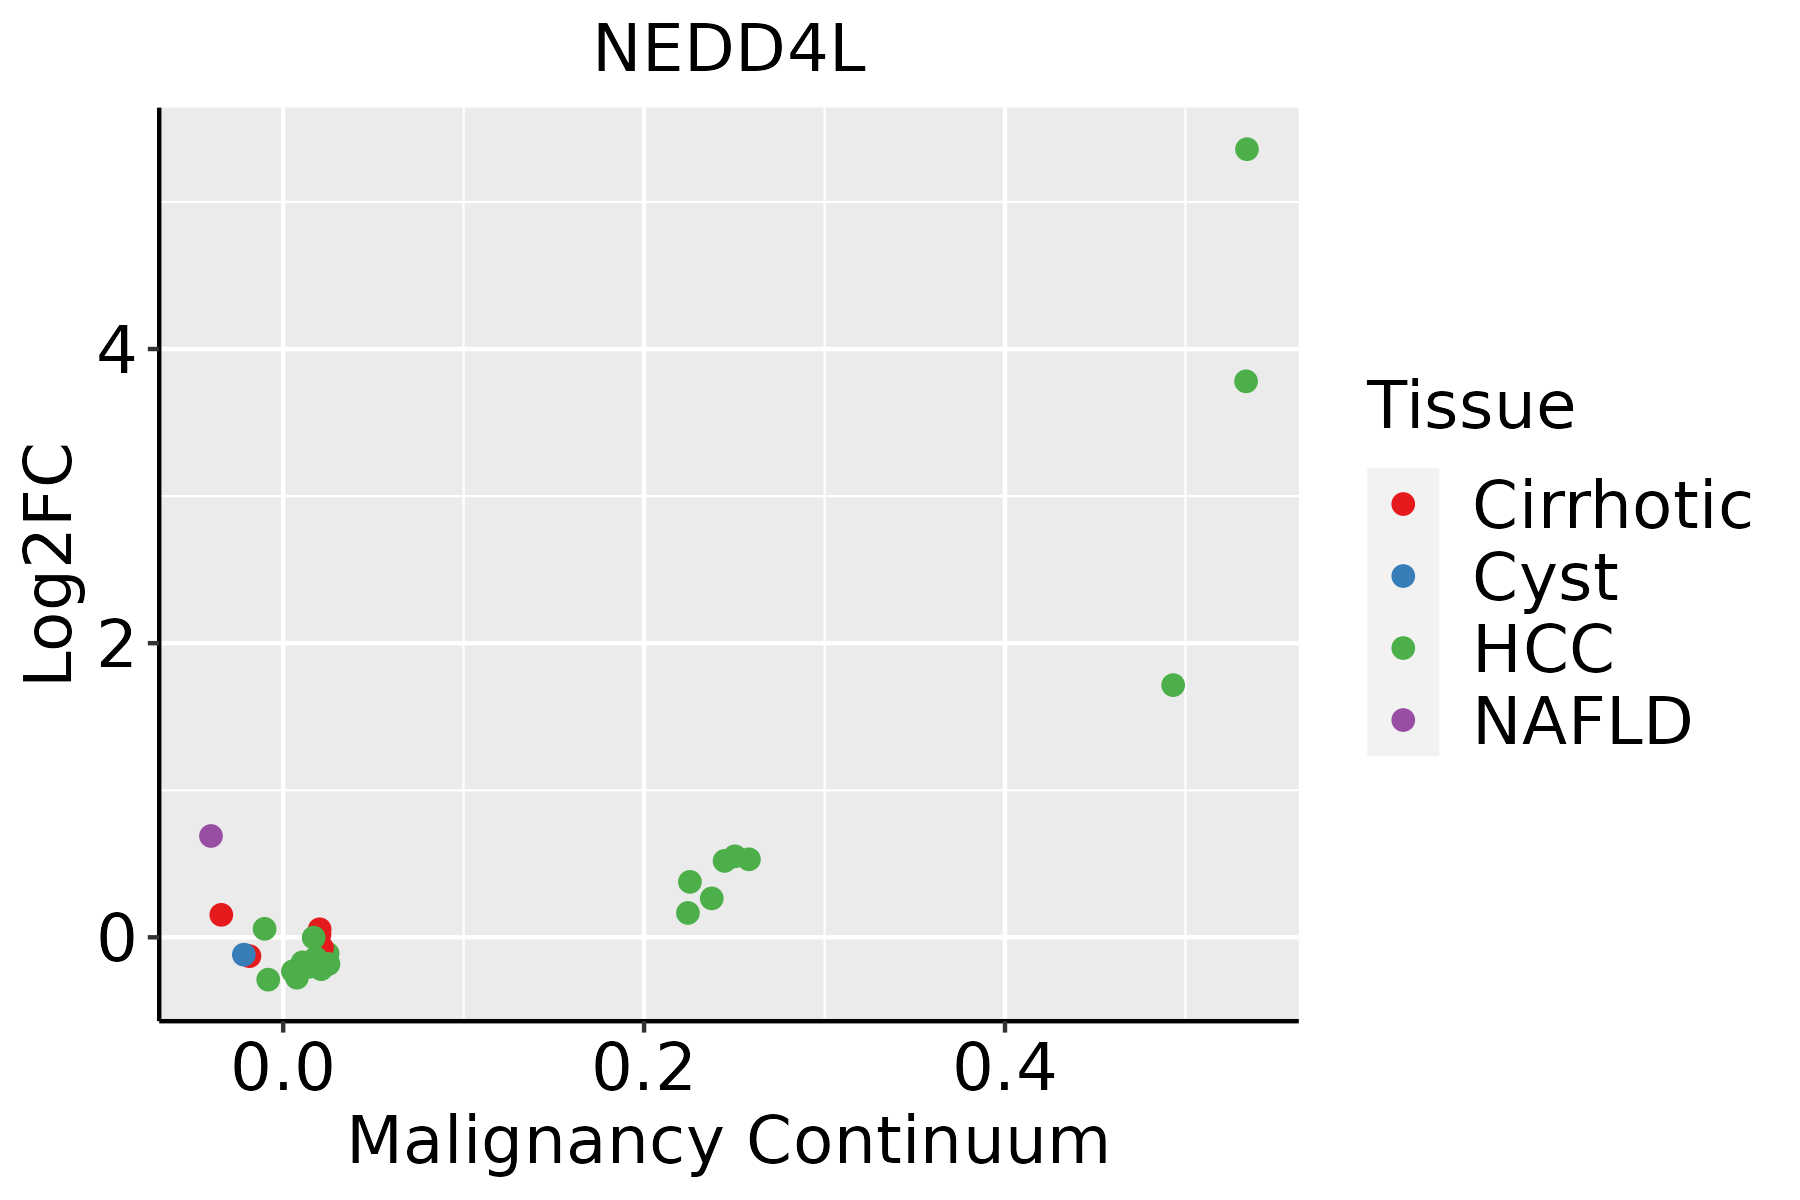 | HCC: Hepatocellular carcinoma |
| NAFLD: Non-alcoholic fatty liver disease | ||
| Lung | 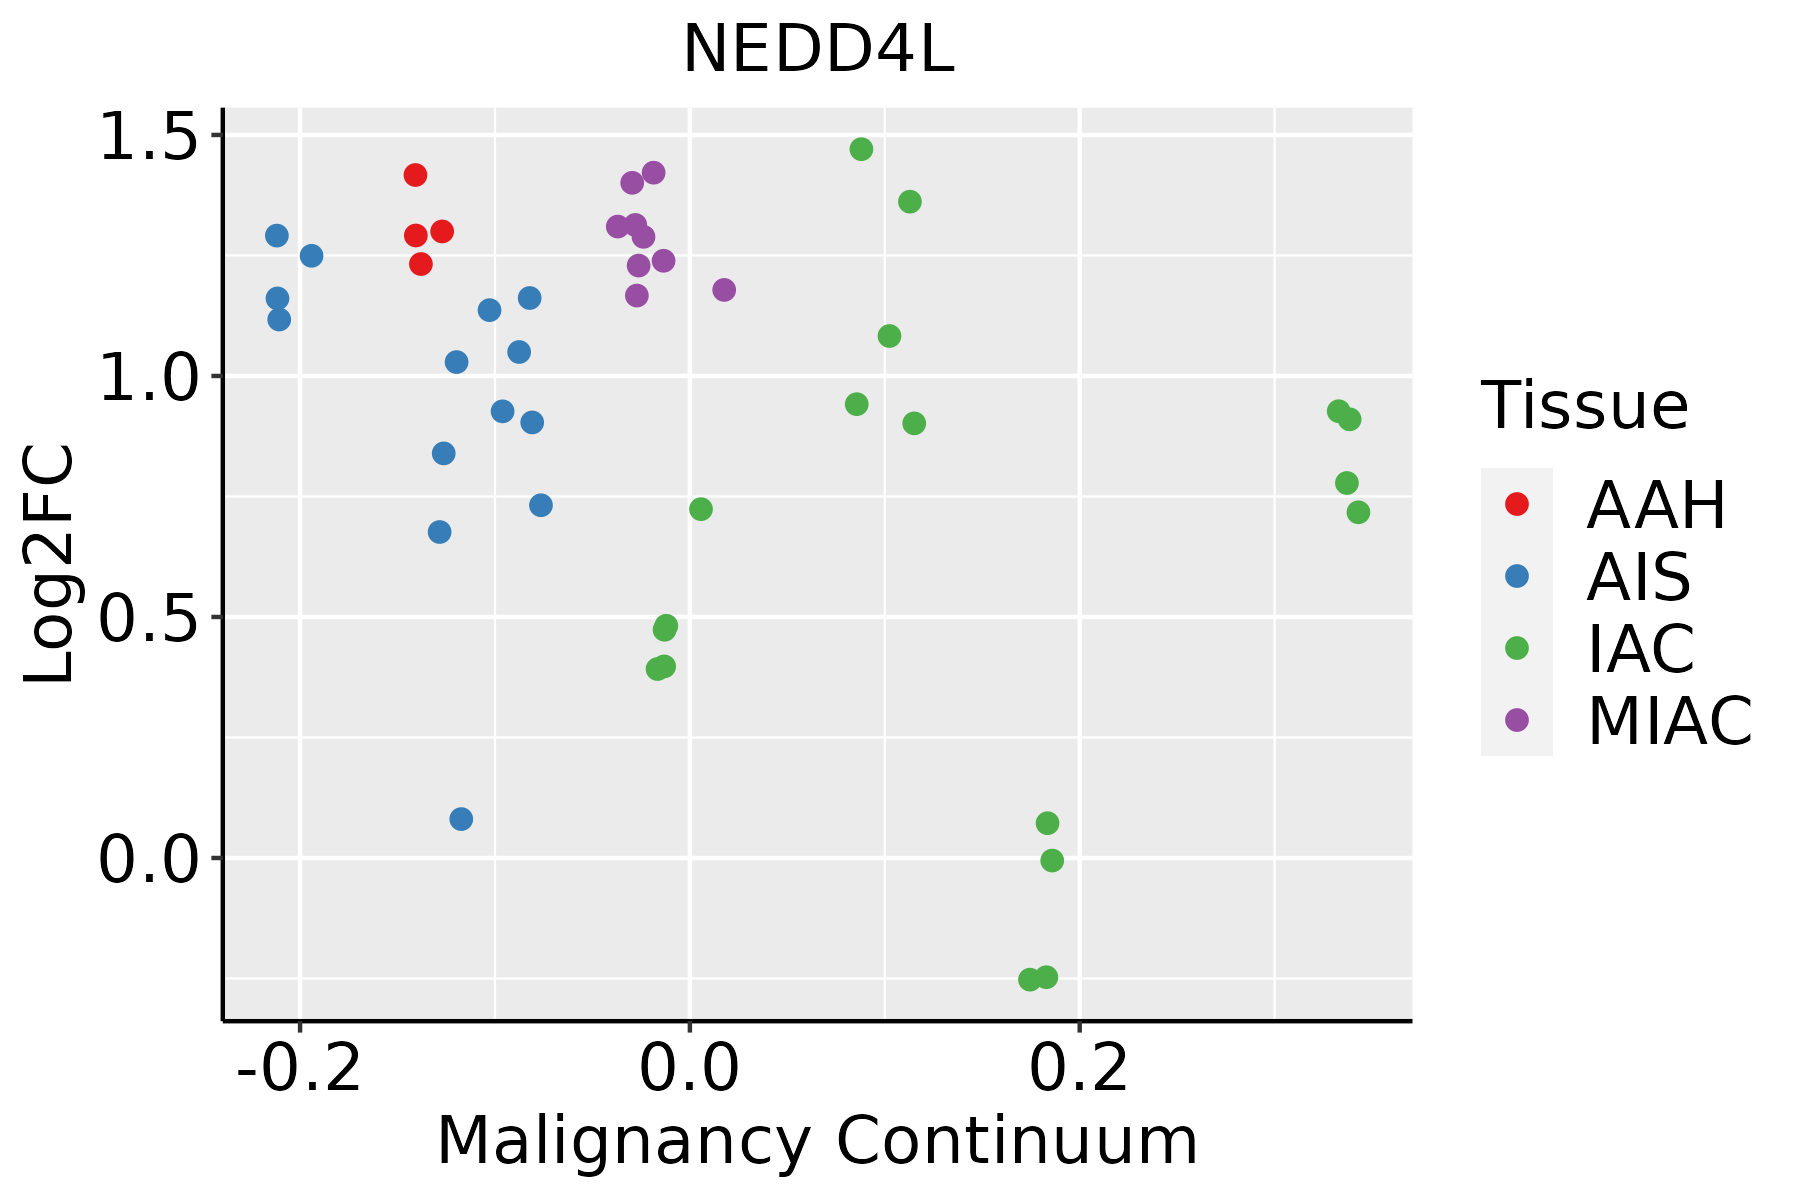 | AAH: Atypical adenomatous hyperplasia |
| AIS: Adenocarcinoma in situ | ||
| IAC: Invasive lung adenocarcinoma | ||
| MIA: Minimally invasive adenocarcinoma | ||
| Oral Cavity | 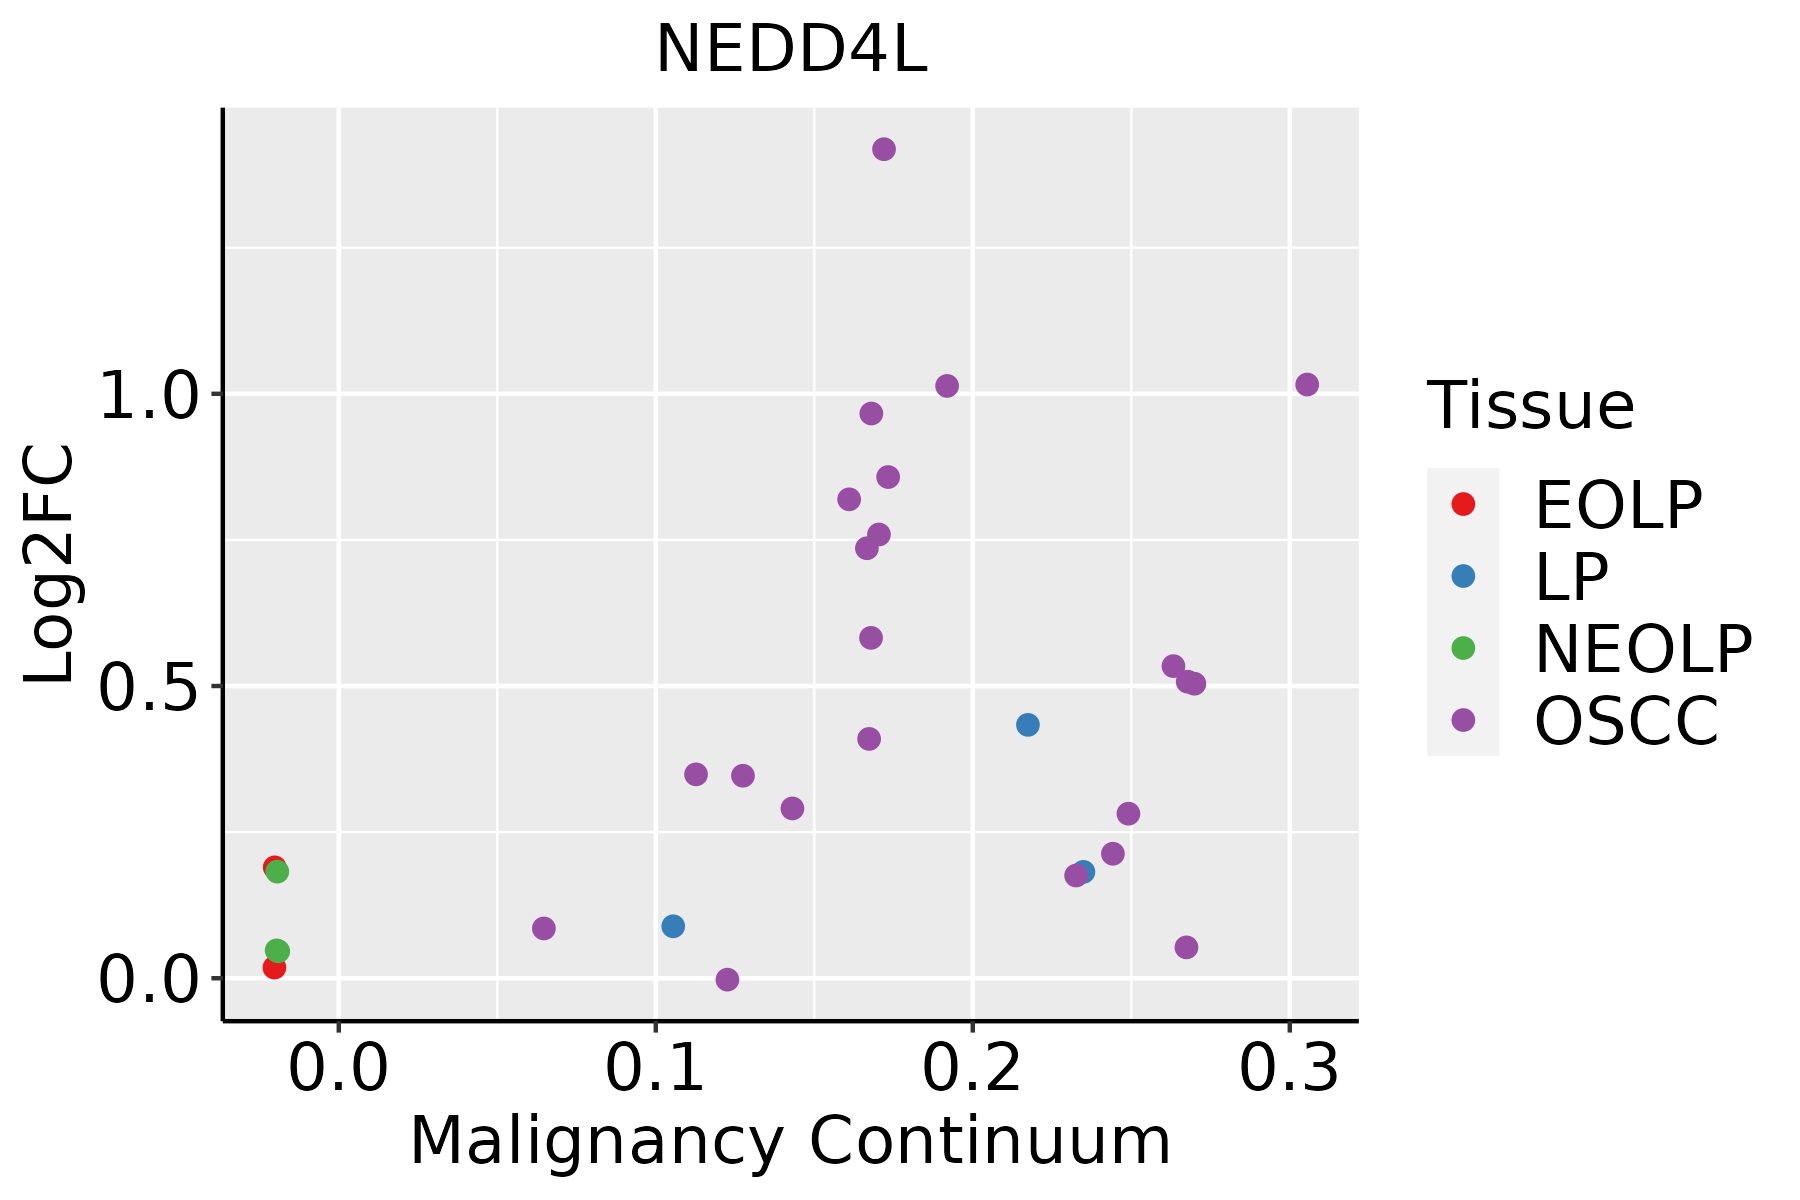 | EOLP: Erosive Oral lichen planus |
| LP: leukoplakia | ||
| NEOLP: Non-erosive oral lichen planus | ||
| OSCC: Oral squamous cell carcinoma | ||
| Prostate |  | BPH: Benign Prostatic Hyperplasia |
| Skin | 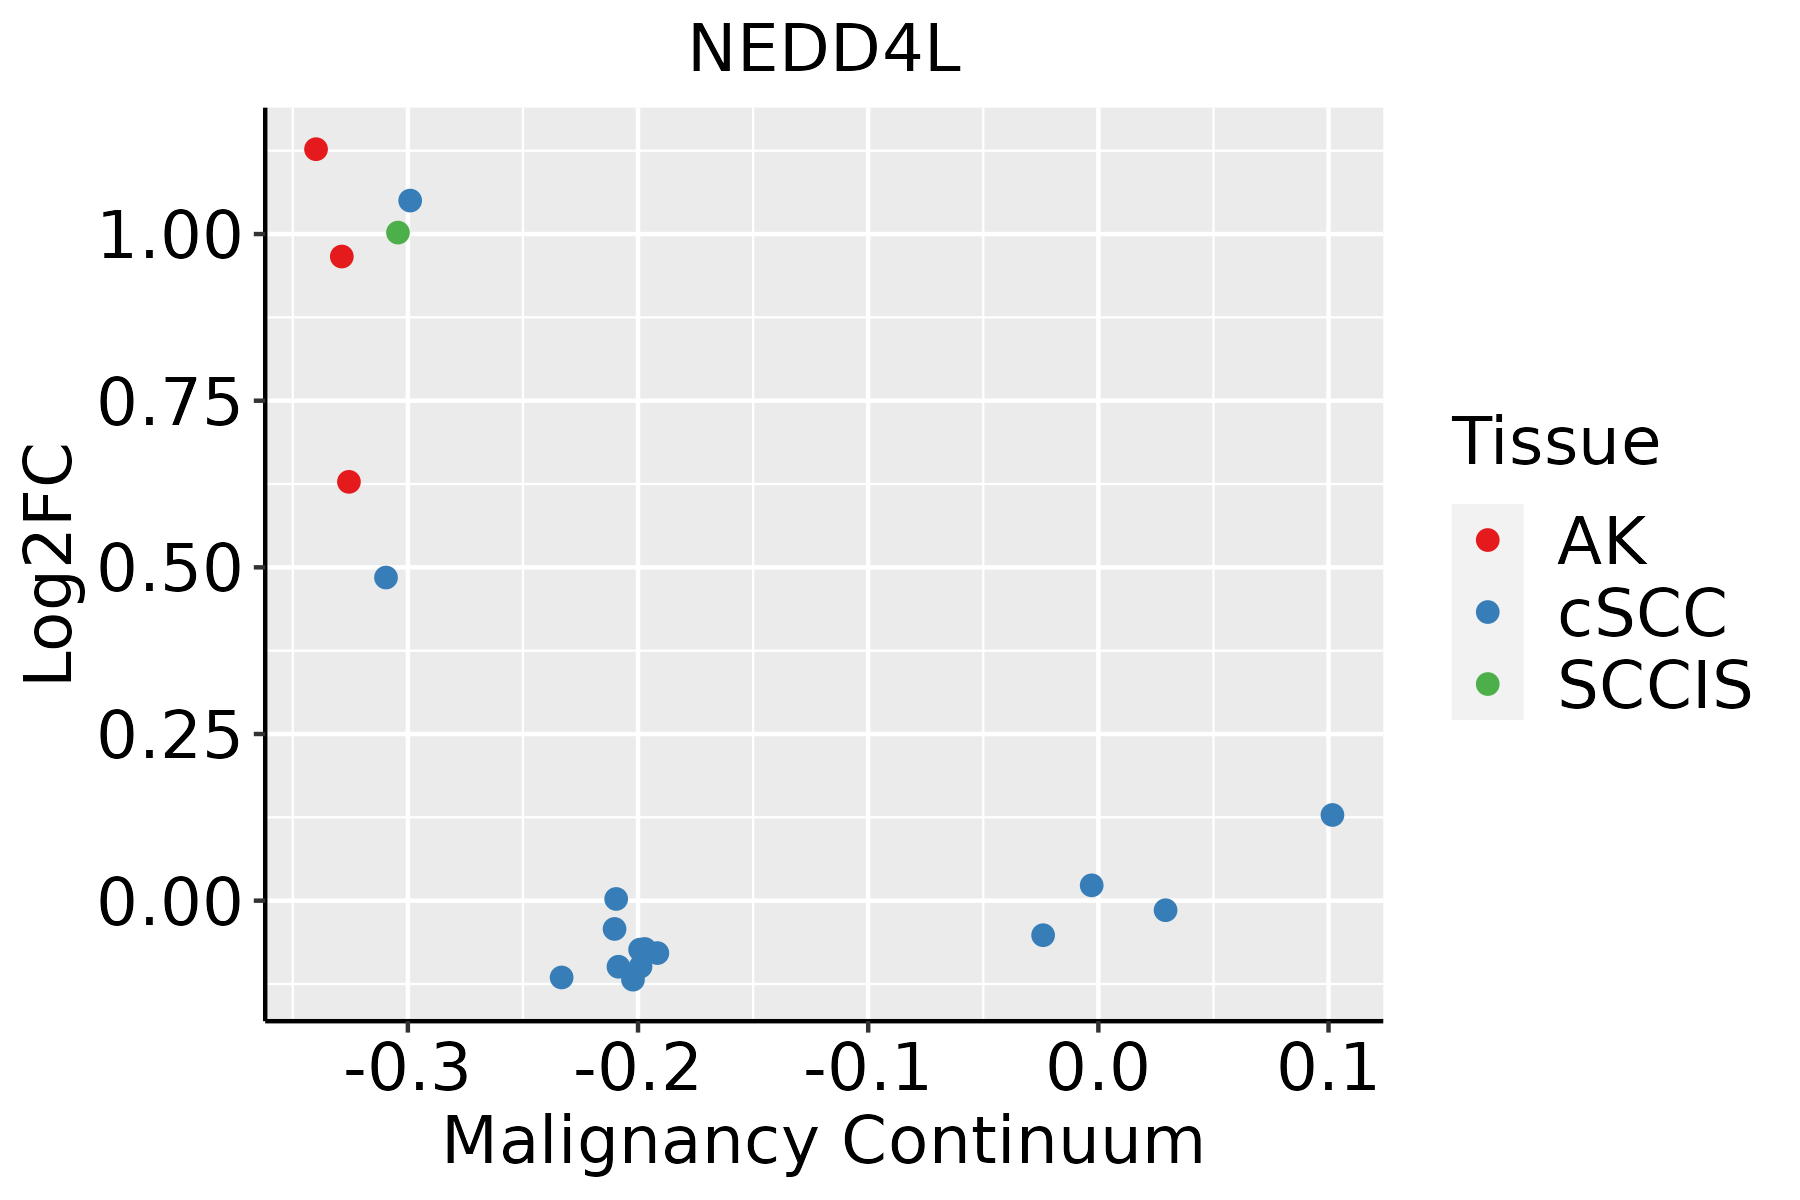 | AK: Actinic keratosis |
| cSCC: Cutaneous squamous cell carcinoma | ||
| SCCIS:squamous cell carcinoma in situ | ||
| Thyroid | 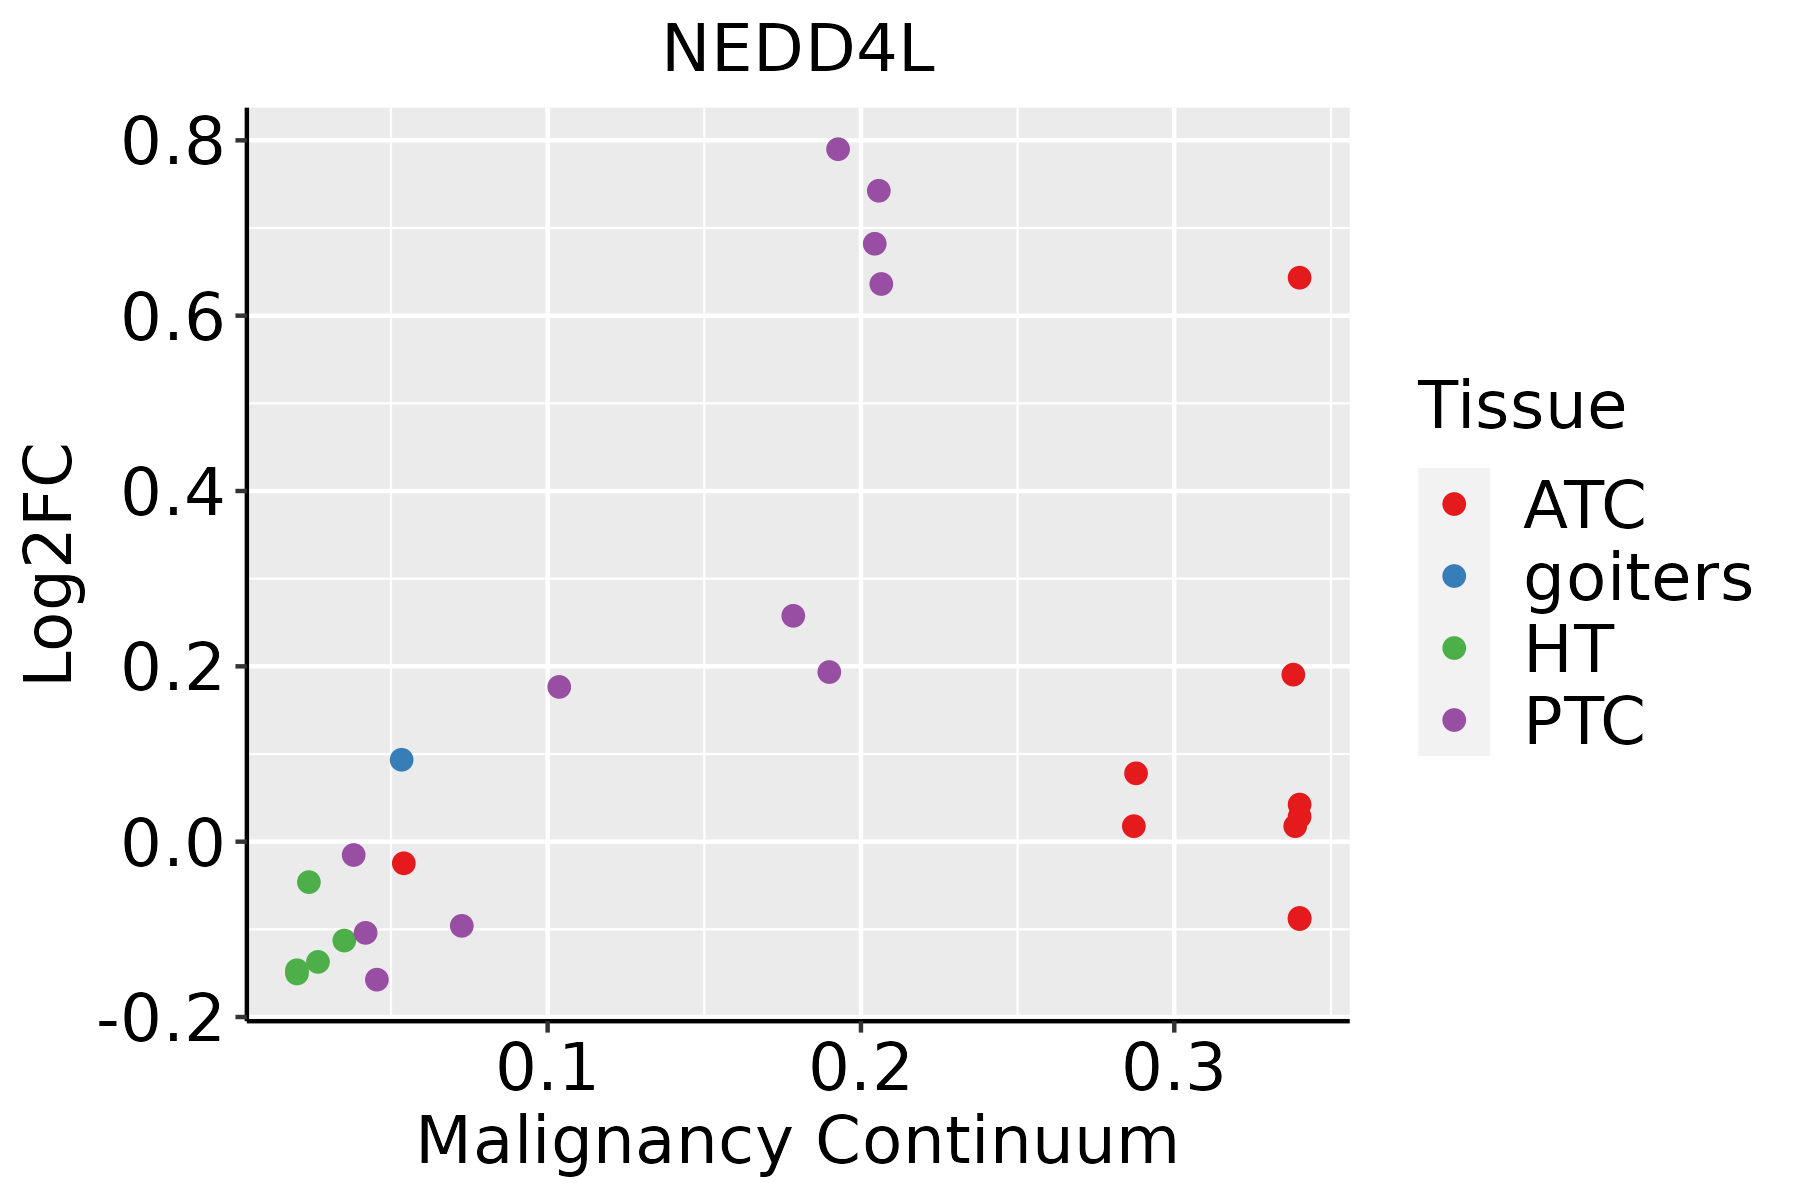 | ATC: Anaplastic thyroid cancer |
| HT: Hashimoto's thyroiditis | ||
| PTC: Papillary thyroid cancer |
| ∗log2FC in expression of this searched gene in stem-like cells from each diseased tissue sample relative to stem-like cells in normal samples in each tissue plotted against the malignancy continuum. Samples are colored based on if they are from different disease stage. |
Top |
Malignant transformation related pathway analysis |
| Find out the enriched GO biological processes and KEGG pathways involved in transition from healthy to precancer to cancer |
| Tissue | Disease Stage | Enriched GO biological Processes |
| Colorectum | AD |  |
| Colorectum | SER |  |
| Colorectum | MSS |  |
| Colorectum | MSI-H |  |
| Colorectum | FAP |  |
| ∗Top 15 enriched GO BP terms are showed in the bar plot of each disease state in each tissue. Each row represents a significant GO biological process which is colored according to the -log10(p.adjust). |
| Page: 1 2 3 4 5 6 7 8 9 |
| GO ID | Tissue | Disease Stage | Description | Gene Ratio | Bg Ratio | pvalue | p.adjust | Count |
| GO:004217610 | Cervix | CC | regulation of protein catabolic process | 104/2311 | 391/18723 | 9.39e-15 | 9.36e-12 | 104 |
| GO:002260410 | Cervix | CC | regulation of cell morphogenesis | 84/2311 | 309/18723 | 1.00e-12 | 4.29e-10 | 84 |
| GO:004573210 | Cervix | CC | positive regulation of protein catabolic process | 65/2311 | 231/18723 | 7.44e-11 | 1.39e-08 | 65 |
| GO:001049810 | Cervix | CC | proteasomal protein catabolic process | 111/2311 | 490/18723 | 8.98e-11 | 1.58e-08 | 111 |
| GO:000989610 | Cervix | CC | positive regulation of catabolic process | 109/2311 | 492/18723 | 5.26e-10 | 6.99e-08 | 109 |
| GO:004316110 | Cervix | CC | proteasome-mediated ubiquitin-dependent protein catabolic process | 91/2311 | 412/18723 | 1.65e-08 | 1.25e-06 | 91 |
| GO:00002097 | Cervix | CC | protein polyubiquitination | 58/2311 | 236/18723 | 1.57e-07 | 7.41e-06 | 58 |
| GO:00163587 | Cervix | CC | dendrite development | 58/2311 | 243/18723 | 4.52e-07 | 1.76e-05 | 58 |
| GO:00109757 | Cervix | CC | regulation of neuron projection development | 88/2311 | 445/18723 | 4.26e-06 | 1.09e-04 | 88 |
| GO:00709366 | Cervix | CC | protein K48-linked ubiquitination | 22/2311 | 65/18723 | 5.56e-06 | 1.38e-04 | 22 |
| GO:003164710 | Cervix | CC | regulation of protein stability | 63/2311 | 298/18723 | 1.14e-05 | 2.45e-04 | 63 |
| GO:00160498 | Cervix | CC | cell growth | 92/2311 | 482/18723 | 1.16e-05 | 2.49e-04 | 92 |
| GO:00301008 | Cervix | CC | regulation of endocytosis | 47/2311 | 211/18723 | 3.65e-05 | 5.82e-04 | 47 |
| GO:00458077 | Cervix | CC | positive regulation of endocytosis | 27/2311 | 100/18723 | 5.55e-05 | 8.10e-04 | 27 |
| GO:00459277 | Cervix | CC | positive regulation of growth | 53/2311 | 259/18723 | 1.33e-04 | 1.64e-03 | 53 |
| GO:00015588 | Cervix | CC | regulation of cell growth | 77/2311 | 414/18723 | 1.40e-04 | 1.70e-03 | 77 |
| GO:19023059 | Cervix | CC | regulation of sodium ion transmembrane transport | 19/2311 | 68/18723 | 4.21e-04 | 4.25e-03 | 19 |
| GO:00303077 | Cervix | CC | positive regulation of cell growth | 36/2311 | 166/18723 | 4.84e-04 | 4.75e-03 | 36 |
| GO:00300487 | Cervix | CC | actin filament-based movement | 29/2311 | 127/18723 | 6.91e-04 | 6.33e-03 | 29 |
| GO:00486386 | Cervix | CC | regulation of developmental growth | 61/2311 | 330/18723 | 7.69e-04 | 6.85e-03 | 61 |
| Page: 1 2 3 4 5 6 7 8 9 10 11 12 13 14 15 16 17 18 19 20 21 22 23 24 25 26 27 28 29 30 31 32 33 34 35 36 37 38 39 40 |
| Pathway ID | Tissue | Disease Stage | Description | Gene Ratio | Bg Ratio | pvalue | p.adjust | qvalue | Count |
| hsa0412014 | Cervix | CC | Ubiquitin mediated proteolysis | 49/1267 | 142/8465 | 4.26e-09 | 7.68e-08 | 4.54e-08 | 49 |
| hsa0453020 | Cervix | CC | Tight junction | 49/1267 | 169/8465 | 1.87e-06 | 1.78e-05 | 1.05e-05 | 49 |
| hsa0414418 | Cervix | CC | Endocytosis | 64/1267 | 251/8465 | 6.97e-06 | 6.10e-05 | 3.61e-05 | 64 |
| hsa0412015 | Cervix | CC | Ubiquitin mediated proteolysis | 49/1267 | 142/8465 | 4.26e-09 | 7.68e-08 | 4.54e-08 | 49 |
| hsa04530110 | Cervix | CC | Tight junction | 49/1267 | 169/8465 | 1.87e-06 | 1.78e-05 | 1.05e-05 | 49 |
| hsa0414419 | Cervix | CC | Endocytosis | 64/1267 | 251/8465 | 6.97e-06 | 6.10e-05 | 3.61e-05 | 64 |
| hsa04144 | Colorectum | AD | Endocytosis | 111/2092 | 251/8465 | 5.95e-12 | 1.42e-10 | 9.08e-11 | 111 |
| hsa04530 | Colorectum | AD | Tight junction | 76/2092 | 169/8465 | 5.49e-09 | 9.69e-08 | 6.18e-08 | 76 |
| hsa04120 | Colorectum | AD | Ubiquitin mediated proteolysis | 58/2092 | 142/8465 | 1.46e-05 | 1.53e-04 | 9.76e-05 | 58 |
| hsa041441 | Colorectum | AD | Endocytosis | 111/2092 | 251/8465 | 5.95e-12 | 1.42e-10 | 9.08e-11 | 111 |
| hsa045301 | Colorectum | AD | Tight junction | 76/2092 | 169/8465 | 5.49e-09 | 9.69e-08 | 6.18e-08 | 76 |
| hsa041201 | Colorectum | AD | Ubiquitin mediated proteolysis | 58/2092 | 142/8465 | 1.46e-05 | 1.53e-04 | 9.76e-05 | 58 |
| hsa041442 | Colorectum | SER | Endocytosis | 81/1580 | 251/8465 | 1.14e-07 | 2.36e-06 | 1.71e-06 | 81 |
| hsa045302 | Colorectum | SER | Tight junction | 59/1580 | 169/8465 | 3.24e-07 | 5.98e-06 | 4.34e-06 | 59 |
| hsa041202 | Colorectum | SER | Ubiquitin mediated proteolysis | 39/1580 | 142/8465 | 6.18e-03 | 3.66e-02 | 2.66e-02 | 39 |
| hsa041443 | Colorectum | SER | Endocytosis | 81/1580 | 251/8465 | 1.14e-07 | 2.36e-06 | 1.71e-06 | 81 |
| hsa045303 | Colorectum | SER | Tight junction | 59/1580 | 169/8465 | 3.24e-07 | 5.98e-06 | 4.34e-06 | 59 |
| hsa041203 | Colorectum | SER | Ubiquitin mediated proteolysis | 39/1580 | 142/8465 | 6.18e-03 | 3.66e-02 | 2.66e-02 | 39 |
| hsa041444 | Colorectum | MSS | Endocytosis | 102/1875 | 251/8465 | 1.85e-11 | 4.43e-10 | 2.71e-10 | 102 |
| hsa045304 | Colorectum | MSS | Tight junction | 66/1875 | 169/8465 | 4.10e-07 | 6.25e-06 | 3.83e-06 | 66 |
| Page: 1 2 3 4 5 6 7 |
Top |
Cell-cell communication analysis |
| Identification of potential cell-cell interactions between two cell types and their ligand-receptor pairs for different disease states |
| Ligand | Receptor | LRpair | Pathway | Tissue | Disease Stage |
| Page: 1 |
Top |
Single-cell gene regulatory network inference analysis |
| Find out the significant the regulons (TFs) and the target genes of each regulon across cell types for different disease states |
| TF | Cell Type | Tissue | Disease Stage | Target Gene | RSS | Regulon Activity |
| ∗The dot plots of a searched regulon are shown for all cell subpopulations in each disease state of each tissue based on the regulon specific score inferred using pySCENIC and by calculating the average expression. |
| Page: 1 |
Top |
Somatic mutation of malignant transformation related genes |
| Annotation of somatic variants for genes involved in malignant transformation |
| Hugo Symbol | Variant Class | Variant Classification | dbSNP RS | HGVSc | HGVSp | HGVSp Short | SWISSPROT | BIOTYPE | SIFT | PolyPhen | Tumor Sample Barcode | Tissue | Histology | Sex | Age | Stage | Therapy Types | Drugs | Outcome |
| NEDD4L | SNV | Missense_Mutation | c.1937C>A | p.Ala646Asp | p.A646D | Q96PU5 | protein_coding | deleterious(0) | probably_damaging(0.998) | TCGA-A2-A25E-01 | Breast | breast invasive carcinoma | Female | <65 | III/IV | Chemotherapy | cytoxan | PD | |
| NEDD4L | SNV | Missense_Mutation | c.2518A>G | p.Ile840Val | p.I840V | Q96PU5 | protein_coding | tolerated(0.09) | benign(0.127) | TCGA-A8-A094-01 | Breast | breast invasive carcinoma | Female | >=65 | I/II | Unknown | Unknown | SD | |
| NEDD4L | SNV | Missense_Mutation | c.2003T>A | p.Phe668Tyr | p.F668Y | Q96PU5 | protein_coding | deleterious(0) | probably_damaging(0.999) | TCGA-A8-A09K-01 | Breast | breast invasive carcinoma | Female | >=65 | I/II | Unknown | Unknown | SD | |
| NEDD4L | SNV | Missense_Mutation | c.2848N>G | p.Pro950Ala | p.P950A | Q96PU5 | protein_coding | deleterious(0.02) | benign(0.031) | TCGA-AN-A03Y-01 | Breast | breast invasive carcinoma | Female | >=65 | I/II | Unknown | Unknown | SD | |
| NEDD4L | SNV | Missense_Mutation | c.1402N>G | p.Arg468Gly | p.R468G | Q96PU5 | protein_coding | tolerated(0.1) | benign(0.048) | TCGA-BH-A0B9-01 | Breast | breast invasive carcinoma | Female | <65 | I/II | Chemotherapy | cyclophosphamide | SD | |
| NEDD4L | SNV | Missense_Mutation | c.229G>C | p.Glu77Gln | p.E77Q | Q96PU5 | protein_coding | deleterious(0) | probably_damaging(0.954) | TCGA-BH-A0HP-01 | Breast | breast invasive carcinoma | Female | >=65 | III/IV | Chemotherapy | doxorubicin | SD | |
| NEDD4L | SNV | Missense_Mutation | c.532G>C | p.Asp178His | p.D178H | Q96PU5 | protein_coding | deleterious(0) | possibly_damaging(0.897) | TCGA-C8-A1HF-01 | Breast | breast invasive carcinoma | Female | <65 | I/II | Unknown | Unknown | SD | |
| NEDD4L | SNV | Missense_Mutation | c.52N>C | p.Glu18Gln | p.E18Q | Q96PU5 | protein_coding | tolerated(0.33) | benign(0.269) | TCGA-C8-A1HM-01 | Breast | breast invasive carcinoma | Female | >=65 | I/II | Chemotherapy | doxorubicin | CR | |
| NEDD4L | SNV | Missense_Mutation | novel | c.2524N>C | p.Ile842Leu | p.I842L | Q96PU5 | protein_coding | tolerated(0.06) | benign(0.02) | TCGA-D8-A1XJ-01 | Breast | breast invasive carcinoma | Female | >=65 | III/IV | Hormone Therapy | tamoxiphen | SD |
| NEDD4L | SNV | Missense_Mutation | novel | c.2524N>G | p.Ile842Val | p.I842V | Q96PU5 | protein_coding | deleterious(0.02) | benign(0.038) | TCGA-WT-AB41-01 | Breast | breast invasive carcinoma | Female | <65 | I/II | Chemotherapy | taxotere | CR |
| Page: 1 2 3 4 5 6 7 8 9 10 11 12 |
Top |
Related drugs of malignant transformation related genes |
| Identification of chemicals and drugs interact with genes involved in malignant transfromation |
| (DGIdb 4.0) |
| Entrez ID | Symbol | Category | Interaction Types | Drug Claim Name | Drug Name | PMIDs |
| 23327 | NEDD4L | ENZYME | diuretics | 18591455,21052022 | ||
| 23327 | NEDD4L | ENZYME | citalopram | CITALOPRAM | 23809733 | |
| 23327 | NEDD4L | ENZYME | hydrochlorothiazide | HYDROCHLOROTHIAZIDE | 18591455,21052022,19635985 |
| Page: 1 |

Copyright 2023-Present -The University of Texas Health Science Center at Houston |