
|
|||||
|
 | |
| |
| |
| |
| |
| |
|
Gene: NEDD1 |
Gene summary for NEDD1 |
| Gene information | Species | Human | Gene symbol | NEDD1 | Gene ID | 121441 |
| Gene name | NEDD1 gamma-tubulin ring complex targeting factor | |
| Gene Alias | GCP-WD | |
| Cytomap | 12q23.1 | |
| Gene Type | protein-coding | GO ID | GO:0007049 | UniProtAcc | A8K1Z3 |
Top |
Malignant transformation analysis |
| Identification of the aberrant gene expression in precancerous and cancerous lesions by comparing the gene expression of stem-like cells in diseased tissues with normal stem cells |
| Entrez ID | Symbol | Replicates | Species | Organ | Tissue | Adj P-value | Log2FC | Malignancy |
| 121441 | NEDD1 | LZE4T | Human | Esophagus | ESCC | 8.13e-06 | 1.71e-01 | 0.0811 |
| 121441 | NEDD1 | LZE7T | Human | Esophagus | ESCC | 8.16e-04 | 2.69e-01 | 0.0667 |
| 121441 | NEDD1 | LZE8T | Human | Esophagus | ESCC | 2.59e-04 | 1.58e-01 | 0.067 |
| 121441 | NEDD1 | LZE24T | Human | Esophagus | ESCC | 7.08e-14 | 2.86e-01 | 0.0596 |
| 121441 | NEDD1 | LZE6T | Human | Esophagus | ESCC | 1.51e-06 | 2.65e-01 | 0.0845 |
| 121441 | NEDD1 | P1T-E | Human | Esophagus | ESCC | 9.95e-03 | 1.53e-01 | 0.0875 |
| 121441 | NEDD1 | P2T-E | Human | Esophagus | ESCC | 1.25e-40 | 7.68e-01 | 0.1177 |
| 121441 | NEDD1 | P4T-E | Human | Esophagus | ESCC | 5.04e-10 | 1.78e-01 | 0.1323 |
| 121441 | NEDD1 | P5T-E | Human | Esophagus | ESCC | 3.75e-10 | 1.56e-01 | 0.1327 |
| 121441 | NEDD1 | P8T-E | Human | Esophagus | ESCC | 1.64e-11 | 2.78e-01 | 0.0889 |
| 121441 | NEDD1 | P10T-E | Human | Esophagus | ESCC | 4.19e-16 | 2.37e-01 | 0.116 |
| 121441 | NEDD1 | P11T-E | Human | Esophagus | ESCC | 9.83e-10 | 3.58e-01 | 0.1426 |
| 121441 | NEDD1 | P12T-E | Human | Esophagus | ESCC | 7.05e-10 | 2.00e-01 | 0.1122 |
| 121441 | NEDD1 | P15T-E | Human | Esophagus | ESCC | 3.09e-14 | 2.37e-01 | 0.1149 |
| 121441 | NEDD1 | P16T-E | Human | Esophagus | ESCC | 2.18e-14 | 2.43e-01 | 0.1153 |
| 121441 | NEDD1 | P17T-E | Human | Esophagus | ESCC | 9.92e-06 | 2.38e-01 | 0.1278 |
| 121441 | NEDD1 | P19T-E | Human | Esophagus | ESCC | 1.60e-04 | 4.03e-01 | 0.1662 |
| 121441 | NEDD1 | P20T-E | Human | Esophagus | ESCC | 2.93e-09 | 2.59e-01 | 0.1124 |
| 121441 | NEDD1 | P21T-E | Human | Esophagus | ESCC | 1.11e-17 | 3.54e-01 | 0.1617 |
| 121441 | NEDD1 | P22T-E | Human | Esophagus | ESCC | 3.50e-16 | 2.37e-01 | 0.1236 |
| Page: 1 2 3 4 |
| Tissue | Expression Dynamics | Abbreviation |
| Esophagus |  | ESCC: Esophageal squamous cell carcinoma |
| HGIN: High-grade intraepithelial neoplasias | ||
| LGIN: Low-grade intraepithelial neoplasias | ||
| Oral Cavity | 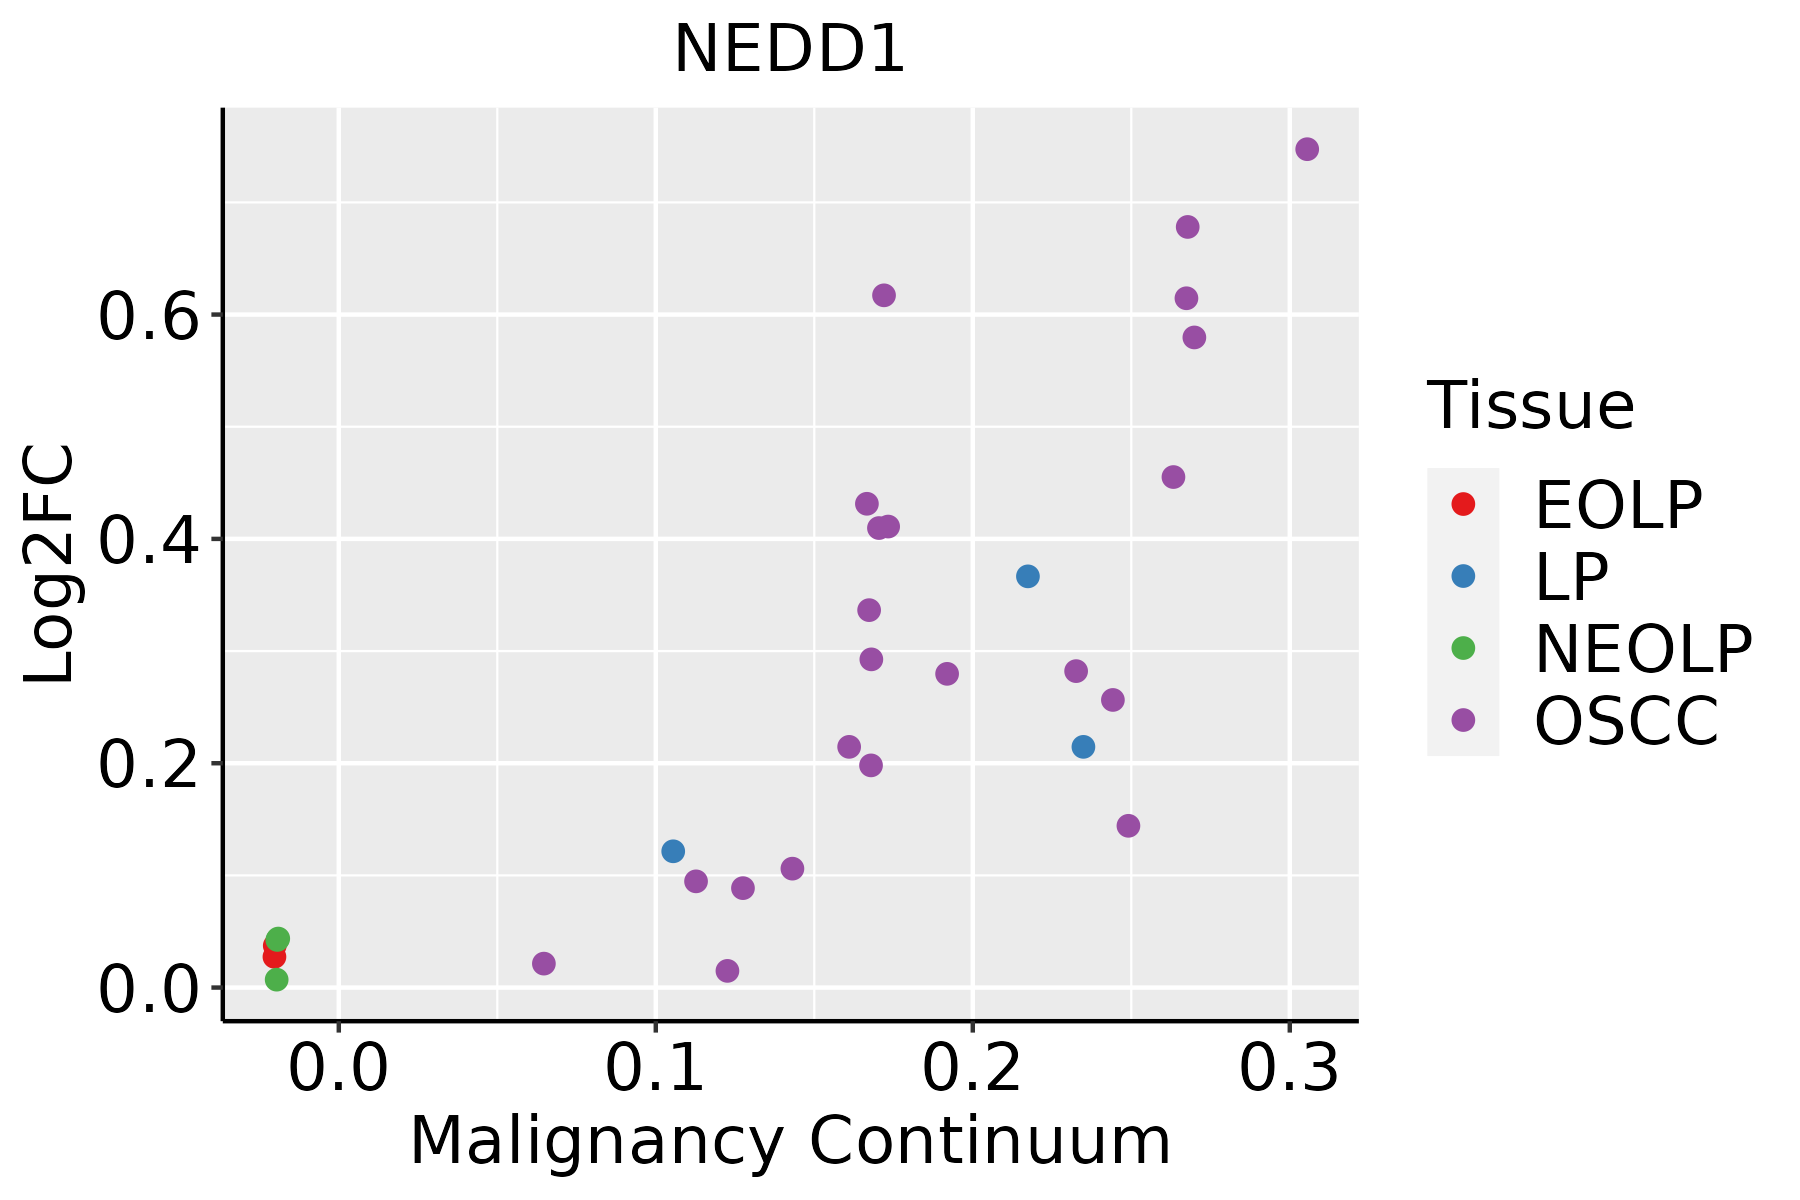 | EOLP: Erosive Oral lichen planus |
| LP: leukoplakia | ||
| NEOLP: Non-erosive oral lichen planus | ||
| OSCC: Oral squamous cell carcinoma | ||
| Skin |  | AK: Actinic keratosis |
| cSCC: Cutaneous squamous cell carcinoma | ||
| SCCIS:squamous cell carcinoma in situ |
| ∗log2FC in expression of this searched gene in stem-like cells from each diseased tissue sample relative to stem-like cells in normal samples in each tissue plotted against the malignancy continuum. Samples are colored based on if they are from different disease stage. |
Top |
Malignant transformation related pathway analysis |
| Find out the enriched GO biological processes and KEGG pathways involved in transition from healthy to precancer to cancer |
| Tissue | Disease Stage | Enriched GO biological Processes |
| Colorectum | AD |  |
| Colorectum | SER |  |
| Colorectum | MSS |  |
| Colorectum | MSI-H |  |
| Colorectum | FAP |  |
| ∗Top 15 enriched GO BP terms are showed in the bar plot of each disease state in each tissue. Each row represents a significant GO biological process which is colored according to the -log10(p.adjust). |
| Page: 1 2 3 4 5 6 7 8 9 |
| GO ID | Tissue | Disease Stage | Description | Gene Ratio | Bg Ratio | pvalue | p.adjust | Count |
| GO:00726985 | Esophagus | ESCC | protein localization to microtubule cytoskeleton | 43/8552 | 54/18723 | 3.28e-07 | 4.61e-06 | 43 |
| GO:00443804 | Esophagus | ESCC | protein localization to cytoskeleton | 45/8552 | 58/18723 | 6.89e-07 | 8.99e-06 | 45 |
| GO:19055086 | Esophagus | ESCC | protein localization to microtubule organizing center | 28/8552 | 35/18723 | 3.40e-05 | 2.78e-04 | 28 |
| GO:00715396 | Esophagus | ESCC | protein localization to centrosome | 26/8552 | 33/18723 | 1.06e-04 | 7.43e-04 | 26 |
| GO:00443803 | Oral cavity | OSCC | protein localization to cytoskeleton | 33/7305 | 58/18723 | 4.32e-03 | 1.75e-02 | 33 |
| GO:00726984 | Oral cavity | OSCC | protein localization to microtubule cytoskeleton | 30/7305 | 54/18723 | 9.99e-03 | 3.49e-02 | 30 |
| GO:00443805 | Skin | cSCC | protein localization to cytoskeleton | 26/4864 | 58/18723 | 1.44e-03 | 9.09e-03 | 26 |
| GO:00726986 | Skin | cSCC | protein localization to microtubule cytoskeleton | 24/4864 | 54/18723 | 2.49e-03 | 1.42e-02 | 24 |
| GO:19055087 | Skin | cSCC | protein localization to microtubule organizing center | 16/4864 | 35/18723 | 9.09e-03 | 4.16e-02 | 16 |
| Page: 1 |
| Pathway ID | Tissue | Disease Stage | Description | Gene Ratio | Bg Ratio | pvalue | p.adjust | qvalue | Count |
| Page: 1 |
Top |
Cell-cell communication analysis |
| Identification of potential cell-cell interactions between two cell types and their ligand-receptor pairs for different disease states |
| Ligand | Receptor | LRpair | Pathway | Tissue | Disease Stage |
| Page: 1 |
Top |
Single-cell gene regulatory network inference analysis |
| Find out the significant the regulons (TFs) and the target genes of each regulon across cell types for different disease states |
| TF | Cell Type | Tissue | Disease Stage | Target Gene | RSS | Regulon Activity |
| ∗The dot plots of a searched regulon are shown for all cell subpopulations in each disease state of each tissue based on the regulon specific score inferred using pySCENIC and by calculating the average expression. |
| Page: 1 |
Top |
Somatic mutation of malignant transformation related genes |
| Annotation of somatic variants for genes involved in malignant transformation |
| Hugo Symbol | Variant Class | Variant Classification | dbSNP RS | HGVSc | HGVSp | HGVSp Short | SWISSPROT | BIOTYPE | SIFT | PolyPhen | Tumor Sample Barcode | Tissue | Histology | Sex | Age | Stage | Therapy Types | Drugs | Outcome |
| NEDD1 | SNV | Missense_Mutation | c.632T>C | p.Val211Ala | p.V211A | Q8NHV4 | protein_coding | tolerated(1) | benign(0) | TCGA-AO-A128-01 | Breast | breast invasive carcinoma | Female | <65 | I/II | Chemotherapy | doxorubicin | SD | |
| NEDD1 | SNV | Missense_Mutation | c.1112N>A | p.Gly371Glu | p.G371E | Q8NHV4 | protein_coding | deleterious(0.04) | probably_damaging(0.987) | TCGA-BH-A0HF-01 | Breast | breast invasive carcinoma | Female | >=65 | I/II | Hormone Therapy | arimidex | SD | |
| NEDD1 | SNV | Missense_Mutation | novel | c.94N>A | p.Val32Met | p.V32M | Q8NHV4 | protein_coding | deleterious(0.01) | possibly_damaging(0.668) | TCGA-E2-A2P6-01 | Breast | breast invasive carcinoma | Female | >=65 | I/II | Hormone Therapy | anastrozole | SD |
| NEDD1 | insertion | In_Frame_Ins | novel | c.464_465insTGGATTTGAGAGGCAGCCTGGTATAGTGGAAGG | p.Val155_Thr156insGlyPheGluArgGlnProGlyIleValGluGly | p.V155_T156insGFERQPGIVEG | Q8NHV4 | protein_coding | TCGA-A8-A09C-01 | Breast | breast invasive carcinoma | Female | >=65 | I/II | Unknown | Unknown | SD | ||
| NEDD1 | SNV | Missense_Mutation | novel | c.812N>T | p.Ala271Val | p.A271V | Q8NHV4 | protein_coding | tolerated(0.55) | possibly_damaging(0.701) | TCGA-MY-A5BF-01 | Cervix | cervical & endocervical cancer | Female | >=65 | I/II | Chemotherapy | cisplatin | CR |
| NEDD1 | SNV | Missense_Mutation | novel | c.1231N>G | p.Ser411Gly | p.S411G | Q8NHV4 | protein_coding | deleterious(0.02) | benign(0.269) | TCGA-VS-A8EH-01 | Cervix | cervical & endocervical cancer | Female | <65 | III/IV | Chemotherapy | cisplatin | CR |
| NEDD1 | SNV | Missense_Mutation | novel | c.362N>T | p.Ser121Phe | p.S121F | Q8NHV4 | protein_coding | deleterious(0) | benign(0.009) | TCGA-VS-A9UZ-01 | Cervix | cervical & endocervical cancer | Female | <65 | I/II | Unknown | Unknown | SD |
| NEDD1 | insertion | In_Frame_Ins | novel | c.1874_1875insTTCAGCCGCTTTGAG | p.Met625delinsIleSerAlaAlaLeuArg | p.M625delinsISAALR | Q8NHV4 | protein_coding | TCGA-DS-A1OD-01 | Cervix | cervical & endocervical cancer | Female | <65 | I/II | Chemotherapy | cisplatin | SD | ||
| NEDD1 | SNV | Missense_Mutation | c.1766N>T | p.Ala589Val | p.A589V | Q8NHV4 | protein_coding | deleterious(0.02) | benign(0.027) | TCGA-A6-6653-01 | Colorectum | colon adenocarcinoma | Male | >=65 | I/II | Unknown | Unknown | SD | |
| NEDD1 | SNV | Missense_Mutation | c.52G>A | p.Gly18Arg | p.G18R | Q8NHV4 | protein_coding | deleterious(0.01) | benign(0.399) | TCGA-AA-3492-01 | Colorectum | colon adenocarcinoma | Female | >=65 | I/II | Unknown | Unknown | SD |
| Page: 1 2 3 4 5 6 7 8 |
Top |
Related drugs of malignant transformation related genes |
| Identification of chemicals and drugs interact with genes involved in malignant transfromation |
| (DGIdb 4.0) |
| Entrez ID | Symbol | Category | Interaction Types | Drug Claim Name | Drug Name | PMIDs |
| Page: 1 |

Copyright 2023-Present -The University of Texas Health Science Center at Houston |