
|
|||||
|
 | |
| |
| |
| |
| |
| |
|
Gene: NECTIN2 |
Gene summary for NECTIN2 |
| Gene information | Species | Human | Gene symbol | NECTIN2 | Gene ID | 5819 |
| Gene name | nectin cell adhesion molecule 2 | |
| Gene Alias | CD112 | |
| Cytomap | 19q13.32 | |
| Gene Type | protein-coding | GO ID | GO:0000003 | UniProtAcc | Q92692 |
Top |
Malignant transformation analysis |
| Identification of the aberrant gene expression in precancerous and cancerous lesions by comparing the gene expression of stem-like cells in diseased tissues with normal stem cells |
| Entrez ID | Symbol | Replicates | Species | Organ | Tissue | Adj P-value | Log2FC | Malignancy |
| 5819 | NECTIN2 | GSM4909281 | Human | Breast | IDC | 1.04e-05 | 3.05e-01 | 0.21 |
| 5819 | NECTIN2 | GSM4909293 | Human | Breast | IDC | 1.39e-03 | 1.71e-01 | 0.1581 |
| 5819 | NECTIN2 | GSM4909296 | Human | Breast | IDC | 2.72e-02 | -1.13e-01 | 0.1524 |
| 5819 | NECTIN2 | GSM4909297 | Human | Breast | IDC | 5.17e-05 | 7.62e-02 | 0.1517 |
| 5819 | NECTIN2 | GSM4909298 | Human | Breast | IDC | 1.60e-13 | 4.62e-01 | 0.1551 |
| 5819 | NECTIN2 | GSM4909300 | Human | Breast | IDC | 5.91e-03 | 3.74e-01 | 0.0334 |
| 5819 | NECTIN2 | GSM4909304 | Human | Breast | IDC | 4.20e-03 | 2.18e-01 | 0.1636 |
| 5819 | NECTIN2 | GSM4909305 | Human | Breast | IDC | 1.57e-05 | 3.35e-01 | 0.0436 |
| 5819 | NECTIN2 | GSM4909306 | Human | Breast | IDC | 2.27e-06 | 4.14e-01 | 0.1564 |
| 5819 | NECTIN2 | GSM4909308 | Human | Breast | IDC | 3.57e-02 | 2.00e-01 | 0.158 |
| 5819 | NECTIN2 | GSM4909311 | Human | Breast | IDC | 1.41e-08 | -1.35e-02 | 0.1534 |
| 5819 | NECTIN2 | GSM4909312 | Human | Breast | IDC | 4.33e-07 | 2.94e-01 | 0.1552 |
| 5819 | NECTIN2 | GSM4909317 | Human | Breast | IDC | 6.37e-13 | 4.46e-01 | 0.1355 |
| 5819 | NECTIN2 | GSM4909319 | Human | Breast | IDC | 8.21e-10 | -1.34e-01 | 0.1563 |
| 5819 | NECTIN2 | GSM4909321 | Human | Breast | IDC | 7.14e-06 | 1.92e-01 | 0.1559 |
| 5819 | NECTIN2 | ctrl6 | Human | Breast | Precancer | 1.89e-15 | 6.43e-01 | -0.0061 |
| 5819 | NECTIN2 | brca1 | Human | Breast | Precancer | 1.75e-09 | -2.21e-01 | -0.0338 |
| 5819 | NECTIN2 | brca2 | Human | Breast | Precancer | 1.78e-08 | -2.21e-01 | -0.024 |
| 5819 | NECTIN2 | brca3 | Human | Breast | Precancer | 8.30e-08 | -2.21e-01 | -0.0263 |
| 5819 | NECTIN2 | brca10 | Human | Breast | Precancer | 4.00e-15 | 5.36e-01 | -0.0029 |
| Page: 1 2 3 4 5 6 7 8 |
| Tissue | Expression Dynamics | Abbreviation |
| Breast | 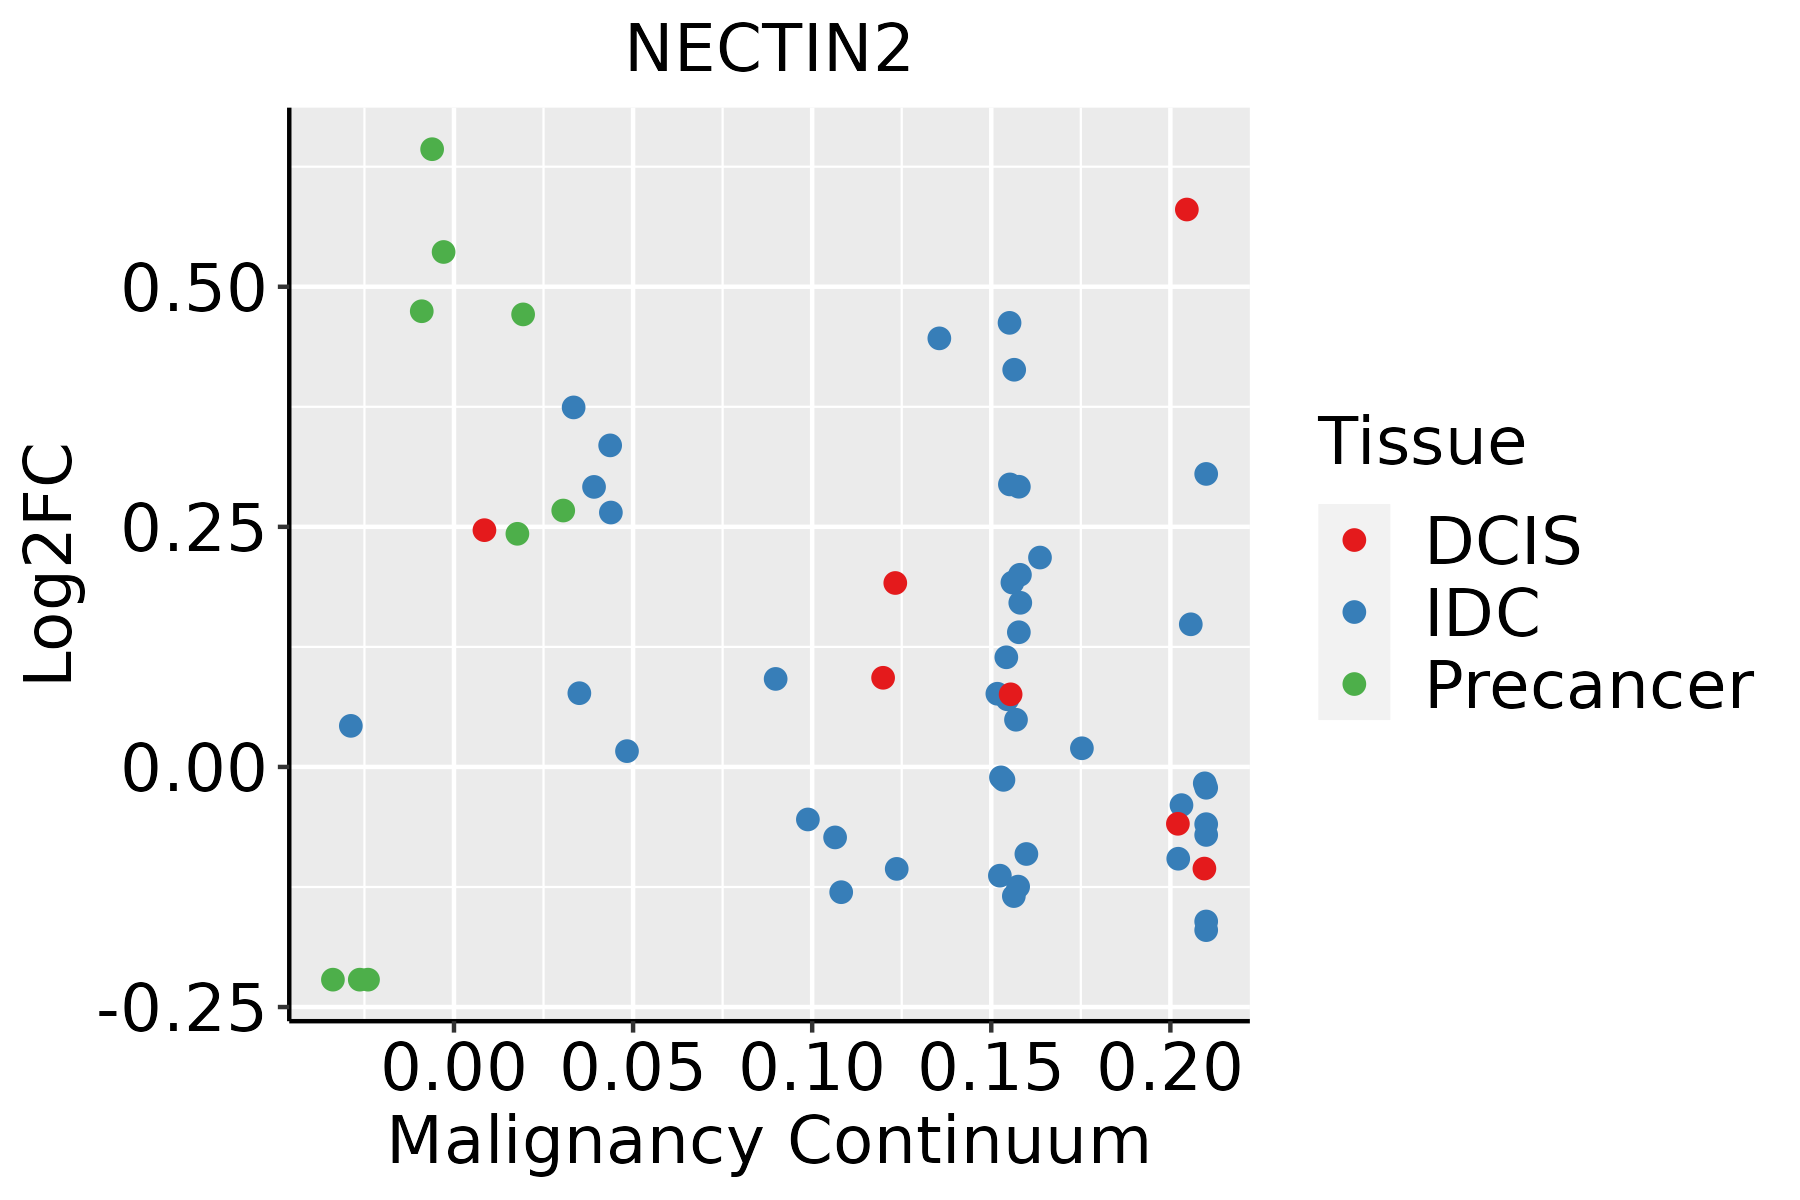 | IDC: Invasive ductal carcinoma |
| DCIS: Ductal carcinoma in situ | ||
| Precancer(BRCA1-mut): Precancerous lesion from BRCA1 mutation carriers | ||
| Colorectum (GSE201348) |  | FAP: Familial adenomatous polyposis |
| CRC: Colorectal cancer | ||
| Colorectum (HTA11) |  | AD: Adenomas |
| SER: Sessile serrated lesions | ||
| MSI-H: Microsatellite-high colorectal cancer | ||
| MSS: Microsatellite stable colorectal cancer | ||
| Endometrium | 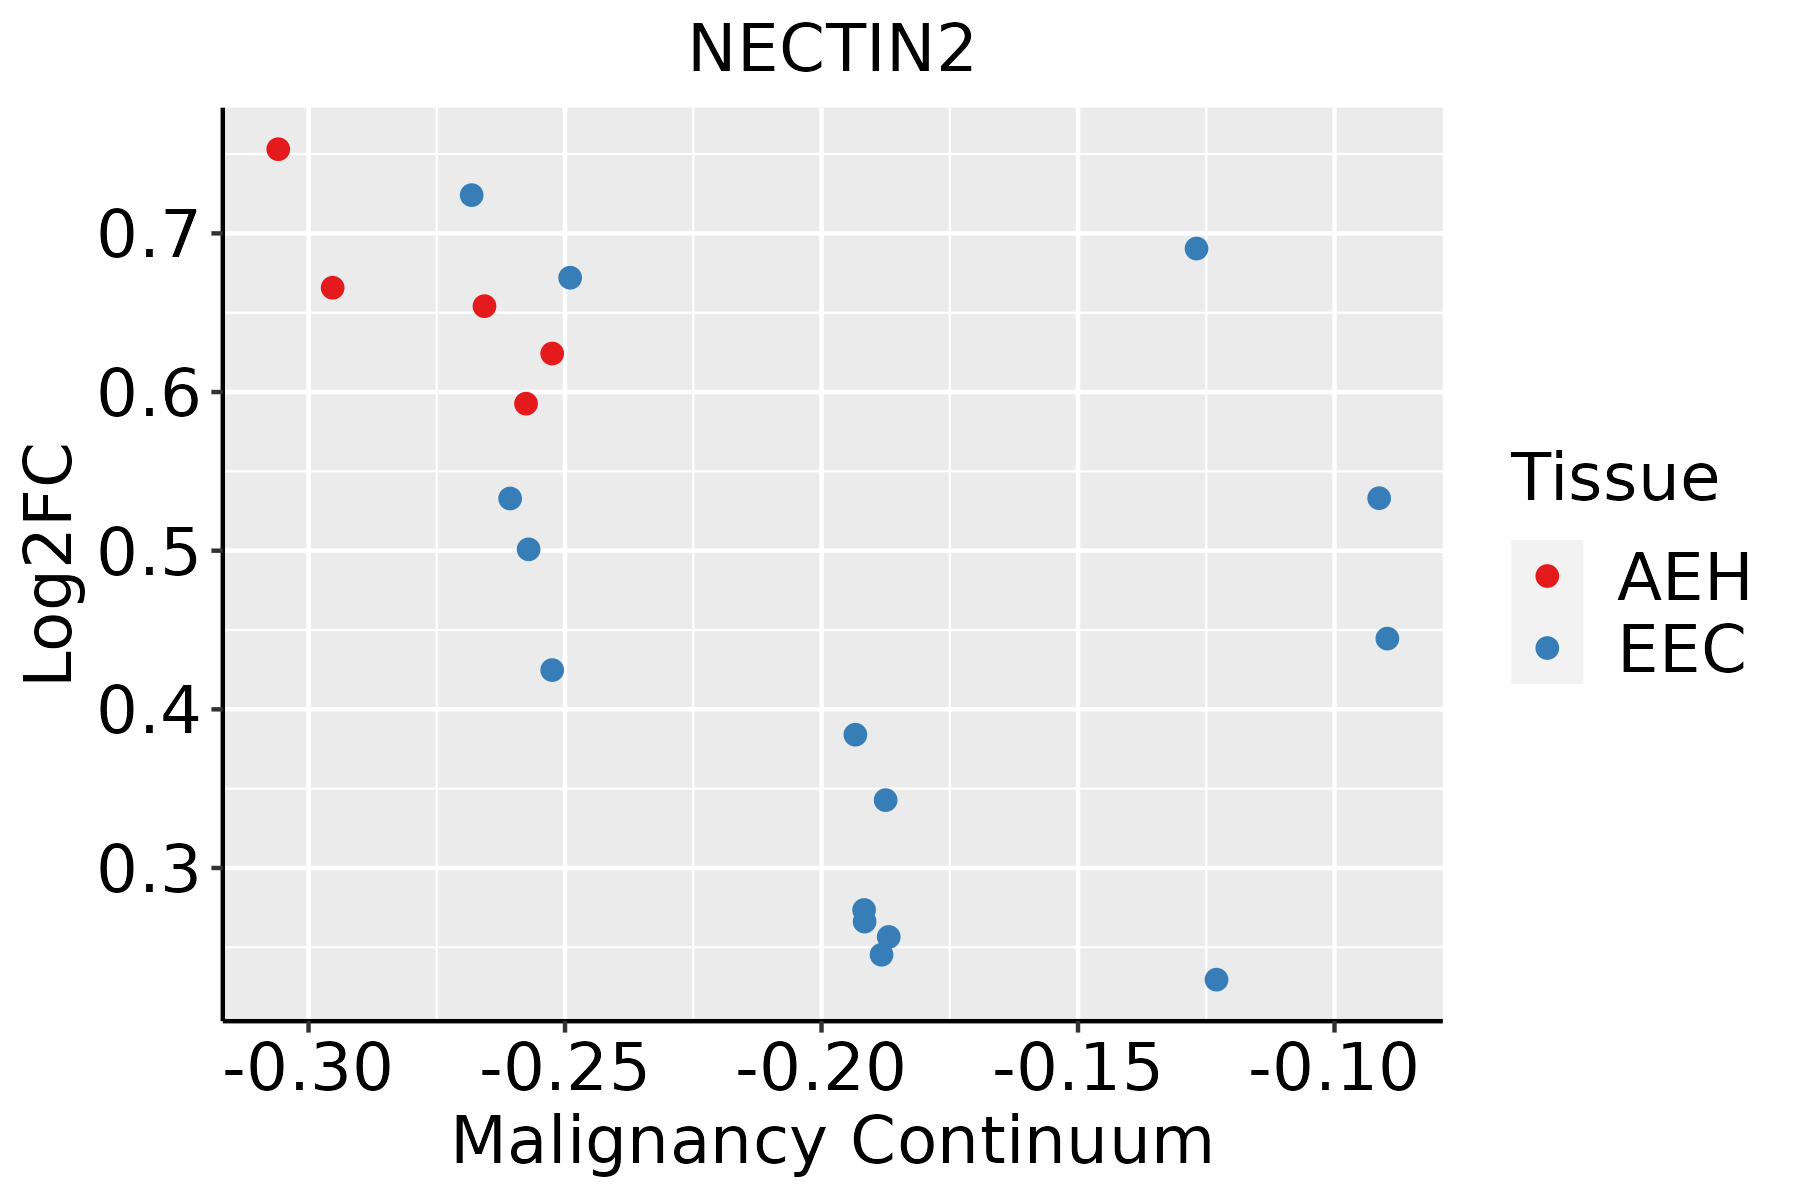 | AEH: Atypical endometrial hyperplasia |
| EEC: Endometrioid Cancer | ||
| Esophagus | 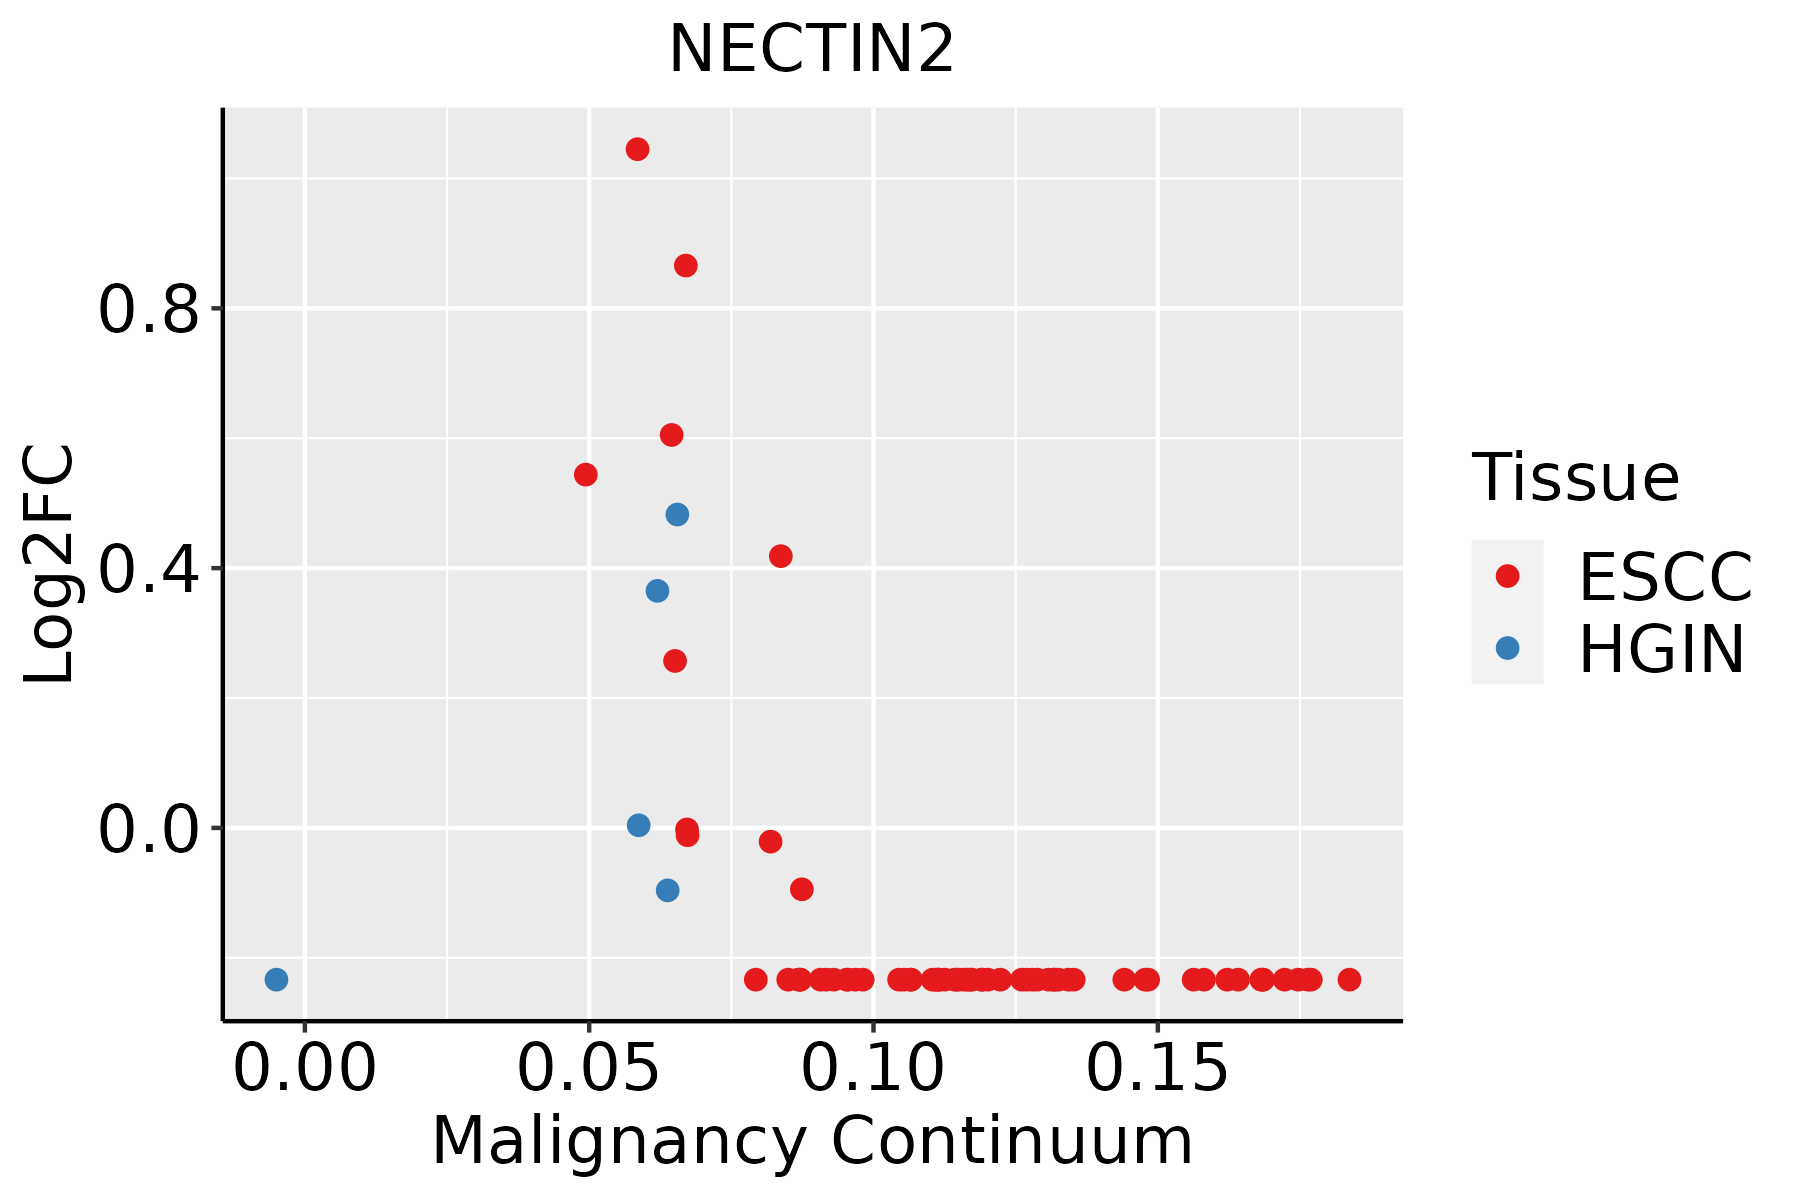 | ESCC: Esophageal squamous cell carcinoma |
| HGIN: High-grade intraepithelial neoplasias | ||
| LGIN: Low-grade intraepithelial neoplasias | ||
| Liver |  | HCC: Hepatocellular carcinoma |
| NAFLD: Non-alcoholic fatty liver disease | ||
| Lung |  | AAH: Atypical adenomatous hyperplasia |
| AIS: Adenocarcinoma in situ | ||
| IAC: Invasive lung adenocarcinoma | ||
| MIA: Minimally invasive adenocarcinoma | ||
| Prostate | 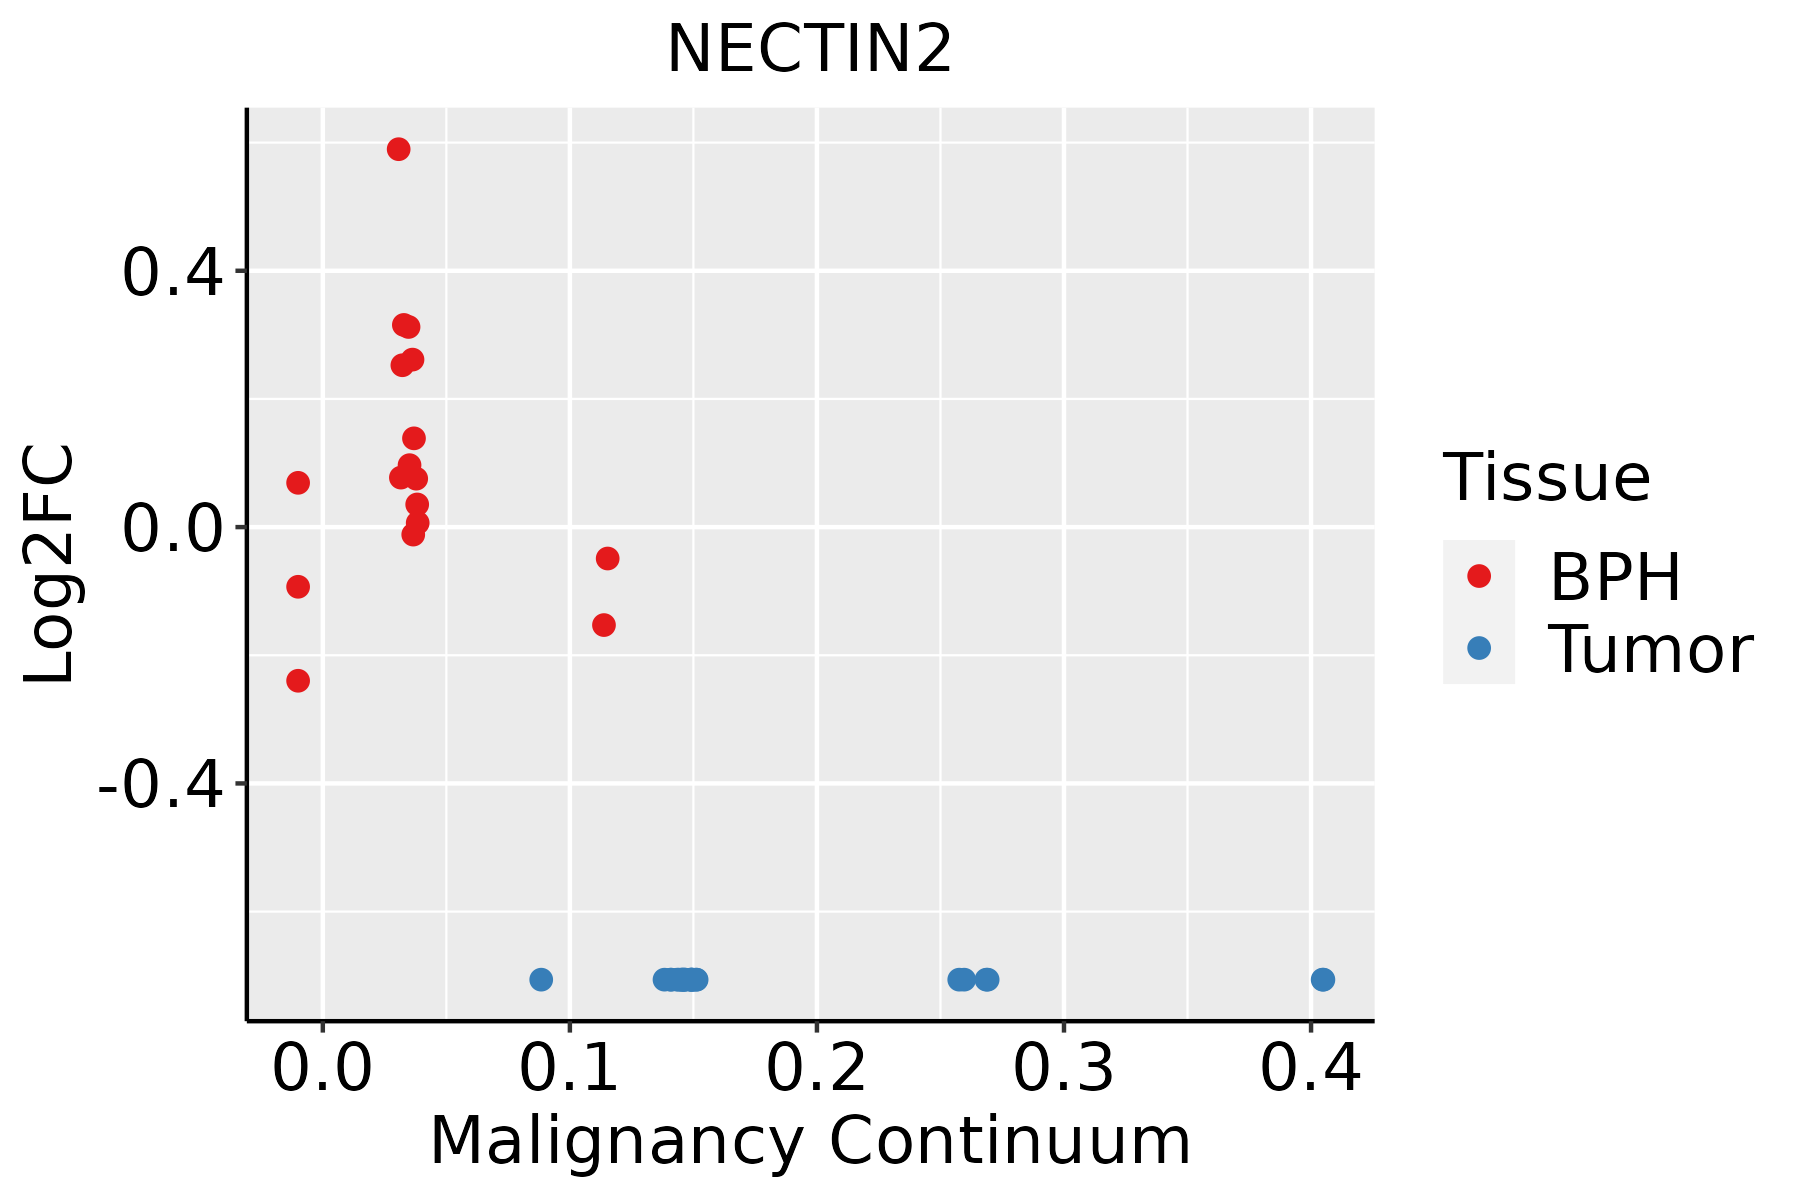 | BPH: Benign Prostatic Hyperplasia |
| Skin | 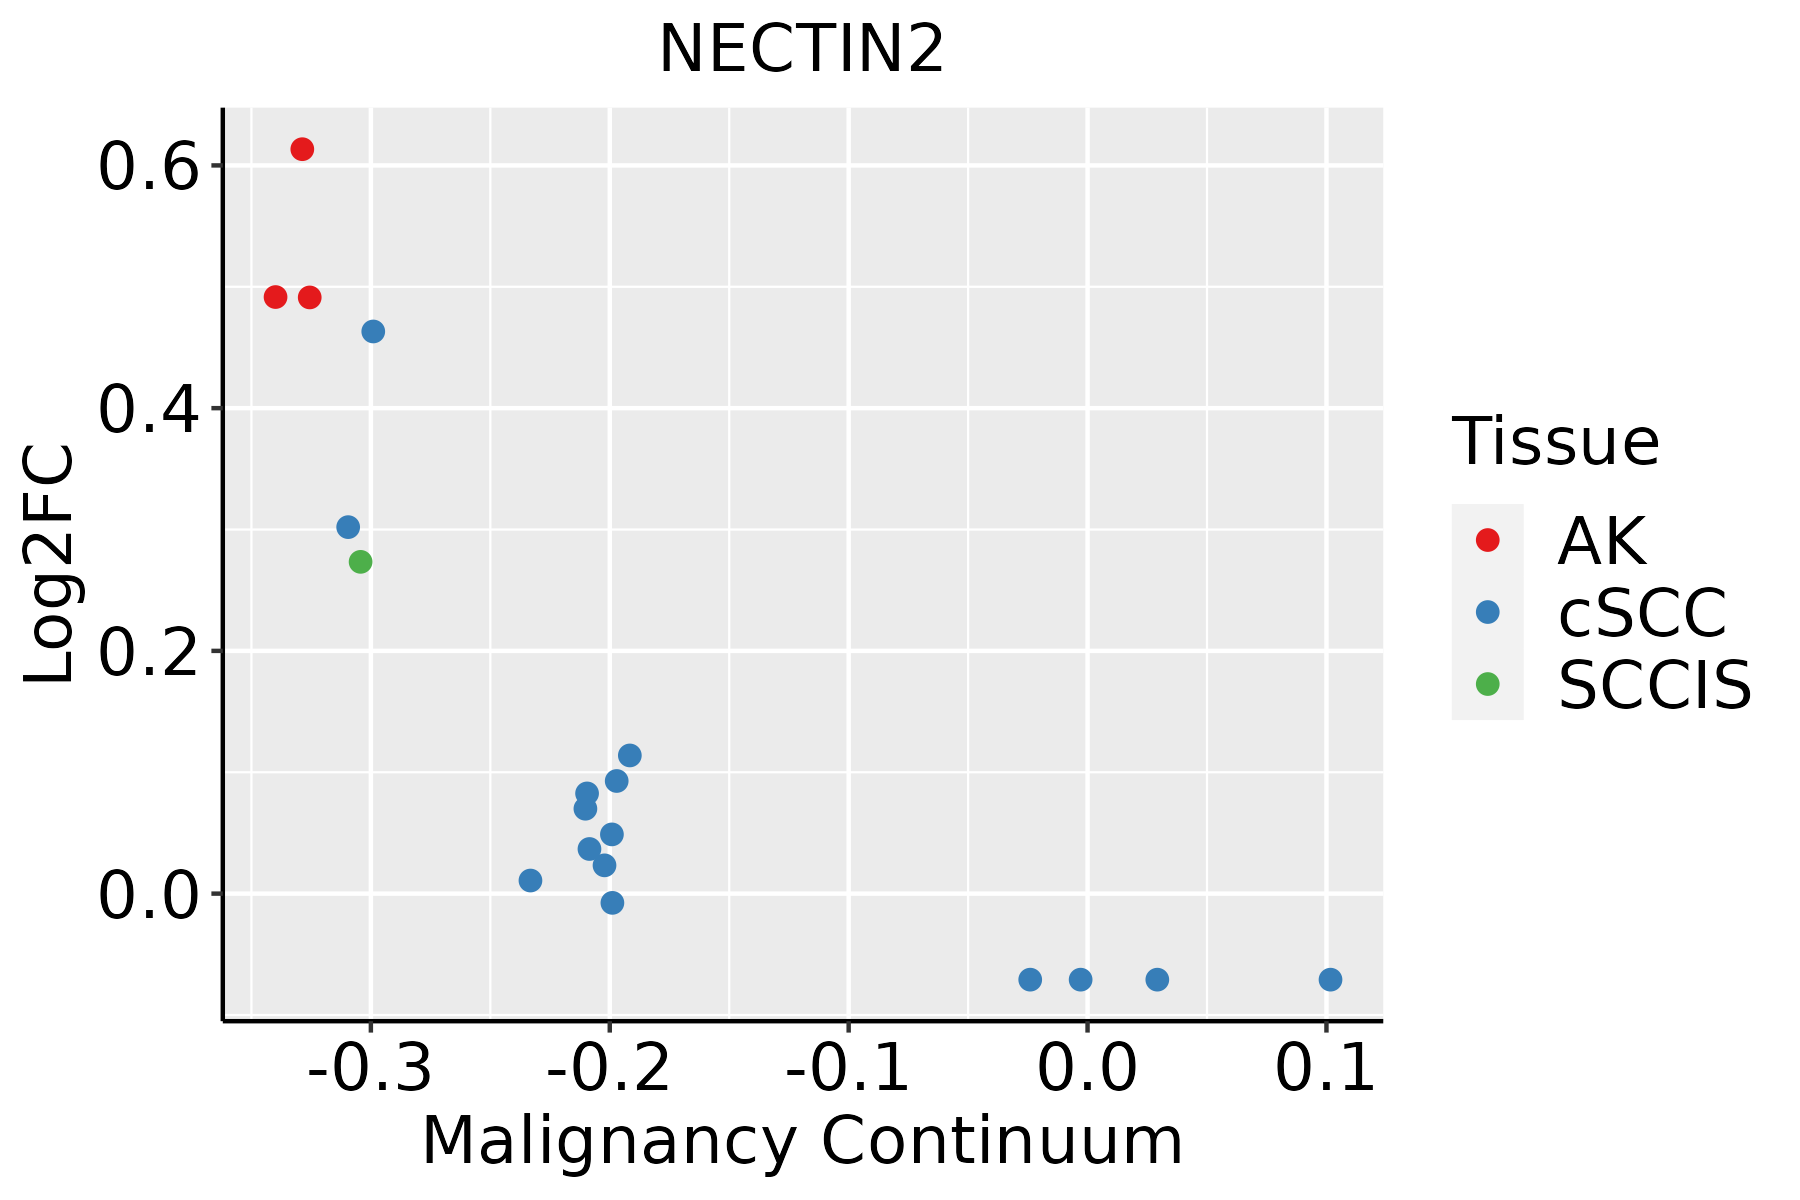 | AK: Actinic keratosis |
| cSCC: Cutaneous squamous cell carcinoma | ||
| SCCIS:squamous cell carcinoma in situ | ||
| Thyroid | 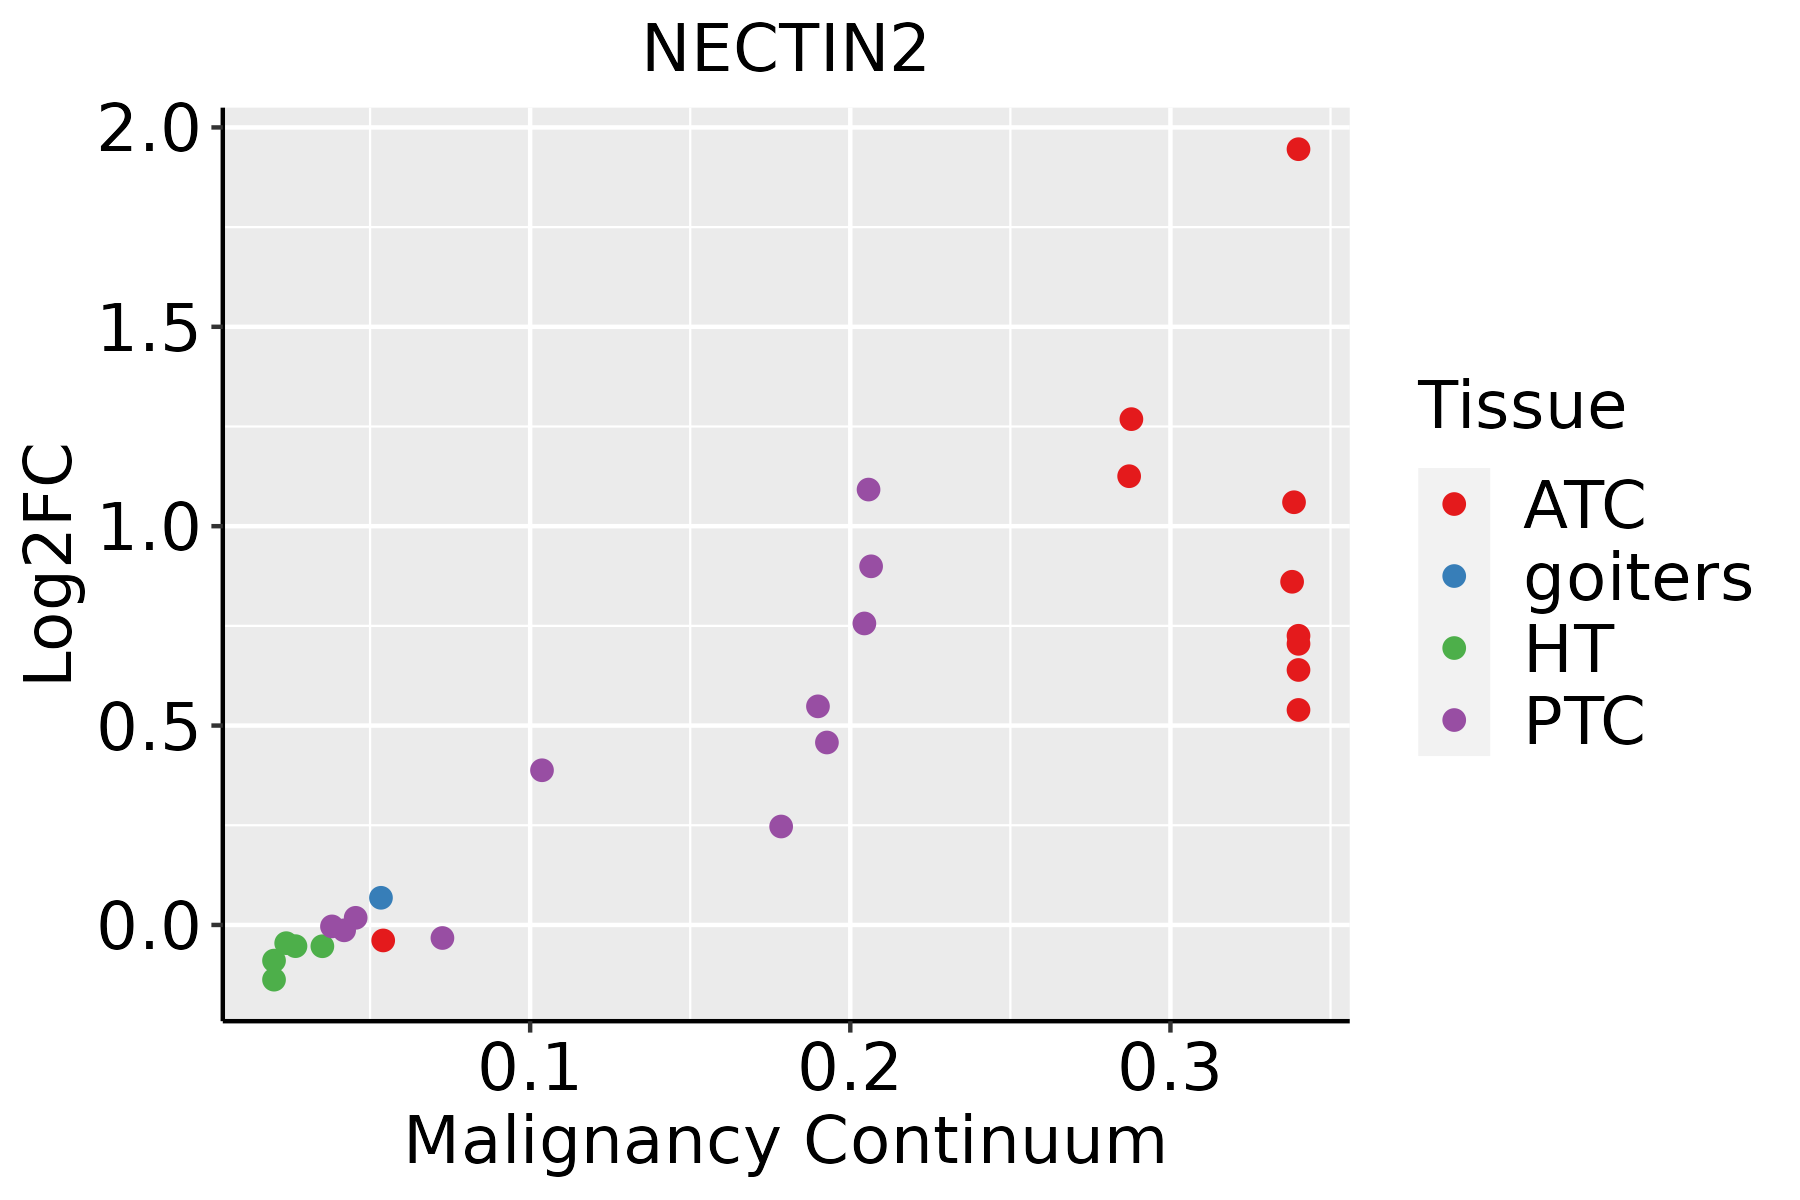 | ATC: Anaplastic thyroid cancer |
| HT: Hashimoto's thyroiditis | ||
| PTC: Papillary thyroid cancer |
| ∗log2FC in expression of this searched gene in stem-like cells from each diseased tissue sample relative to stem-like cells in normal samples in each tissue plotted against the malignancy continuum. Samples are colored based on if they are from different disease stage. |
Top |
Malignant transformation related pathway analysis |
| Find out the enriched GO biological processes and KEGG pathways involved in transition from healthy to precancer to cancer |
| Tissue | Disease Stage | Enriched GO biological Processes |
| Colorectum | AD |  |
| Colorectum | SER |  |
| Colorectum | MSS |  |
| Colorectum | MSI-H |  |
| Colorectum | FAP |  |
| ∗Top 15 enriched GO BP terms are showed in the bar plot of each disease state in each tissue. Each row represents a significant GO biological process which is colored according to the -log10(p.adjust). |
| Page: 1 2 3 4 5 6 7 8 9 |
| GO ID | Tissue | Disease Stage | Description | Gene Ratio | Bg Ratio | pvalue | p.adjust | Count |
| GO:00160329 | Breast | Precancer | viral process | 58/1080 | 415/18723 | 3.42e-10 | 3.16e-08 | 58 |
| GO:00190589 | Breast | Precancer | viral life cycle | 47/1080 | 317/18723 | 2.42e-09 | 1.99e-07 | 47 |
| GO:00444039 | Breast | Precancer | biological process involved in symbiotic interaction | 42/1080 | 290/18723 | 3.40e-08 | 2.11e-06 | 42 |
| GO:00521269 | Breast | Precancer | movement in host environment | 29/1080 | 175/18723 | 2.59e-07 | 1.28e-05 | 29 |
| GO:00517019 | Breast | Precancer | biological process involved in interaction with host | 31/1080 | 203/18723 | 6.52e-07 | 2.71e-05 | 31 |
| GO:00507929 | Breast | Precancer | regulation of viral process | 27/1080 | 164/18723 | 7.59e-07 | 3.05e-05 | 27 |
| GO:00444099 | Breast | Precancer | entry into host | 25/1080 | 151/18723 | 1.74e-06 | 6.19e-05 | 25 |
| GO:00467189 | Breast | Precancer | viral entry into host cell | 24/1080 | 144/18723 | 2.46e-06 | 8.35e-05 | 24 |
| GO:00439039 | Breast | Precancer | regulation of biological process involved in symbiotic interaction | 15/1080 | 72/18723 | 1.23e-05 | 3.17e-04 | 15 |
| GO:19039009 | Breast | Precancer | regulation of viral life cycle | 23/1080 | 148/18723 | 1.31e-05 | 3.30e-04 | 23 |
| GO:00523727 | Breast | Precancer | modulation by symbiont of entry into host | 12/1080 | 49/18723 | 1.61e-05 | 3.93e-04 | 12 |
| GO:00465964 | Breast | Precancer | regulation of viral entry into host cell | 11/1080 | 42/18723 | 1.83e-05 | 4.35e-04 | 11 |
| GO:00321034 | Breast | Precancer | positive regulation of response to external stimulus | 46/1080 | 427/18723 | 3.41e-05 | 7.40e-04 | 46 |
| GO:00027117 | Breast | Precancer | positive regulation of T cell mediated immunity | 12/1080 | 56/18723 | 6.72e-05 | 1.35e-03 | 12 |
| GO:00313493 | Breast | Precancer | positive regulation of defense response | 33/1080 | 278/18723 | 6.79e-05 | 1.36e-03 | 33 |
| GO:00019168 | Breast | Precancer | positive regulation of T cell mediated cytotoxicity | 8/1080 | 29/18723 | 1.73e-04 | 2.83e-03 | 8 |
| GO:00027094 | Breast | Precancer | regulation of T cell mediated immunity | 13/1080 | 85/18723 | 1.12e-03 | 1.23e-02 | 13 |
| GO:00019146 | Breast | Precancer | regulation of T cell mediated cytotoxicity | 8/1080 | 39/18723 | 1.48e-03 | 1.53e-02 | 8 |
| GO:00019134 | Breast | Precancer | T cell mediated cytotoxicity | 9/1080 | 49/18723 | 1.74e-03 | 1.74e-02 | 9 |
| GO:00024563 | Breast | Precancer | T cell mediated immunity | 14/1080 | 109/18723 | 3.97e-03 | 3.15e-02 | 14 |
| Page: 1 2 3 4 5 6 7 8 9 10 11 12 13 14 15 16 17 18 19 |
| Pathway ID | Tissue | Disease Stage | Description | Gene Ratio | Bg Ratio | pvalue | p.adjust | qvalue | Count |
| hsa0452018 | Breast | Precancer | Adherens junction | 17/684 | 93/8465 | 1.11e-03 | 7.57e-03 | 5.80e-03 | 17 |
| hsa0452019 | Breast | Precancer | Adherens junction | 17/684 | 93/8465 | 1.11e-03 | 7.57e-03 | 5.80e-03 | 17 |
| hsa0452024 | Breast | DCIS | Adherens junction | 17/846 | 93/8465 | 9.95e-03 | 4.40e-02 | 3.24e-02 | 17 |
| hsa0452034 | Breast | DCIS | Adherens junction | 17/846 | 93/8465 | 9.95e-03 | 4.40e-02 | 3.24e-02 | 17 |
| hsa045202 | Colorectum | SER | Adherens junction | 37/1580 | 93/8465 | 1.54e-06 | 2.35e-05 | 1.71e-05 | 37 |
| hsa045203 | Colorectum | SER | Adherens junction | 37/1580 | 93/8465 | 1.54e-06 | 2.35e-05 | 1.71e-05 | 37 |
| hsa045208 | Colorectum | FAP | Adherens junction | 45/1404 | 93/8465 | 8.66e-13 | 2.89e-10 | 1.76e-10 | 45 |
| hsa045209 | Colorectum | FAP | Adherens junction | 45/1404 | 93/8465 | 8.66e-13 | 2.89e-10 | 1.76e-10 | 45 |
| hsa0452025 | Endometrium | AEH | Adherens junction | 36/1197 | 93/8465 | 3.49e-09 | 5.98e-08 | 4.37e-08 | 36 |
| hsa04520111 | Endometrium | AEH | Adherens junction | 36/1197 | 93/8465 | 3.49e-09 | 5.98e-08 | 4.37e-08 | 36 |
| hsa0452026 | Endometrium | EEC | Adherens junction | 36/1237 | 93/8465 | 8.57e-09 | 1.48e-07 | 1.11e-07 | 36 |
| hsa0452035 | Endometrium | EEC | Adherens junction | 36/1237 | 93/8465 | 8.57e-09 | 1.48e-07 | 1.11e-07 | 36 |
| hsa0452030 | Esophagus | ESCC | Adherens junction | 69/4205 | 93/8465 | 1.08e-06 | 6.83e-06 | 3.50e-06 | 69 |
| hsa04520114 | Esophagus | ESCC | Adherens junction | 69/4205 | 93/8465 | 1.08e-06 | 6.83e-06 | 3.50e-06 | 69 |
| hsa0452014 | Liver | NAFLD | Adherens junction | 37/1043 | 93/8465 | 1.50e-11 | 1.64e-09 | 1.32e-09 | 37 |
| hsa0452015 | Liver | NAFLD | Adherens junction | 37/1043 | 93/8465 | 1.50e-11 | 1.64e-09 | 1.32e-09 | 37 |
| hsa0452022 | Liver | Cirrhotic | Adherens junction | 52/2530 | 93/8465 | 1.36e-07 | 1.97e-06 | 1.21e-06 | 52 |
| hsa0452032 | Liver | Cirrhotic | Adherens junction | 52/2530 | 93/8465 | 1.36e-07 | 1.97e-06 | 1.21e-06 | 52 |
| hsa0452042 | Liver | HCC | Adherens junction | 68/4020 | 93/8465 | 3.99e-07 | 4.46e-06 | 2.48e-06 | 68 |
| hsa0452052 | Liver | HCC | Adherens junction | 68/4020 | 93/8465 | 3.99e-07 | 4.46e-06 | 2.48e-06 | 68 |
| Page: 1 2 |
Top |
Cell-cell communication analysis |
| Identification of potential cell-cell interactions between two cell types and their ligand-receptor pairs for different disease states |
| Ligand | Receptor | LRpair | Pathway | Tissue | Disease Stage |
| NECTIN2 | CD226 | NECTIN2_CD226 | NECTIN | Breast | ADJ |
| NECTIN2 | TIGIT | NECTIN2_TIGIT | NECTIN | Breast | ADJ |
| TIGIT | NECTIN2 | TIGIT_NECTIN2 | TIGIT | Breast | ADJ |
| CD226 | NECTIN2 | CD226_NECTIN2 | CD226 | Breast | ADJ |
| NECTIN2 | CD226 | NECTIN2_CD226 | NECTIN | Breast | DCIS |
| NECTIN2 | TIGIT | NECTIN2_TIGIT | NECTIN | Breast | DCIS |
| TIGIT | NECTIN2 | TIGIT_NECTIN2 | TIGIT | Breast | DCIS |
| CD226 | NECTIN2 | CD226_NECTIN2 | CD226 | Breast | DCIS |
| TIGIT | NECTIN2 | TIGIT_NECTIN2 | TIGIT | Breast | Healthy |
| NECTIN2 | TIGIT | NECTIN2_TIGIT | NECTIN | Breast | Healthy |
| NECTIN2 | TIGIT | NECTIN2_TIGIT | NECTIN | Breast | Precancer |
| TIGIT | NECTIN2 | TIGIT_NECTIN2 | TIGIT | Breast | Precancer |
| NECTIN2 | CD226 | NECTIN2_CD226 | NECTIN | Cervix | ADJ |
| NECTIN2 | TIGIT | NECTIN2_TIGIT | NECTIN | Cervix | ADJ |
| TIGIT | NECTIN2 | TIGIT_NECTIN2 | TIGIT | Cervix | ADJ |
| CD226 | NECTIN2 | CD226_NECTIN2 | CD226 | Cervix | ADJ |
| NECTIN3 | NECTIN2 | NECTIN3_NECTIN2 | NECTIN | Cervix | CC |
| NECTIN2 | CD226 | NECTIN2_CD226 | NECTIN | Cervix | CC |
| NECTIN2 | TIGIT | NECTIN2_TIGIT | NECTIN | Cervix | CC |
| TIGIT | NECTIN2 | TIGIT_NECTIN2 | TIGIT | Cervix | CC |
| Page: 1 2 3 |
Top |
Single-cell gene regulatory network inference analysis |
| Find out the significant the regulons (TFs) and the target genes of each regulon across cell types for different disease states |
| TF | Cell Type | Tissue | Disease Stage | Target Gene | RSS | Regulon Activity |
| ∗The dot plots of a searched regulon are shown for all cell subpopulations in each disease state of each tissue based on the regulon specific score inferred using pySCENIC and by calculating the average expression. |
| Page: 1 |
Top |
Somatic mutation of malignant transformation related genes |
| Annotation of somatic variants for genes involved in malignant transformation |
| Hugo Symbol | Variant Class | Variant Classification | dbSNP RS | HGVSc | HGVSp | HGVSp Short | SWISSPROT | BIOTYPE | SIFT | PolyPhen | Tumor Sample Barcode | Tissue | Histology | Sex | Age | Stage | Therapy Types | Drugs | Outcome |
| NECTIN2 | SNV | Missense_Mutation | rs533933961 | c.1330N>A | p.Ala444Thr | p.A444T | Q92692 | protein_coding | tolerated(0.31) | benign(0) | TCGA-A8-A07L-01 | Breast | breast invasive carcinoma | Female | <65 | III/IV | Chemotherapy | CR | |
| NECTIN2 | SNV | Missense_Mutation | c.584C>T | p.Ser195Phe | p.S195F | Q92692 | protein_coding | deleterious(0.02) | probably_damaging(0.951) | TCGA-AC-A5XS-01 | Breast | breast invasive carcinoma | Female | >=65 | I/II | Hormone Therapy | femara | SD | |
| NECTIN2 | SNV | Missense_Mutation | c.136N>G | p.Leu46Val | p.L46V | Q92692 | protein_coding | tolerated(0.08) | probably_damaging(0.928) | TCGA-AO-A0J6-01 | Breast | breast invasive carcinoma | Female | <65 | I/II | Chemotherapy | doxorubicin | SD | |
| NECTIN2 | SNV | Missense_Mutation | c.909N>A | p.Phe303Leu | p.F303L | Q92692 | protein_coding | tolerated(1) | benign(0.001) | TCGA-D8-A1JA-01 | Breast | breast invasive carcinoma | Female | <65 | III/IV | Chemotherapy | adriamycin | PD | |
| NECTIN2 | SNV | Missense_Mutation | rs752088661 | c.853N>A | p.Val285Ile | p.V285I | Q92692 | protein_coding | tolerated(0.1) | benign(0.149) | TCGA-2W-A8YY-01 | Cervix | cervical & endocervical cancer | Female | <65 | I/II | Chemotherapy | cisplatin | CR |
| NECTIN2 | SNV | Missense_Mutation | rs138153191 | c.736N>A | p.Glu246Lys | p.E246K | Q92692 | protein_coding | tolerated(0.38) | benign(0.014) | TCGA-EK-A2RJ-01 | Cervix | cervical & endocervical cancer | Female | <65 | I/II | Unknown | Unknown | SD |
| NECTIN2 | SNV | Missense_Mutation | rs768454344 | c.772C>T | p.Arg258Cys | p.R258C | Q92692 | protein_coding | tolerated(0.16) | possibly_damaging(0.872) | TCGA-AA-3672-01 | Colorectum | colon adenocarcinoma | Female | >=65 | III/IV | Unknown | Unknown | SD |
| NECTIN2 | SNV | Missense_Mutation | novel | c.1583N>G | p.Lys528Arg | p.K528R | Q92692 | protein_coding | deleterious(0.02) | benign(0.283) | TCGA-AD-6964-01 | Colorectum | colon adenocarcinoma | Male | <65 | III/IV | Chemotherapy | folfox | PD |
| NECTIN2 | SNV | Missense_Mutation | rs373335144 | c.148N>A | p.Val50Met | p.V50M | Q92692 | protein_coding | deleterious(0) | probably_damaging(0.977) | TCGA-AZ-4313-01 | Colorectum | colon adenocarcinoma | Female | <65 | I/II | Unknown | Unknown | SD |
| NECTIN2 | SNV | Missense_Mutation | rs773746451 | c.665N>A | p.Arg222His | p.R222H | Q92692 | protein_coding | tolerated(0.54) | benign(0.121) | TCGA-WS-AB45-01 | Colorectum | colon adenocarcinoma | Female | <65 | I/II | Unknown | Unknown | SD |
| Page: 1 2 3 4 5 6 |
Top |
Related drugs of malignant transformation related genes |
| Identification of chemicals and drugs interact with genes involved in malignant transfromation |
| (DGIdb 4.0) |
| Entrez ID | Symbol | Category | Interaction Types | Drug Claim Name | Drug Name | PMIDs |
| Page: 1 |

Copyright 2023-Present -The University of Texas Health Science Center at Houston |