
|
|||||
|
 | |
| |
| |
| |
| |
| |
|
Gene: NECTIN1 |
Gene summary for NECTIN1 |
| Gene information | Species | Human | Gene symbol | NECTIN1 | Gene ID | 5818 |
| Gene name | nectin cell adhesion molecule 1 | |
| Gene Alias | CD111 | |
| Cytomap | 11q23.3 | |
| Gene Type | protein-coding | GO ID | GO:0000041 | UniProtAcc | Q15223 |
Top |
Malignant transformation analysis |
| Identification of the aberrant gene expression in precancerous and cancerous lesions by comparing the gene expression of stem-like cells in diseased tissues with normal stem cells |
| Entrez ID | Symbol | Replicates | Species | Organ | Tissue | Adj P-value | Log2FC | Malignancy |
| 5818 | NECTIN1 | CCI_1 | Human | Cervix | CC | 1.00e-08 | 9.48e-01 | 0.528 |
| 5818 | NECTIN1 | CCI_2 | Human | Cervix | CC | 2.66e-02 | 6.27e-01 | 0.5249 |
| 5818 | NECTIN1 | Tumor | Human | Cervix | CC | 4.00e-05 | -1.71e-01 | 0.1241 |
| 5818 | NECTIN1 | sample3 | Human | Cervix | CC | 3.40e-30 | 5.67e-01 | 0.1387 |
| 5818 | NECTIN1 | L1 | Human | Cervix | CC | 1.36e-03 | 4.58e-01 | 0.0802 |
| 5818 | NECTIN1 | T3 | Human | Cervix | CC | 1.08e-27 | 5.54e-01 | 0.1389 |
| 5818 | NECTIN1 | HTA11_3410_2000001011 | Human | Colorectum | AD | 4.95e-04 | 2.80e-01 | 0.0155 |
| 5818 | NECTIN1 | HTA11_347_2000001011 | Human | Colorectum | AD | 1.84e-06 | 3.84e-01 | -0.1954 |
| 5818 | NECTIN1 | HTA11_3361_2000001011 | Human | Colorectum | AD | 1.33e-03 | 5.08e-01 | -0.1207 |
| 5818 | NECTIN1 | HTA11_696_2000001011 | Human | Colorectum | AD | 9.58e-13 | 6.55e-01 | -0.1464 |
| 5818 | NECTIN1 | HTA11_866_2000001011 | Human | Colorectum | AD | 1.22e-04 | 3.77e-01 | -0.1001 |
| 5818 | NECTIN1 | HTA11_1391_2000001011 | Human | Colorectum | AD | 4.07e-06 | 4.71e-01 | -0.059 |
| 5818 | NECTIN1 | HTA11_546_2000001011 | Human | Colorectum | AD | 1.03e-04 | 5.52e-01 | -0.0842 |
| 5818 | NECTIN1 | HTA11_866_3004761011 | Human | Colorectum | AD | 4.49e-10 | 5.01e-01 | 0.096 |
| 5818 | NECTIN1 | HTA11_7696_3000711011 | Human | Colorectum | AD | 1.17e-08 | 4.46e-01 | 0.0674 |
| 5818 | NECTIN1 | HTA11_99999965062_69753 | Human | Colorectum | MSI-H | 5.20e-05 | 9.39e-01 | 0.3487 |
| 5818 | NECTIN1 | HTA11_99999971662_82457 | Human | Colorectum | MSS | 1.97e-02 | 2.37e-01 | 0.3859 |
| 5818 | NECTIN1 | HTA11_99999973899_84307 | Human | Colorectum | MSS | 2.93e-06 | 7.13e-01 | 0.2585 |
| 5818 | NECTIN1 | HTA11_99999974143_84620 | Human | Colorectum | MSS | 2.94e-05 | 3.61e-01 | 0.3005 |
| 5818 | NECTIN1 | A015-C-203 | Human | Colorectum | FAP | 2.36e-02 | -1.03e-01 | -0.1294 |
| Page: 1 2 |
| Tissue | Expression Dynamics | Abbreviation |
| Cervix |  | CC: Cervix cancer |
| HSIL_HPV: HPV-infected high-grade squamous intraepithelial lesions | ||
| N_HPV: HPV-infected normal cervix | ||
| Colorectum (GSE201348) |  | FAP: Familial adenomatous polyposis |
| CRC: Colorectal cancer | ||
| Colorectum (HTA11) |  | AD: Adenomas |
| SER: Sessile serrated lesions | ||
| MSI-H: Microsatellite-high colorectal cancer | ||
| MSS: Microsatellite stable colorectal cancer | ||
| Liver | 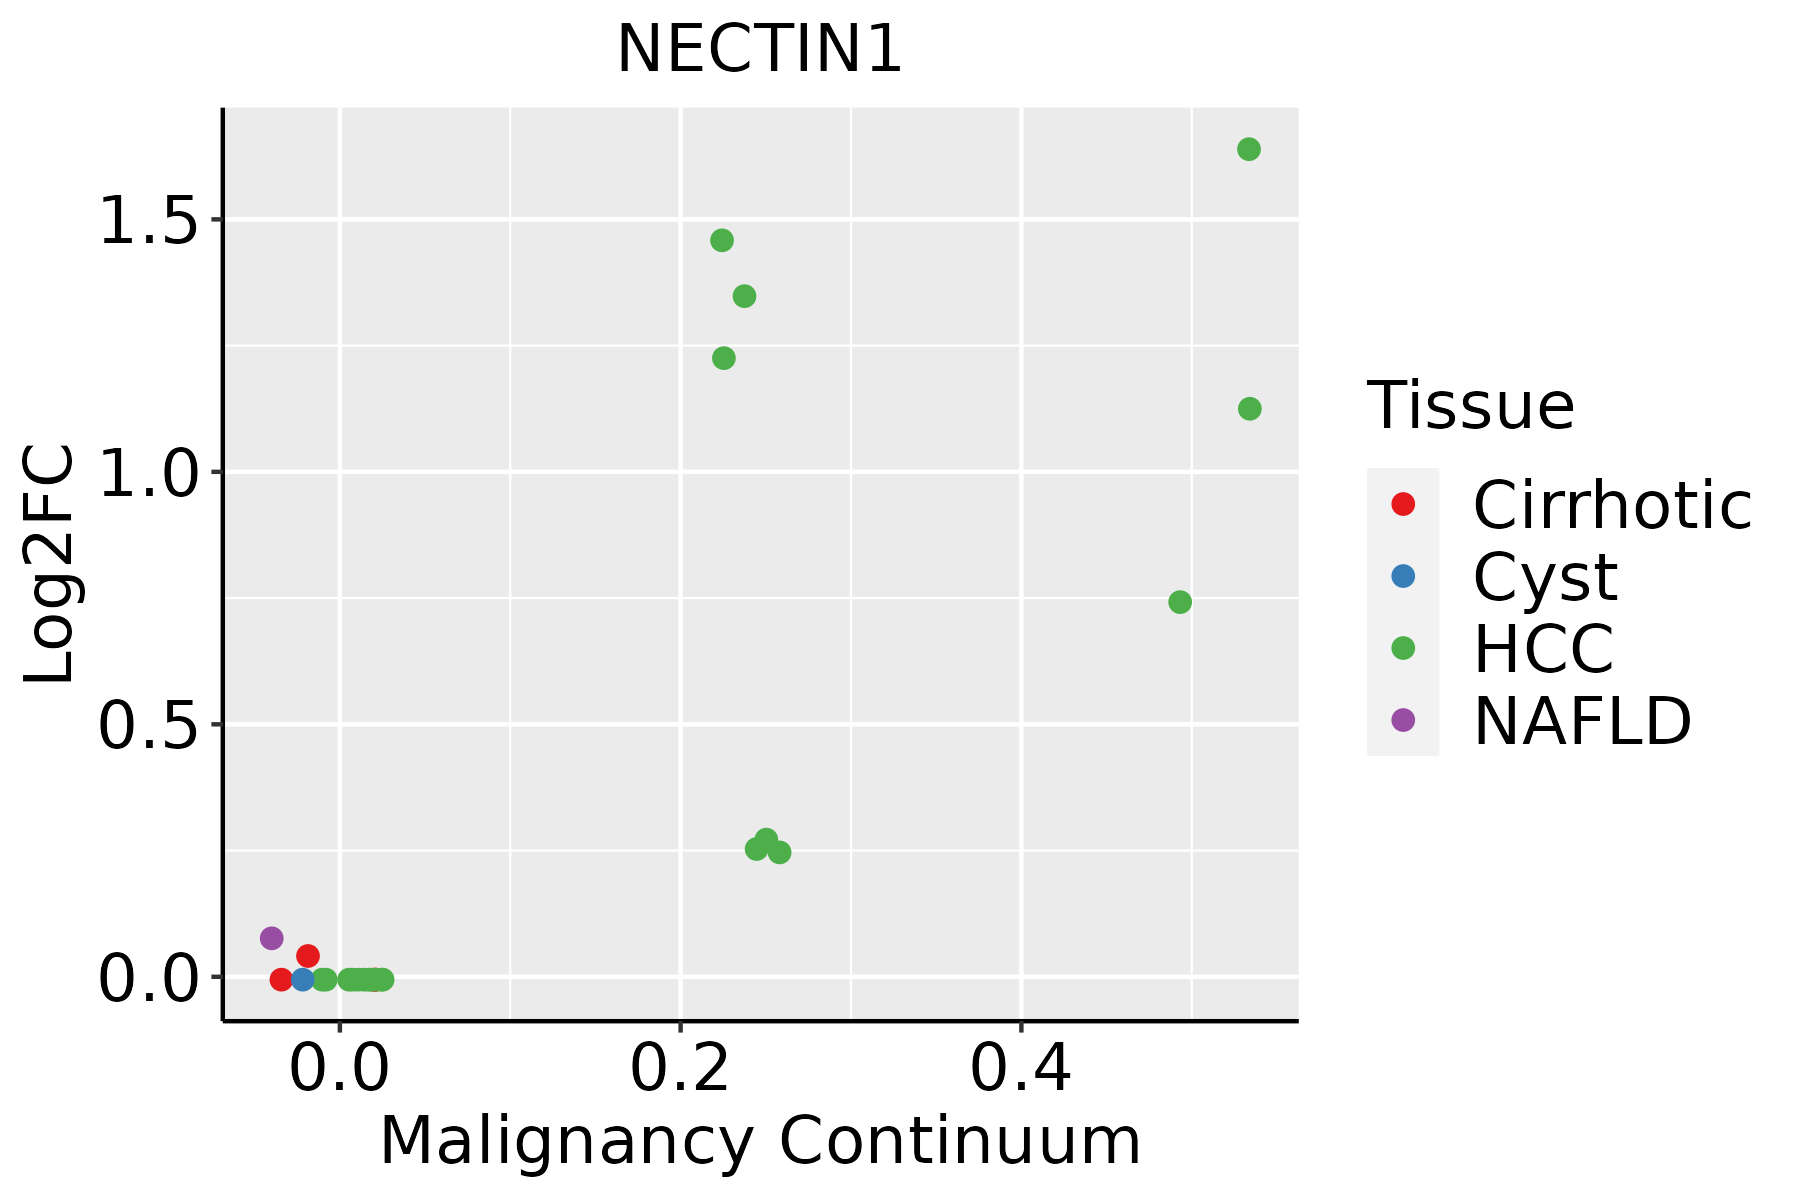 | HCC: Hepatocellular carcinoma |
| NAFLD: Non-alcoholic fatty liver disease |
| ∗log2FC in expression of this searched gene in stem-like cells from each diseased tissue sample relative to stem-like cells in normal samples in each tissue plotted against the malignancy continuum. Samples are colored based on if they are from different disease stage. |
Top |
Malignant transformation related pathway analysis |
| Find out the enriched GO biological processes and KEGG pathways involved in transition from healthy to precancer to cancer |
| Tissue | Disease Stage | Enriched GO biological Processes |
| Colorectum | AD |  |
| Colorectum | SER |  |
| Colorectum | MSS |  |
| Colorectum | MSI-H |  |
| Colorectum | FAP |  |
| ∗Top 15 enriched GO BP terms are showed in the bar plot of each disease state in each tissue. Each row represents a significant GO biological process which is colored according to the -log10(p.adjust). |
| Page: 1 2 3 4 5 6 7 8 9 |
| GO ID | Tissue | Disease Stage | Description | Gene Ratio | Bg Ratio | pvalue | p.adjust | Count |
| GO:001603210 | Cervix | CC | viral process | 109/2311 | 415/18723 | 5.40e-15 | 6.46e-12 | 109 |
| GO:001905810 | Cervix | CC | viral life cycle | 87/2311 | 317/18723 | 2.20e-13 | 1.20e-10 | 87 |
| GO:005212610 | Cervix | CC | movement in host environment | 52/2311 | 175/18723 | 7.03e-10 | 8.76e-08 | 52 |
| GO:004440910 | Cervix | CC | entry into host | 47/2311 | 151/18723 | 8.45e-10 | 1.03e-07 | 47 |
| GO:005170110 | Cervix | CC | biological process involved in interaction with host | 57/2311 | 203/18723 | 1.18e-09 | 1.41e-07 | 57 |
| GO:004671810 | Cervix | CC | viral entry into host cell | 44/2311 | 144/18723 | 5.47e-09 | 5.03e-07 | 44 |
| GO:004440310 | Cervix | CC | biological process involved in symbiotic interaction | 71/2311 | 290/18723 | 7.94e-09 | 6.98e-07 | 71 |
| GO:00452169 | Cervix | CC | cell-cell junction organization | 53/2311 | 200/18723 | 3.83e-08 | 2.53e-06 | 53 |
| GO:00343298 | Cervix | CC | cell junction assembly | 88/2311 | 420/18723 | 3.42e-07 | 1.38e-05 | 88 |
| GO:00615647 | Cervix | CC | axon development | 89/2311 | 467/18723 | 1.71e-05 | 3.27e-04 | 89 |
| GO:00029347 | Cervix | CC | desmosome organization | 7/2311 | 10/18723 | 3.69e-05 | 5.84e-04 | 7 |
| GO:00074097 | Cervix | CC | axonogenesis | 78/2311 | 418/18723 | 1.14e-04 | 1.43e-03 | 78 |
| GO:19018886 | Cervix | CC | regulation of cell junction assembly | 42/2311 | 204/18723 | 5.50e-04 | 5.29e-03 | 42 |
| GO:0150063 | Cervix | CC | visual system development | 63/2311 | 375/18723 | 6.58e-03 | 3.65e-02 | 63 |
| GO:0001654 | Cervix | CC | eye development | 62/2311 | 371/18723 | 7.83e-03 | 4.13e-02 | 62 |
| GO:0031214 | Cervix | CC | biomineral tissue development | 32/2311 | 169/18723 | 8.73e-03 | 4.48e-02 | 32 |
| GO:0048880 | Cervix | CC | sensory system development | 63/2311 | 381/18723 | 9.29e-03 | 4.66e-02 | 63 |
| GO:0110148 | Cervix | CC | biomineralization | 32/2311 | 171/18723 | 1.04e-02 | 4.97e-02 | 32 |
| GO:0016032 | Colorectum | AD | viral process | 168/3918 | 415/18723 | 4.67e-20 | 3.66e-17 | 168 |
| GO:0019058 | Colorectum | AD | viral life cycle | 119/3918 | 317/18723 | 6.18e-12 | 8.23e-10 | 119 |
| Page: 1 2 3 4 5 |
| Pathway ID | Tissue | Disease Stage | Description | Gene Ratio | Bg Ratio | pvalue | p.adjust | qvalue | Count |
| hsa0452020 | Cervix | CC | Adherens junction | 33/1267 | 93/8465 | 6.99e-07 | 7.31e-06 | 4.32e-06 | 33 |
| hsa045147 | Cervix | CC | Cell adhesion molecules | 36/1267 | 157/8465 | 4.94e-03 | 1.67e-02 | 9.86e-03 | 36 |
| hsa04520110 | Cervix | CC | Adherens junction | 33/1267 | 93/8465 | 6.99e-07 | 7.31e-06 | 4.32e-06 | 33 |
| hsa0451412 | Cervix | CC | Cell adhesion molecules | 36/1267 | 157/8465 | 4.94e-03 | 1.67e-02 | 9.86e-03 | 36 |
| hsa04520 | Colorectum | AD | Adherens junction | 50/2092 | 93/8465 | 1.52e-09 | 2.83e-08 | 1.81e-08 | 50 |
| hsa045201 | Colorectum | AD | Adherens junction | 50/2092 | 93/8465 | 1.52e-09 | 2.83e-08 | 1.81e-08 | 50 |
| hsa045204 | Colorectum | MSS | Adherens junction | 42/1875 | 93/8465 | 6.18e-07 | 9.01e-06 | 5.52e-06 | 42 |
| hsa045205 | Colorectum | MSS | Adherens junction | 42/1875 | 93/8465 | 6.18e-07 | 9.01e-06 | 5.52e-06 | 42 |
| hsa045206 | Colorectum | MSI-H | Adherens junction | 22/797 | 93/8465 | 3.71e-05 | 5.47e-04 | 4.58e-04 | 22 |
| hsa045207 | Colorectum | MSI-H | Adherens junction | 22/797 | 93/8465 | 3.71e-05 | 5.47e-04 | 4.58e-04 | 22 |
| hsa045208 | Colorectum | FAP | Adherens junction | 45/1404 | 93/8465 | 8.66e-13 | 2.89e-10 | 1.76e-10 | 45 |
| hsa045209 | Colorectum | FAP | Adherens junction | 45/1404 | 93/8465 | 8.66e-13 | 2.89e-10 | 1.76e-10 | 45 |
| hsa0452042 | Liver | HCC | Adherens junction | 68/4020 | 93/8465 | 3.99e-07 | 4.46e-06 | 2.48e-06 | 68 |
| hsa0452052 | Liver | HCC | Adherens junction | 68/4020 | 93/8465 | 3.99e-07 | 4.46e-06 | 2.48e-06 | 68 |
| Page: 1 |
Top |
Cell-cell communication analysis |
| Identification of potential cell-cell interactions between two cell types and their ligand-receptor pairs for different disease states |
| Ligand | Receptor | LRpair | Pathway | Tissue | Disease Stage |
| NECTIN1 | CD96 | NECTIN1_CD96 | NECTIN | Cervix | CC |
| NECTIN1 | NECTIN4 | NECTIN1_NECTIN4 | NECTIN | Cervix | CC |
| NECTIN3 | NECTIN1 | NECTIN3_NECTIN1 | NECTIN | Cervix | CC |
| NECTIN1 | NECTIN3 | NECTIN1_NECTIN3 | NECTIN | Cervix | CC |
| CD96 | NECTIN1 | CD96_NECTIN1 | CD96 | Cervix | CC |
| NECTIN1 | CD96 | NECTIN1_CD96 | NECTIN | CRC | AD |
| CD96 | NECTIN1 | CD96_NECTIN1 | CD96 | CRC | AD |
| NECTIN1 | CD96 | NECTIN1_CD96 | NECTIN | CRC | MSI-H |
| NECTIN1 | NECTIN4 | NECTIN1_NECTIN4 | NECTIN | CRC | MSI-H |
| NECTIN3 | NECTIN1 | NECTIN3_NECTIN1 | NECTIN | CRC | MSI-H |
| NECTIN1 | NECTIN3 | NECTIN1_NECTIN3 | NECTIN | CRC | MSI-H |
| CD96 | NECTIN1 | CD96_NECTIN1 | CD96 | CRC | MSI-H |
| NECTIN1 | CD96 | NECTIN1_CD96 | NECTIN | CRC | MSS |
| NECTIN3 | NECTIN1 | NECTIN3_NECTIN1 | NECTIN | CRC | MSS |
| NECTIN1 | NECTIN3 | NECTIN1_NECTIN3 | NECTIN | CRC | MSS |
| CD96 | NECTIN1 | CD96_NECTIN1 | CD96 | CRC | MSS |
| NECTIN1 | CADM3 | NECTIN1_CADM3 | NECTIN | Prostate | BPH |
| NECTIN1 | CD96 | NECTIN1_CD96 | NECTIN | Prostate | BPH |
| NECTIN1 | NECTIN4 | NECTIN1_NECTIN4 | NECTIN | Prostate | BPH |
| CD96 | NECTIN1 | CD96_NECTIN1 | CD96 | Prostate | BPH |
| Page: 1 2 |
Top |
Single-cell gene regulatory network inference analysis |
| Find out the significant the regulons (TFs) and the target genes of each regulon across cell types for different disease states |
| TF | Cell Type | Tissue | Disease Stage | Target Gene | RSS | Regulon Activity |
| ∗The dot plots of a searched regulon are shown for all cell subpopulations in each disease state of each tissue based on the regulon specific score inferred using pySCENIC and by calculating the average expression. |
| Page: 1 |
Top |
Somatic mutation of malignant transformation related genes |
| Annotation of somatic variants for genes involved in malignant transformation |
| Hugo Symbol | Variant Class | Variant Classification | dbSNP RS | HGVSc | HGVSp | HGVSp Short | SWISSPROT | BIOTYPE | SIFT | PolyPhen | Tumor Sample Barcode | Tissue | Histology | Sex | Age | Stage | Therapy Types | Drugs | Outcome |
| NECTIN1 | SNV | Missense_Mutation | novel | c.1323N>T | p.Glu441Asp | p.E441D | Q15223 | protein_coding | tolerated(0.48) | benign(0.003) | TCGA-A8-A09Z-01 | Breast | breast invasive carcinoma | Female | >=65 | I/II | Unknown | Unknown | SD |
| NECTIN1 | SNV | Missense_Mutation | c.1195N>A | p.Gly399Ser | p.G399S | Q15223 | protein_coding | deleterious(0.04) | probably_damaging(0.997) | TCGA-AN-A0AK-01 | Breast | breast invasive carcinoma | Female | >=65 | I/II | Unknown | Unknown | SD | |
| NECTIN1 | deletion | Frame_Shift_Del | novel | c.1429delC | p.Arg477ValfsTer121 | p.R477Vfs*121 | Q15223 | protein_coding | TCGA-EW-A2FV-01 | Breast | breast invasive carcinoma | Female | <65 | III/IV | Chemotherapy | docetaxel | SD | ||
| NECTIN1 | SNV | Missense_Mutation | rs755806347 | c.1258N>A | p.Asp420Asn | p.D420N | Q15223 | protein_coding | deleterious(0) | benign(0.318) | TCGA-EK-A2PM-01 | Cervix | cervical & endocervical cancer | Female | >=65 | I/II | Unknown | Unknown | SD |
| NECTIN1 | SNV | Missense_Mutation | c.373N>A | p.Glu125Lys | p.E125K | Q15223 | protein_coding | deleterious(0) | probably_damaging(0.999) | TCGA-LP-A4AV-01 | Cervix | cervical & endocervical cancer | Female | <65 | I/II | Unknown | Unknown | SD | |
| NECTIN1 | SNV | Missense_Mutation | c.1226N>G | p.His409Arg | p.H409R | Q15223 | protein_coding | tolerated(0.06) | benign(0.326) | TCGA-A6-3809-01 | Colorectum | colon adenocarcinoma | Female | >=65 | I/II | Unknown | Unknown | SD | |
| NECTIN1 | SNV | Missense_Mutation | rs750571284 | c.329N>A | p.Arg110His | p.R110H | Q15223 | protein_coding | tolerated(0.16) | benign(0.371) | TCGA-AA-3492-01 | Colorectum | colon adenocarcinoma | Female | >=65 | I/II | Unknown | Unknown | SD |
| NECTIN1 | SNV | Missense_Mutation | novel | c.1547N>G | p.Tyr516Cys | p.Y516C | Q15223 | protein_coding | deleterious(0) | probably_damaging(0.993) | TCGA-AA-3715-01 | Colorectum | colon adenocarcinoma | Male | >=65 | I/II | Unknown | Unknown | PD |
| NECTIN1 | SNV | Missense_Mutation | c.1546N>C | p.Tyr516His | p.Y516H | Q15223 | protein_coding | deleterious(0) | probably_damaging(0.99) | TCGA-AA-A01R-01 | Colorectum | colon adenocarcinoma | Male | <65 | III/IV | Chemotherapy | 5-fluorouracil | PD | |
| NECTIN1 | SNV | Missense_Mutation | rs759345182 | c.1114G>A | p.Gly372Ser | p.G372S | Q15223 | protein_coding | tolerated(0.07) | benign(0.105) | TCGA-AA-A022-01 | Colorectum | colon adenocarcinoma | Female | >=65 | I/II | Unknown | Unknown | SD |
| Page: 1 2 3 4 5 6 7 |
Top |
Related drugs of malignant transformation related genes |
| Identification of chemicals and drugs interact with genes involved in malignant transfromation |
| (DGIdb 4.0) |
| Entrez ID | Symbol | Category | Interaction Types | Drug Claim Name | Drug Name | PMIDs |
| Page: 1 |

Copyright 2023-Present -The University of Texas Health Science Center at Houston |