
|
|||||
|
 | |
| |
| |
| |
| |
| |
|
Gene: NECAP1 |
Gene summary for NECAP1 |
| Gene information | Species | Human | Gene symbol | NECAP1 | Gene ID | 25977 |
| Gene name | NECAP endocytosis associated 1 | |
| Gene Alias | DEE21 | |
| Cytomap | 12p13.31 | |
| Gene Type | protein-coding | GO ID | GO:0006810 | UniProtAcc | Q8NC96 |
Top |
Malignant transformation analysis |
| Identification of the aberrant gene expression in precancerous and cancerous lesions by comparing the gene expression of stem-like cells in diseased tissues with normal stem cells |
| Entrez ID | Symbol | Replicates | Species | Organ | Tissue | Adj P-value | Log2FC | Malignancy |
| 25977 | NECAP1 | LZE4T | Human | Esophagus | ESCC | 2.44e-03 | 1.07e-01 | 0.0811 |
| 25977 | NECAP1 | LZE7T | Human | Esophagus | ESCC | 7.88e-06 | 2.58e-01 | 0.0667 |
| 25977 | NECAP1 | LZE8T | Human | Esophagus | ESCC | 1.65e-11 | 3.29e-01 | 0.067 |
| 25977 | NECAP1 | LZE20T | Human | Esophagus | ESCC | 1.20e-03 | 1.64e-01 | 0.0662 |
| 25977 | NECAP1 | LZE24T | Human | Esophagus | ESCC | 2.78e-16 | 3.09e-01 | 0.0596 |
| 25977 | NECAP1 | LZE6T | Human | Esophagus | ESCC | 4.45e-02 | 1.12e-01 | 0.0845 |
| 25977 | NECAP1 | P1T-E | Human | Esophagus | ESCC | 8.89e-05 | 1.46e-01 | 0.0875 |
| 25977 | NECAP1 | P2T-E | Human | Esophagus | ESCC | 1.12e-18 | 4.17e-01 | 0.1177 |
| 25977 | NECAP1 | P4T-E | Human | Esophagus | ESCC | 5.77e-24 | 5.09e-01 | 0.1323 |
| 25977 | NECAP1 | P5T-E | Human | Esophagus | ESCC | 1.48e-18 | 2.69e-01 | 0.1327 |
| 25977 | NECAP1 | P8T-E | Human | Esophagus | ESCC | 3.44e-15 | 2.11e-01 | 0.0889 |
| 25977 | NECAP1 | P9T-E | Human | Esophagus | ESCC | 9.04e-03 | 9.31e-02 | 0.1131 |
| 25977 | NECAP1 | P10T-E | Human | Esophagus | ESCC | 1.42e-28 | 3.48e-01 | 0.116 |
| 25977 | NECAP1 | P11T-E | Human | Esophagus | ESCC | 1.33e-13 | 3.39e-01 | 0.1426 |
| 25977 | NECAP1 | P12T-E | Human | Esophagus | ESCC | 4.56e-31 | 6.41e-01 | 0.1122 |
| 25977 | NECAP1 | P15T-E | Human | Esophagus | ESCC | 1.79e-16 | 3.68e-01 | 0.1149 |
| 25977 | NECAP1 | P16T-E | Human | Esophagus | ESCC | 7.50e-68 | 1.29e+00 | 0.1153 |
| 25977 | NECAP1 | P17T-E | Human | Esophagus | ESCC | 8.63e-05 | 1.62e-01 | 0.1278 |
| 25977 | NECAP1 | P20T-E | Human | Esophagus | ESCC | 9.90e-14 | 2.54e-01 | 0.1124 |
| 25977 | NECAP1 | P21T-E | Human | Esophagus | ESCC | 8.24e-14 | 2.19e-01 | 0.1617 |
| Page: 1 2 3 4 |
| Tissue | Expression Dynamics | Abbreviation |
| Esophagus |  | ESCC: Esophageal squamous cell carcinoma |
| HGIN: High-grade intraepithelial neoplasias | ||
| LGIN: Low-grade intraepithelial neoplasias | ||
| Oral Cavity | 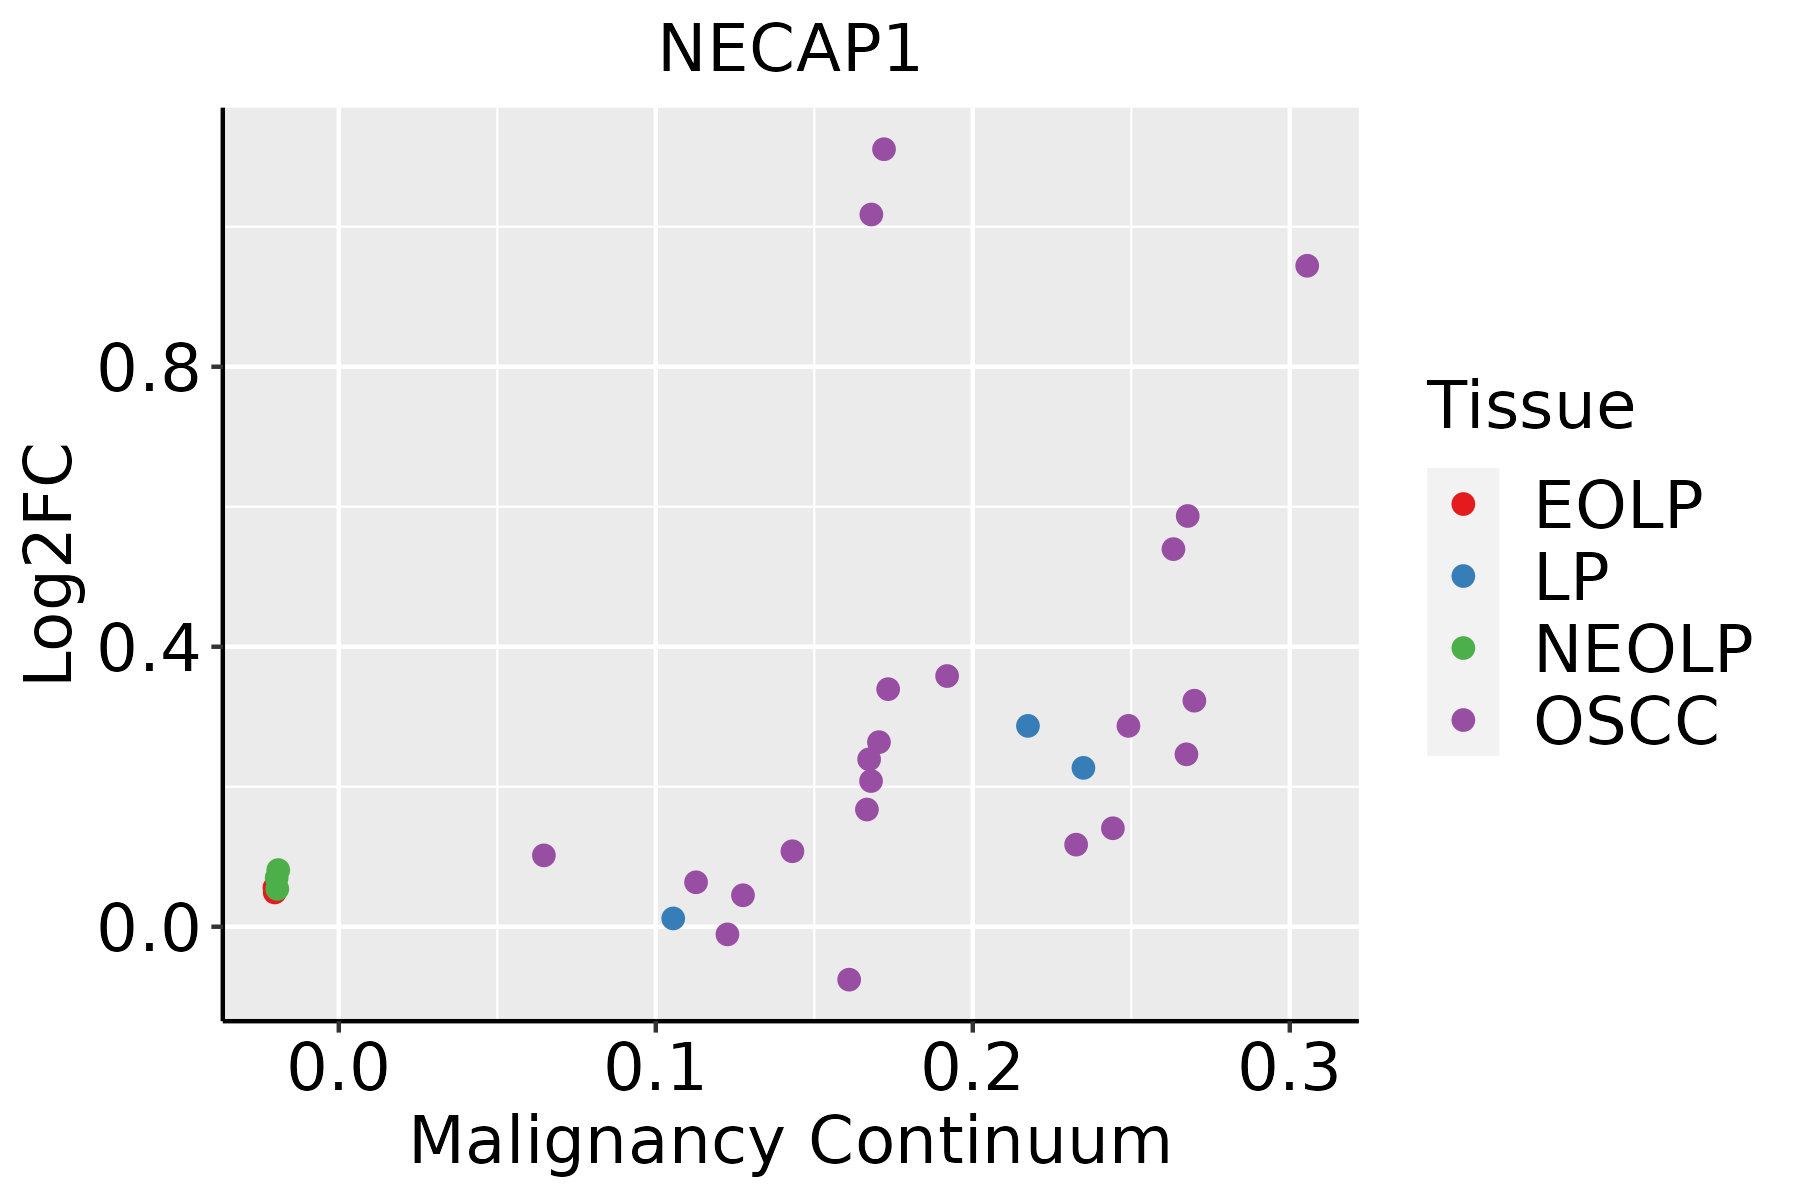 | EOLP: Erosive Oral lichen planus |
| LP: leukoplakia | ||
| NEOLP: Non-erosive oral lichen planus | ||
| OSCC: Oral squamous cell carcinoma |
| ∗log2FC in expression of this searched gene in stem-like cells from each diseased tissue sample relative to stem-like cells in normal samples in each tissue plotted against the malignancy continuum. Samples are colored based on if they are from different disease stage. |
Top |
Malignant transformation related pathway analysis |
| Find out the enriched GO biological processes and KEGG pathways involved in transition from healthy to precancer to cancer |
| Tissue | Disease Stage | Enriched GO biological Processes |
| Colorectum | AD |  |
| Colorectum | SER |  |
| Colorectum | MSS |  |
| Colorectum | MSI-H |  |
| Colorectum | FAP |  |
| ∗Top 15 enriched GO BP terms are showed in the bar plot of each disease state in each tissue. Each row represents a significant GO biological process which is colored according to the -log10(p.adjust). |
| Page: 1 2 3 4 5 6 7 8 9 |
| GO ID | Tissue | Disease Stage | Description | Gene Ratio | Bg Ratio | pvalue | p.adjust | Count |
| Page: 1 |
| Pathway ID | Tissue | Disease Stage | Description | Gene Ratio | Bg Ratio | pvalue | p.adjust | qvalue | Count |
| Page: 1 |
Top |
Cell-cell communication analysis |
| Identification of potential cell-cell interactions between two cell types and their ligand-receptor pairs for different disease states |
| Ligand | Receptor | LRpair | Pathway | Tissue | Disease Stage |
| Page: 1 |
Top |
Single-cell gene regulatory network inference analysis |
| Find out the significant the regulons (TFs) and the target genes of each regulon across cell types for different disease states |
| TF | Cell Type | Tissue | Disease Stage | Target Gene | RSS | Regulon Activity |
| ∗The dot plots of a searched regulon are shown for all cell subpopulations in each disease state of each tissue based on the regulon specific score inferred using pySCENIC and by calculating the average expression. |
| Page: 1 |
Top |
Somatic mutation of malignant transformation related genes |
| Annotation of somatic variants for genes involved in malignant transformation |
| Hugo Symbol | Variant Class | Variant Classification | dbSNP RS | HGVSc | HGVSp | HGVSp Short | SWISSPROT | BIOTYPE | SIFT | PolyPhen | Tumor Sample Barcode | Tissue | Histology | Sex | Age | Stage | Therapy Types | Drugs | Outcome |
| NECAP1 | SNV | Missense_Mutation | rs755866954 | c.352N>A | p.Asp118Asn | p.D118N | protein_coding | deleterious(0.01) | probably_damaging(0.939) | TCGA-AN-A046-01 | Breast | breast invasive carcinoma | Female | >=65 | I/II | Unknown | Unknown | SD | |
| NECAP1 | SNV | Missense_Mutation | novel | c.67N>T | p.Pro23Ser | p.P23S | protein_coding | deleterious(0.01) | probably_damaging(0.999) | TCGA-D8-A1J8-01 | Breast | breast invasive carcinoma | Female | >=65 | I/II | Hormone Therapy | nolvadex | SD | |
| NECAP1 | insertion | Nonsense_Mutation | novel | c.346_347insGGTGATGGGAGACAGTGACAGAT | p.Ala116GlyfsTer2 | p.A116Gfs*2 | protein_coding | TCGA-A7-A0CE-01 | Breast | breast invasive carcinoma | Female | <65 | I/II | Chemotherapy | adriamycin | SD | |||
| NECAP1 | insertion | Frame_Shift_Ins | novel | c.58_59insTTTTTAATGGGTCTCAAAATTCTGTGAC | p.Tyr20PhefsTer25 | p.Y20Ffs*25 | protein_coding | TCGA-BH-A0HF-01 | Breast | breast invasive carcinoma | Female | >=65 | I/II | Hormone Therapy | arimidex | SD | |||
| NECAP1 | deletion | Frame_Shift_Del | novel | c.54_67delNNNNNNNNNNNNNN | p.Val19AlafsTer12 | p.V19Afs*12 | protein_coding | TCGA-GI-A2C9-01 | Breast | breast invasive carcinoma | Female | <65 | I/II | Unspecific | SD | ||||
| NECAP1 | SNV | Missense_Mutation | novel | c.668G>T | p.Ser223Ile | p.S223I | protein_coding | deleterious(0.04) | benign(0.009) | TCGA-A5-A1OF-01 | Endometrium | uterine corpus endometrioid carcinoma | Female | <65 | I/II | Unknown | Unknown | SD | |
| NECAP1 | SNV | Missense_Mutation | novel | c.269G>A | p.Arg90His | p.R90H | protein_coding | deleterious(0) | probably_damaging(0.999) | TCGA-AX-A0IZ-01 | Endometrium | uterine corpus endometrioid carcinoma | Female | <65 | I/II | Unknown | Unknown | SD | |
| NECAP1 | SNV | Missense_Mutation | c.698N>A | p.Ser233Tyr | p.S233Y | protein_coding | deleterious(0.01) | benign(0.251) | TCGA-AX-A0J0-01 | Endometrium | uterine corpus endometrioid carcinoma | Female | <65 | I/II | Unknown | Unknown | SD | ||
| NECAP1 | SNV | Missense_Mutation | novel | c.583N>A | p.Val195Ile | p.V195I | protein_coding | tolerated(0.51) | benign(0) | TCGA-B5-A3FC-01 | Endometrium | uterine corpus endometrioid carcinoma | Female | <65 | I/II | Unknown | Unknown | SD | |
| NECAP1 | SNV | Missense_Mutation | rs766363501 | c.305N>A | p.Arg102His | p.R102H | protein_coding | deleterious(0) | probably_damaging(0.937) | TCGA-EO-A22X-01 | Endometrium | uterine corpus endometrioid carcinoma | Female | <65 | III/IV | Unspecific | Carboplatin | Complete Response |
| Page: 1 2 3 |
Top |
Related drugs of malignant transformation related genes |
| Identification of chemicals and drugs interact with genes involved in malignant transfromation |
| (DGIdb 4.0) |
| Entrez ID | Symbol | Category | Interaction Types | Drug Claim Name | Drug Name | PMIDs |
| Page: 1 |

Copyright 2023-Present -The University of Texas Health Science Center at Houston |