
|
|||||
|
 | |
| |
| |
| |
| |
| |
|
Gene: NECAB3 |
Gene summary for NECAB3 |
| Gene information | Species | Human | Gene symbol | NECAB3 | Gene ID | 63941 |
| Gene name | N-terminal EF-hand calcium binding protein 3 | |
| Gene Alias | APBA2BP | |
| Cytomap | 20q11.22 | |
| Gene Type | protein-coding | GO ID | GO:0006807 | UniProtAcc | Q96P71 |
Top |
Malignant transformation analysis |
| Identification of the aberrant gene expression in precancerous and cancerous lesions by comparing the gene expression of stem-like cells in diseased tissues with normal stem cells |
| Entrez ID | Symbol | Replicates | Species | Organ | Tissue | Adj P-value | Log2FC | Malignancy |
| 63941 | NECAB3 | LZE24T | Human | Esophagus | ESCC | 3.41e-21 | 6.04e-01 | 0.0596 |
| 63941 | NECAB3 | P1T-E | Human | Esophagus | ESCC | 8.83e-04 | 2.03e-01 | 0.0875 |
| 63941 | NECAB3 | P2T-E | Human | Esophagus | ESCC | 8.19e-09 | 1.89e-01 | 0.1177 |
| 63941 | NECAB3 | P4T-E | Human | Esophagus | ESCC | 5.77e-12 | 2.96e-01 | 0.1323 |
| 63941 | NECAB3 | P5T-E | Human | Esophagus | ESCC | 1.92e-03 | 1.04e-01 | 0.1327 |
| 63941 | NECAB3 | P8T-E | Human | Esophagus | ESCC | 5.47e-12 | 2.45e-01 | 0.0889 |
| 63941 | NECAB3 | P9T-E | Human | Esophagus | ESCC | 7.42e-07 | 2.14e-01 | 0.1131 |
| 63941 | NECAB3 | P10T-E | Human | Esophagus | ESCC | 3.15e-03 | 1.32e-01 | 0.116 |
| 63941 | NECAB3 | P11T-E | Human | Esophagus | ESCC | 6.64e-10 | 4.08e-01 | 0.1426 |
| 63941 | NECAB3 | P12T-E | Human | Esophagus | ESCC | 1.89e-31 | 4.95e-01 | 0.1122 |
| 63941 | NECAB3 | P15T-E | Human | Esophagus | ESCC | 1.77e-32 | 5.67e-01 | 0.1149 |
| 63941 | NECAB3 | P16T-E | Human | Esophagus | ESCC | 6.13e-16 | 3.55e-01 | 0.1153 |
| 63941 | NECAB3 | P17T-E | Human | Esophagus | ESCC | 3.62e-03 | 1.71e-01 | 0.1278 |
| 63941 | NECAB3 | P19T-E | Human | Esophagus | ESCC | 1.46e-02 | 2.94e-01 | 0.1662 |
| 63941 | NECAB3 | P20T-E | Human | Esophagus | ESCC | 2.03e-17 | 3.81e-01 | 0.1124 |
| 63941 | NECAB3 | P21T-E | Human | Esophagus | ESCC | 4.34e-18 | 3.91e-01 | 0.1617 |
| 63941 | NECAB3 | P22T-E | Human | Esophagus | ESCC | 3.81e-11 | 2.14e-01 | 0.1236 |
| 63941 | NECAB3 | P23T-E | Human | Esophagus | ESCC | 4.68e-16 | 3.75e-01 | 0.108 |
| 63941 | NECAB3 | P24T-E | Human | Esophagus | ESCC | 2.08e-19 | 3.38e-01 | 0.1287 |
| 63941 | NECAB3 | P26T-E | Human | Esophagus | ESCC | 1.83e-46 | 8.00e-01 | 0.1276 |
| Page: 1 2 3 4 |
| Tissue | Expression Dynamics | Abbreviation |
| Esophagus | 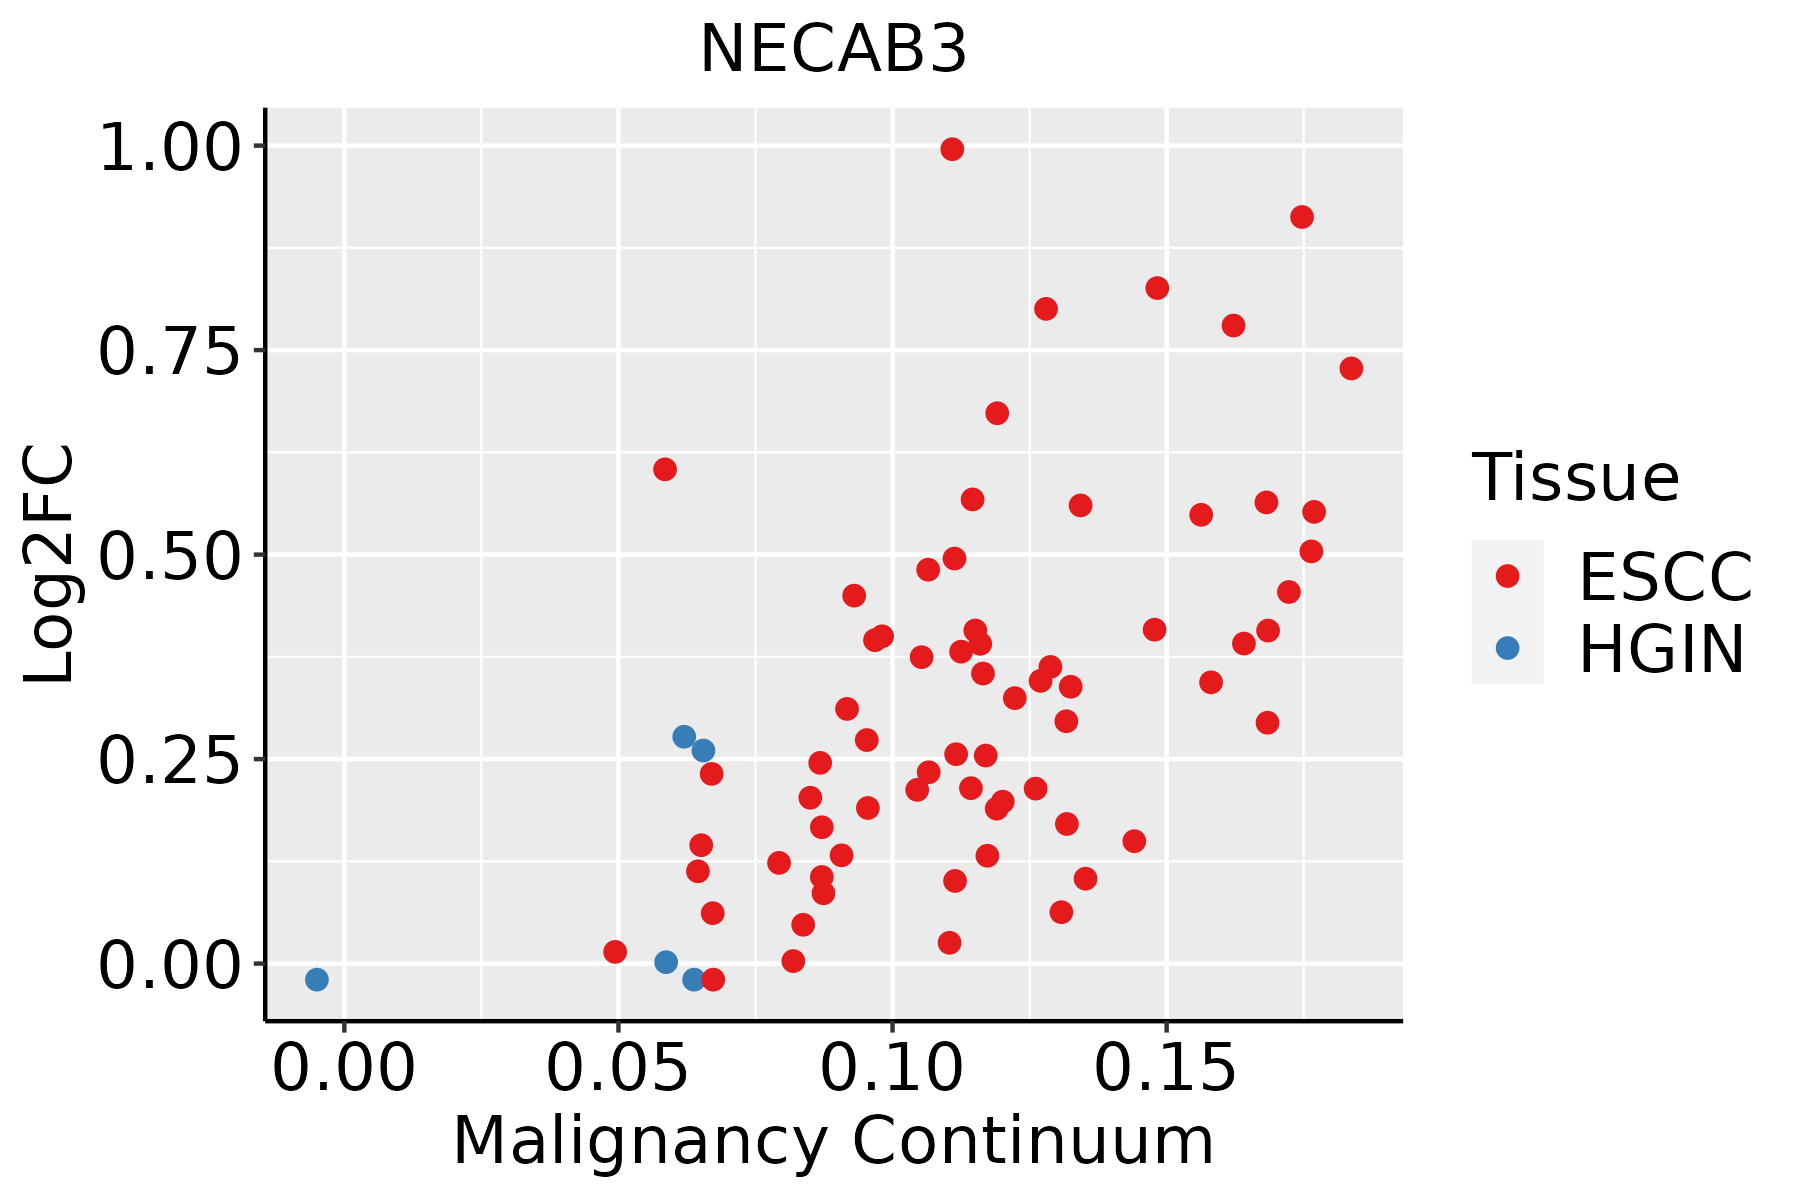 | ESCC: Esophageal squamous cell carcinoma |
| HGIN: High-grade intraepithelial neoplasias | ||
| LGIN: Low-grade intraepithelial neoplasias | ||
| Liver | 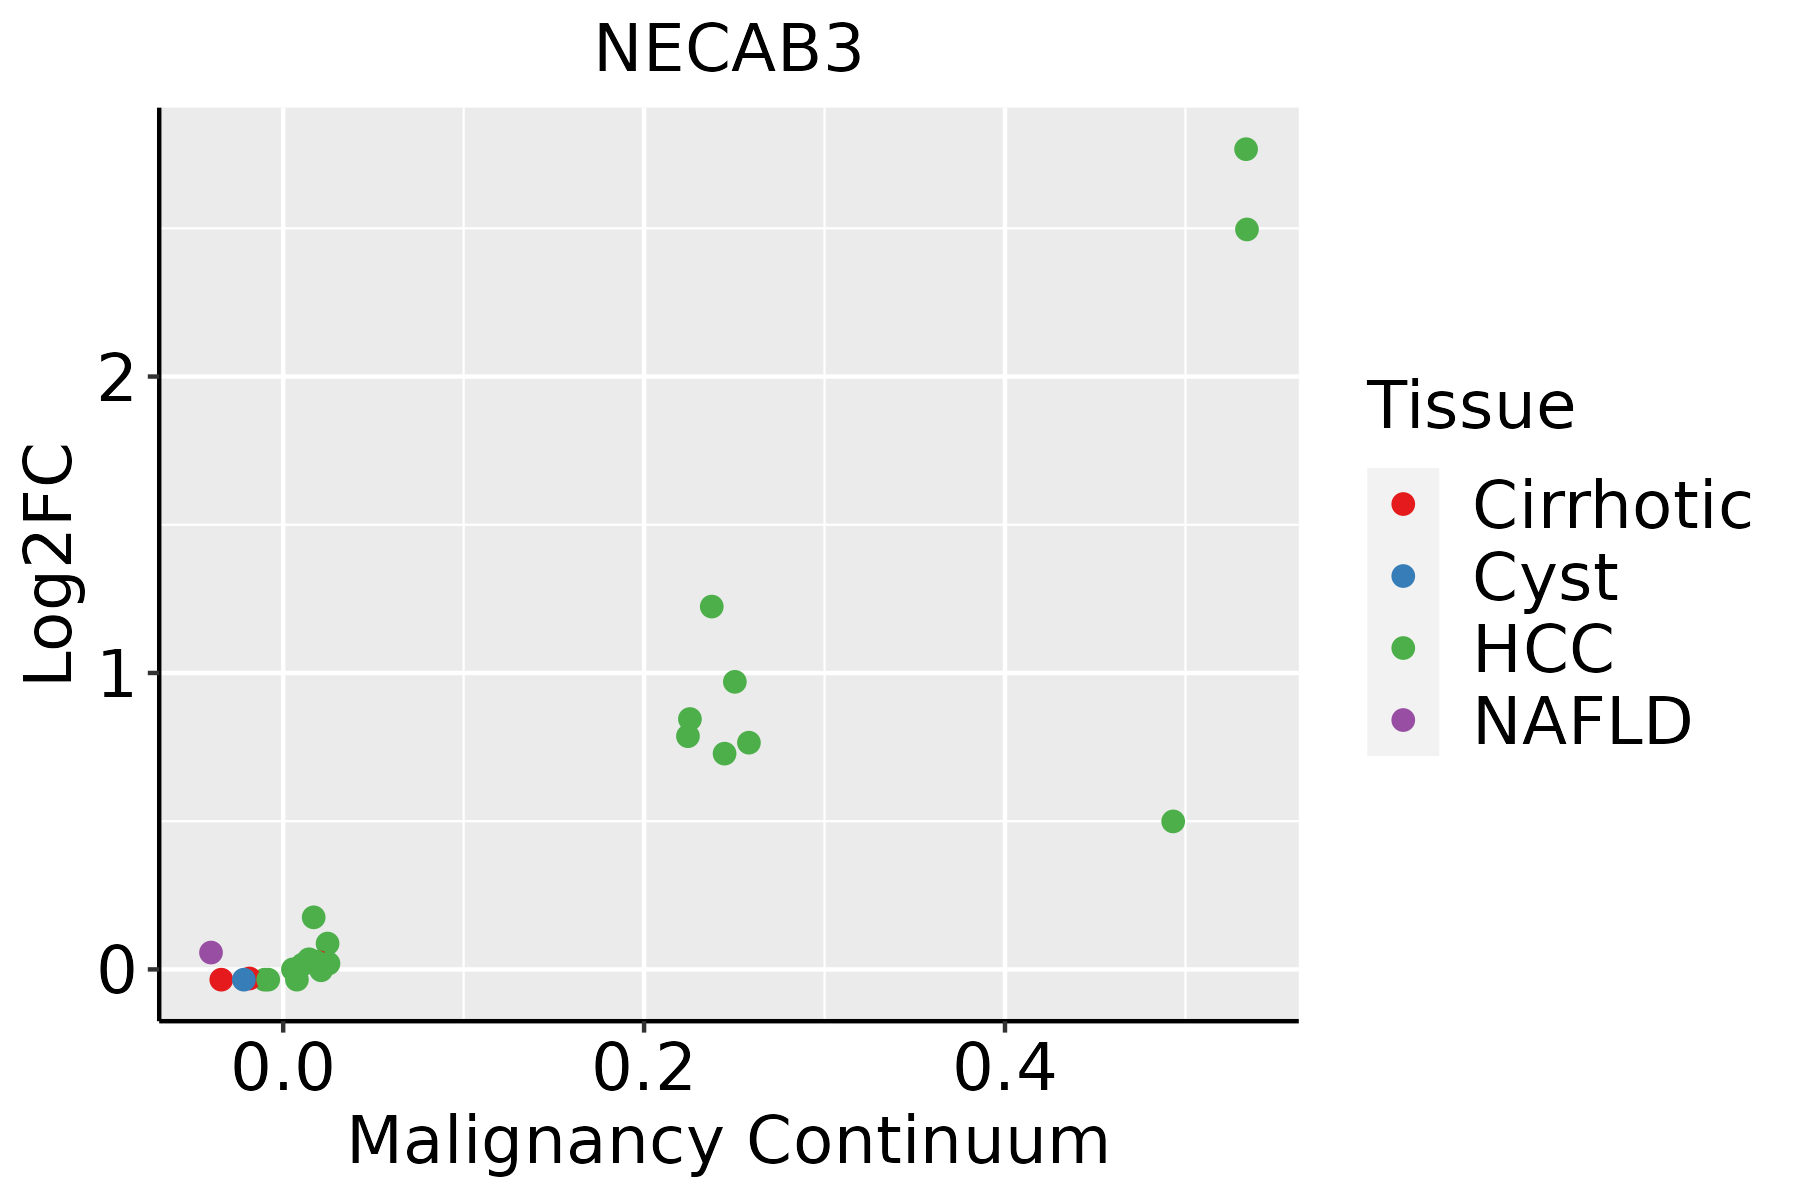 | HCC: Hepatocellular carcinoma |
| NAFLD: Non-alcoholic fatty liver disease | ||
| Oral Cavity |  | EOLP: Erosive Oral lichen planus |
| LP: leukoplakia | ||
| NEOLP: Non-erosive oral lichen planus | ||
| OSCC: Oral squamous cell carcinoma | ||
| Prostate | 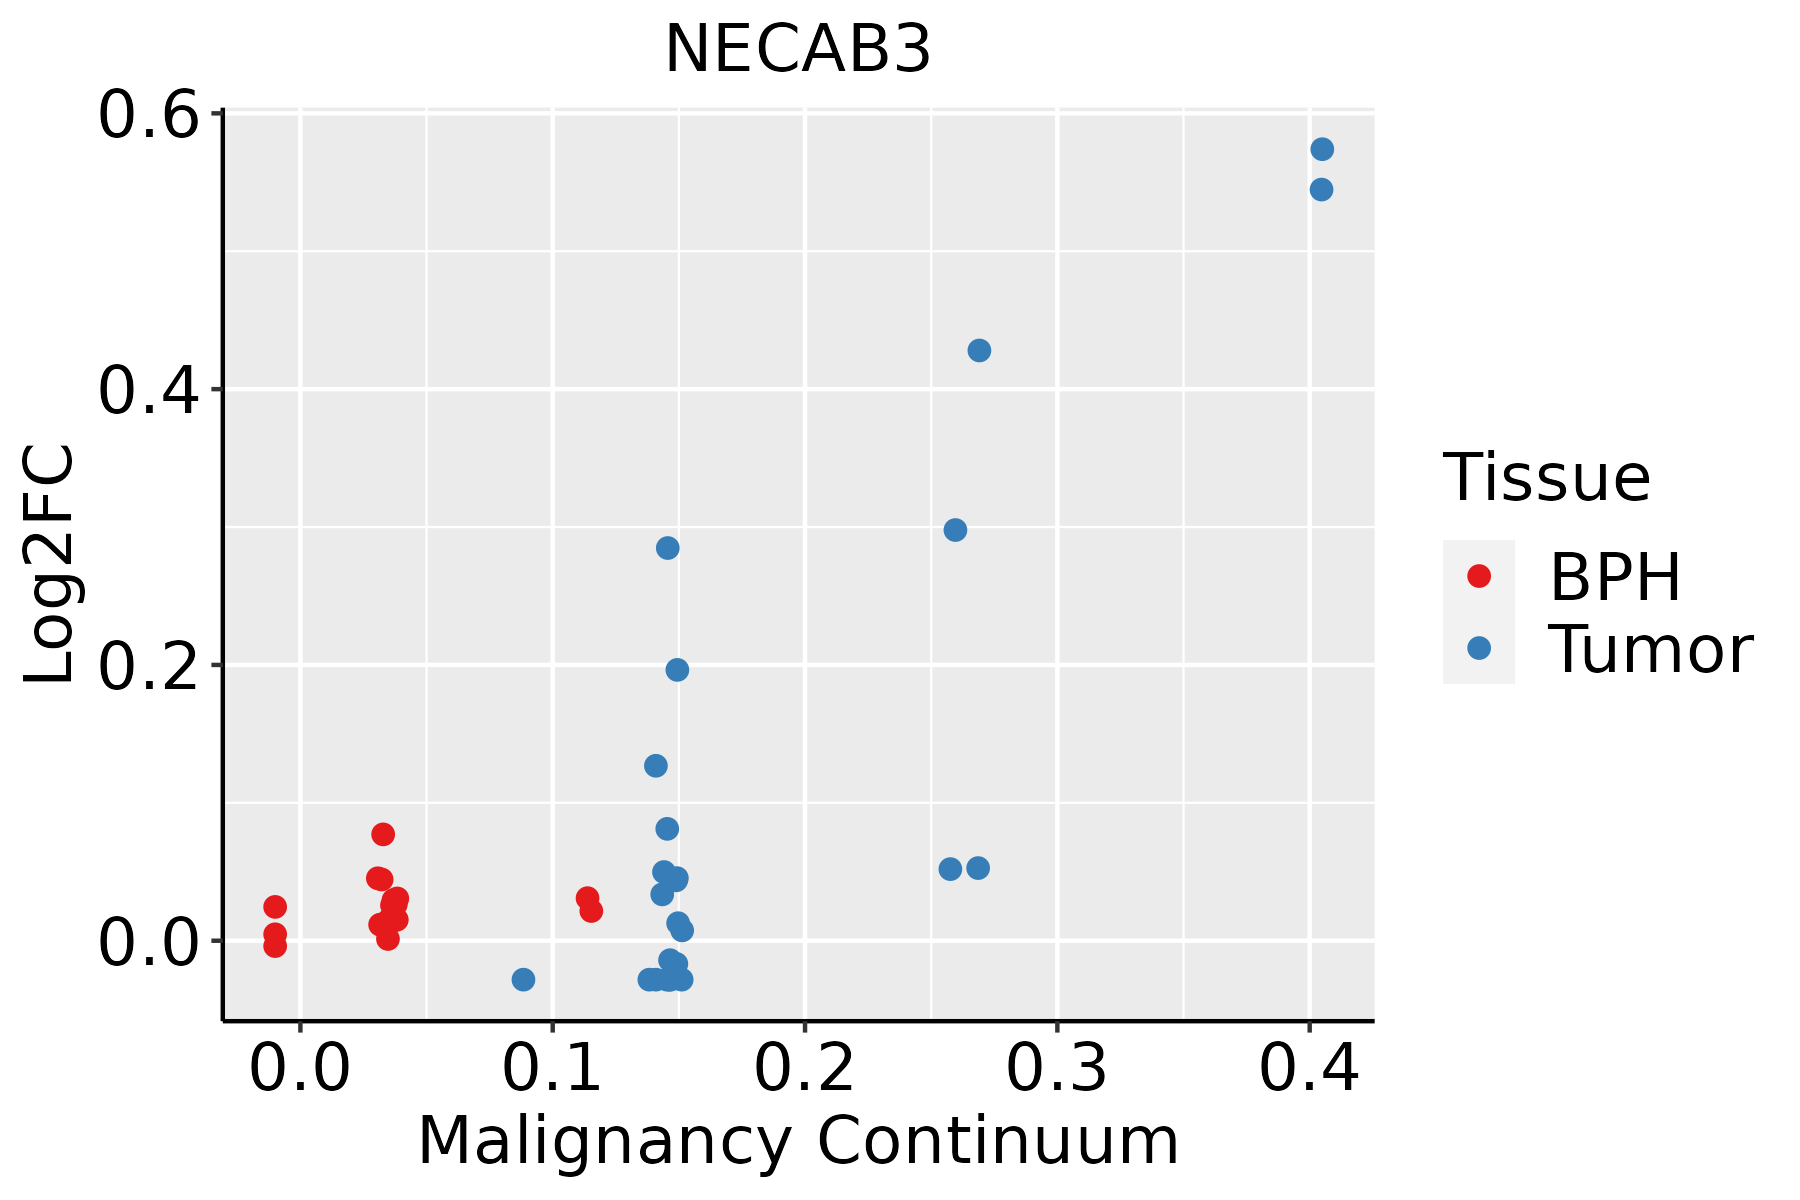 | BPH: Benign Prostatic Hyperplasia |
| ∗log2FC in expression of this searched gene in stem-like cells from each diseased tissue sample relative to stem-like cells in normal samples in each tissue plotted against the malignancy continuum. Samples are colored based on if they are from different disease stage. |
Top |
Malignant transformation related pathway analysis |
| Find out the enriched GO biological processes and KEGG pathways involved in transition from healthy to precancer to cancer |
| Tissue | Disease Stage | Enriched GO biological Processes |
| Colorectum | AD |  |
| Colorectum | SER |  |
| Colorectum | MSS |  |
| Colorectum | MSI-H |  |
| Colorectum | FAP |  |
| ∗Top 15 enriched GO BP terms are showed in the bar plot of each disease state in each tissue. Each row represents a significant GO biological process which is colored according to the -log10(p.adjust). |
| Page: 1 2 3 4 5 6 7 8 9 |
| GO ID | Tissue | Disease Stage | Description | Gene Ratio | Bg Ratio | pvalue | p.adjust | Count |
| GO:00091002 | Esophagus | ESCC | glycoprotein metabolic process | 226/8552 | 387/18723 | 2.64e-07 | 3.94e-06 | 226 |
| GO:00091012 | Esophagus | ESCC | glycoprotein biosynthetic process | 181/8552 | 317/18723 | 2.54e-05 | 2.15e-04 | 181 |
| GO:000930617 | Esophagus | ESCC | protein secretion | 190/8552 | 359/18723 | 3.22e-03 | 1.34e-02 | 190 |
| GO:003559217 | Esophagus | ESCC | establishment of protein localization to extracellular region | 190/8552 | 360/18723 | 3.77e-03 | 1.53e-02 | 190 |
| GO:007169210 | Esophagus | ESCC | protein localization to extracellular region | 193/8552 | 368/18723 | 5.01e-03 | 1.92e-02 | 193 |
| GO:0009100 | Liver | HCC | glycoprotein metabolic process | 193/7958 | 387/18723 | 1.89e-03 | 9.62e-03 | 193 |
| GO:003559212 | Liver | HCC | establishment of protein localization to extracellular region | 176/7958 | 360/18723 | 7.96e-03 | 3.15e-02 | 176 |
| GO:000930612 | Liver | HCC | protein secretion | 175/7958 | 359/18723 | 9.32e-03 | 3.57e-02 | 175 |
| GO:00091001 | Oral cavity | OSCC | glycoprotein metabolic process | 185/7305 | 387/18723 | 2.37e-04 | 1.54e-03 | 185 |
| GO:00091011 | Oral cavity | OSCC | glycoprotein biosynthetic process | 151/7305 | 317/18723 | 1.01e-03 | 5.26e-03 | 151 |
| GO:000930610 | Oral cavity | OSCC | protein secretion | 169/7305 | 359/18723 | 1.04e-03 | 5.34e-03 | 169 |
| GO:003559210 | Oral cavity | OSCC | establishment of protein localization to extracellular region | 169/7305 | 360/18723 | 1.21e-03 | 6.08e-03 | 169 |
| GO:00429823 | Oral cavity | OSCC | amyloid precursor protein metabolic process | 52/7305 | 95/18723 | 1.33e-03 | 6.62e-03 | 52 |
| GO:00716929 | Oral cavity | OSCC | protein localization to extracellular region | 172/7305 | 368/18723 | 1.40e-03 | 6.79e-03 | 172 |
| GO:004298211 | Oral cavity | LP | amyloid precursor protein metabolic process | 37/4623 | 95/18723 | 1.45e-03 | 1.14e-02 | 37 |
| GO:007169214 | Prostate | Tumor | protein localization to extracellular region | 89/3246 | 368/18723 | 4.80e-04 | 3.57e-03 | 89 |
| GO:000930615 | Prostate | Tumor | protein secretion | 87/3246 | 359/18723 | 5.15e-04 | 3.78e-03 | 87 |
| GO:003559215 | Prostate | Tumor | establishment of protein localization to extracellular region | 87/3246 | 360/18723 | 5.65e-04 | 4.10e-03 | 87 |
| GO:00429821 | Prostate | Tumor | amyloid precursor protein metabolic process | 29/3246 | 95/18723 | 1.12e-03 | 7.14e-03 | 29 |
| Page: 1 |
| Pathway ID | Tissue | Disease Stage | Description | Gene Ratio | Bg Ratio | pvalue | p.adjust | qvalue | Count |
| Page: 1 |
Top |
Cell-cell communication analysis |
| Identification of potential cell-cell interactions between two cell types and their ligand-receptor pairs for different disease states |
| Ligand | Receptor | LRpair | Pathway | Tissue | Disease Stage |
| Page: 1 |
Top |
Single-cell gene regulatory network inference analysis |
| Find out the significant the regulons (TFs) and the target genes of each regulon across cell types for different disease states |
| TF | Cell Type | Tissue | Disease Stage | Target Gene | RSS | Regulon Activity |
| ∗The dot plots of a searched regulon are shown for all cell subpopulations in each disease state of each tissue based on the regulon specific score inferred using pySCENIC and by calculating the average expression. |
| Page: 1 |
Top |
Somatic mutation of malignant transformation related genes |
| Annotation of somatic variants for genes involved in malignant transformation |
| Hugo Symbol | Variant Class | Variant Classification | dbSNP RS | HGVSc | HGVSp | HGVSp Short | SWISSPROT | BIOTYPE | SIFT | PolyPhen | Tumor Sample Barcode | Tissue | Histology | Sex | Age | Stage | Therapy Types | Drugs | Outcome |
| NECAB3 | SNV | Missense_Mutation | rs778131621 | c.950N>A | p.Arg317His | p.R317H | Q96P71 | protein_coding | tolerated(0.07) | probably_damaging(0.911) | TCGA-2W-A8YY-01 | Cervix | cervical & endocervical cancer | Female | <65 | I/II | Chemotherapy | cisplatin | CR |
| NECAB3 | SNV | Missense_Mutation | c.803N>A | p.Gly268Asp | p.G268D | Q96P71 | protein_coding | tolerated(0.36) | benign(0.089) | TCGA-A6-A565-01 | Colorectum | colon adenocarcinoma | Female | <65 | III/IV | Unspecific | 5FU | PD | |
| NECAB3 | SNV | Missense_Mutation | c.1109N>C | p.Ile370Thr | p.I370T | Q96P71 | protein_coding | tolerated(0.41) | benign(0.009) | TCGA-AA-3821-01 | Colorectum | colon adenocarcinoma | Female | >=65 | I/II | Unknown | Unknown | SD | |
| NECAB3 | SNV | Missense_Mutation | rs772875114 | c.688N>T | p.Arg230Cys | p.R230C | Q96P71 | protein_coding | deleterious(0) | probably_damaging(0.998) | TCGA-AA-3877-01 | Colorectum | colon adenocarcinoma | Female | >=65 | I/II | Unknown | Unknown | SD |
| NECAB3 | SNV | Missense_Mutation | rs759250635 | c.242N>A | p.Gly81Asp | p.G81D | Q96P71 | protein_coding | tolerated(0.13) | benign(0.15) | TCGA-CK-4951-01 | Colorectum | colon adenocarcinoma | Female | >=65 | I/II | Unknown | Unknown | PD |
| NECAB3 | SNV | Missense_Mutation | c.523N>T | p.Arg175Trp | p.R175W | Q96P71 | protein_coding | deleterious(0.03) | benign(0.049) | TCGA-CM-4746-01 | Colorectum | colon adenocarcinoma | Male | <65 | I/II | Unknown | Unknown | SD | |
| NECAB3 | SNV | Missense_Mutation | rs777446950 | c.524G>A | p.Arg175Gln | p.R175Q | Q96P71 | protein_coding | tolerated(0.05) | benign(0.217) | TCGA-D5-6924-01 | Colorectum | colon adenocarcinoma | Male | >=65 | I/II | Unknown | Unknown | SD |
| NECAB3 | SNV | Missense_Mutation | c.583N>T | p.Arg195Cys | p.R195C | Q96P71 | protein_coding | deleterious(0) | probably_damaging(0.987) | TCGA-G4-6309-01 | Colorectum | colon adenocarcinoma | Female | <65 | III/IV | Chemotherapy | xeloda | PD | |
| NECAB3 | SNV | Missense_Mutation | c.239G>T | p.Ser80Ile | p.S80I | Q96P71 | protein_coding | tolerated(0.37) | benign(0.342) | TCGA-AG-A002-01 | Colorectum | rectum adenocarcinoma | Male | <65 | I/II | Unknown | Unknown | SD | |
| NECAB3 | SNV | Missense_Mutation | novel | c.436N>A | p.Leu146Met | p.L146M | Q96P71 | protein_coding | deleterious(0.01) | probably_damaging(1) | TCGA-A5-A0G2-01 | Endometrium | uterine corpus endometrioid carcinoma | Female | <65 | III/IV | Unknown | Unknown | SD |
| Page: 1 2 3 |
Top |
Related drugs of malignant transformation related genes |
| Identification of chemicals and drugs interact with genes involved in malignant transfromation |
| (DGIdb 4.0) |
| Entrez ID | Symbol | Category | Interaction Types | Drug Claim Name | Drug Name | PMIDs |
| Page: 1 |

Copyright 2023-Present -The University of Texas Health Science Center at Houston |