
|
|||||
|
 | |
| |
| |
| |
| |
| |
|
Gene: NECAB1 |
Gene summary for NECAB1 |
| Gene information | Species | Human | Gene symbol | NECAB1 | Gene ID | 64168 |
| Gene name | N-terminal EF-hand calcium binding protein 1 | |
| Gene Alias | EFCBP1 | |
| Cytomap | 8q21.3 | |
| Gene Type | protein-coding | GO ID | GO:0001701 | UniProtAcc | Q8N987 |
Top |
Malignant transformation analysis |
| Identification of the aberrant gene expression in precancerous and cancerous lesions by comparing the gene expression of stem-like cells in diseased tissues with normal stem cells |
| Entrez ID | Symbol | Replicates | Species | Organ | Tissue | Adj P-value | Log2FC | Malignancy |
| 64168 | NECAB1 | RNA-P25T1-P25T1-1 | Human | Lung | AIS | 1.13e-08 | 6.38e-01 | -0.2116 |
| 64168 | NECAB1 | RNA-P25T1-P25T1-2 | Human | Lung | AIS | 1.53e-05 | 7.47e-01 | -0.1941 |
| 64168 | NECAB1 | RNA-P25T1-P25T1-3 | Human | Lung | AIS | 4.56e-04 | 6.58e-01 | -0.2107 |
| 64168 | NECAB1 | RNA-P25T1-P25T1-4 | Human | Lung | AIS | 1.53e-11 | 7.50e-01 | -0.2119 |
| Page: 1 |
| Tissue | Expression Dynamics | Abbreviation |
| Lung | 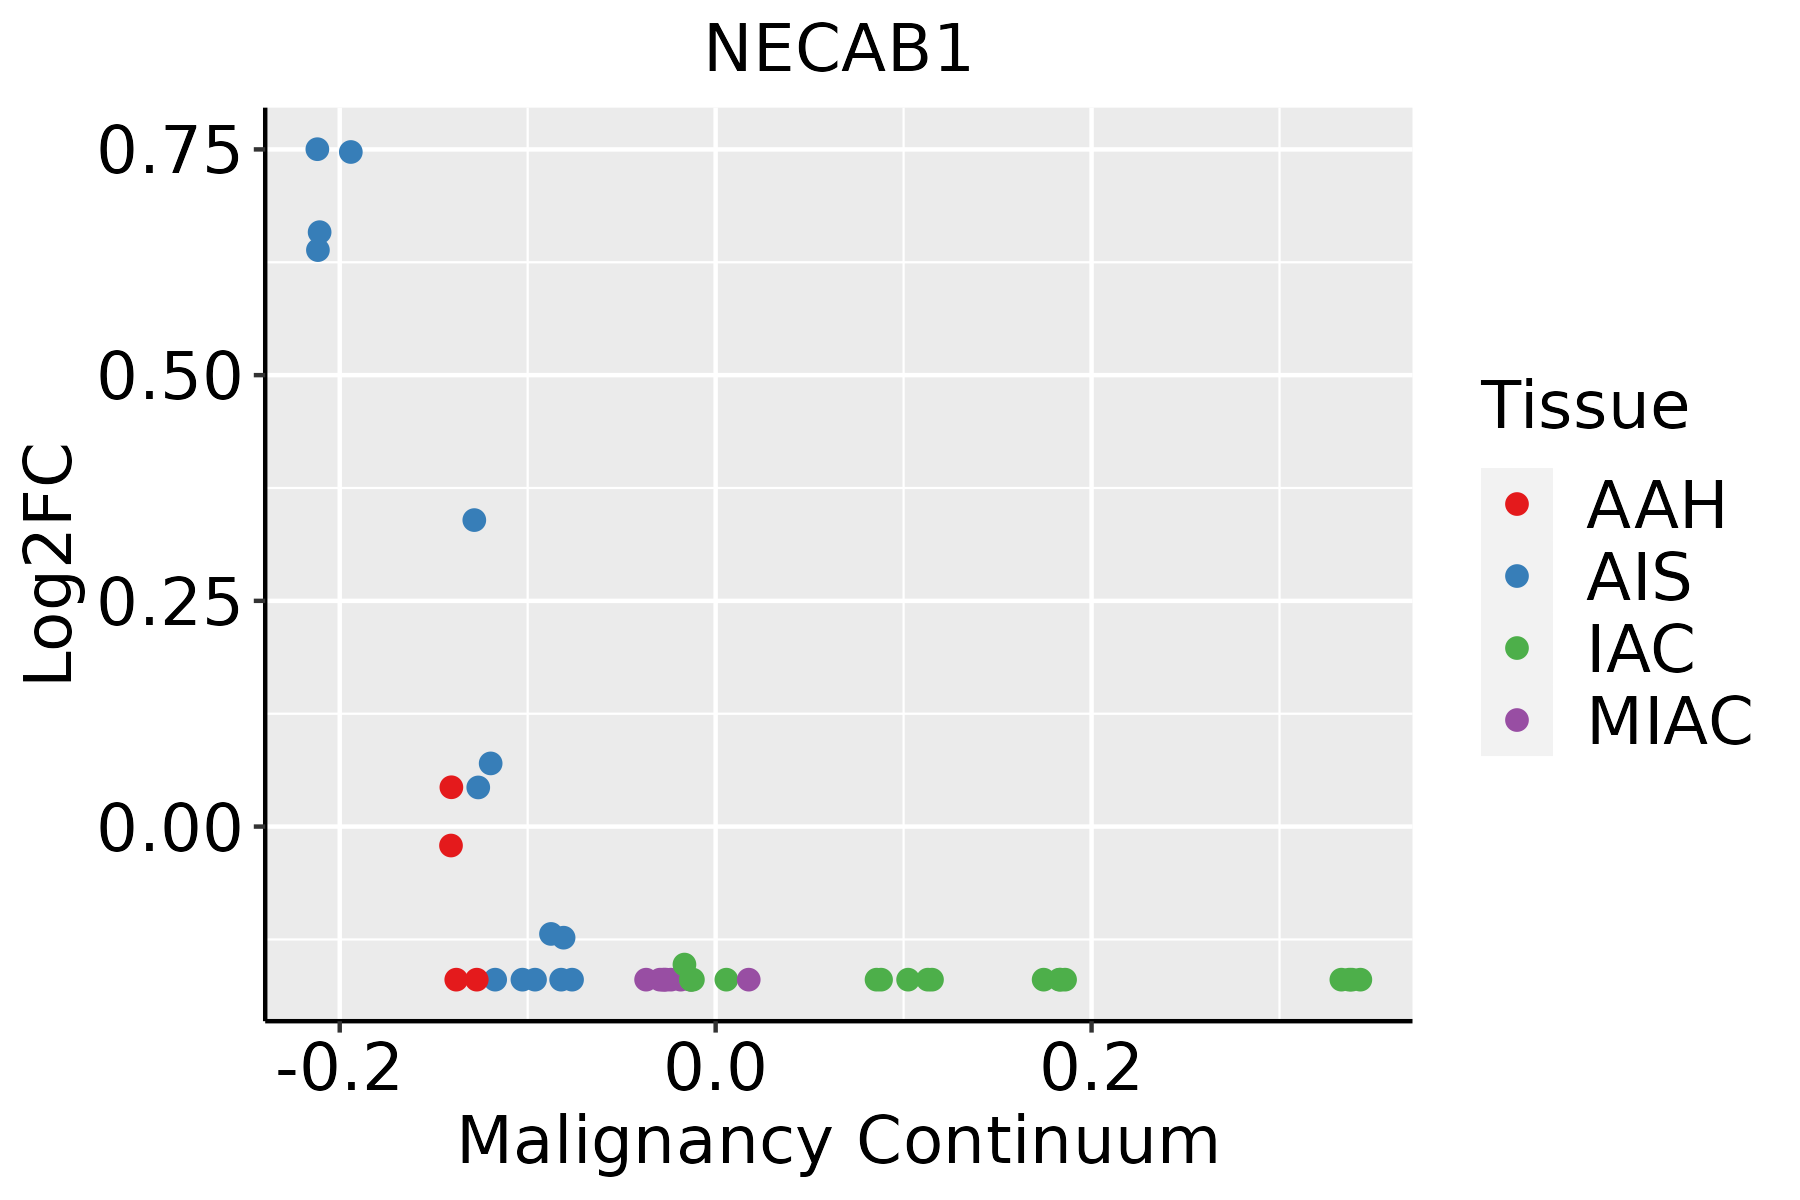 | AAH: Atypical adenomatous hyperplasia |
| AIS: Adenocarcinoma in situ | ||
| IAC: Invasive lung adenocarcinoma | ||
| MIA: Minimally invasive adenocarcinoma |
| ∗log2FC in expression of this searched gene in stem-like cells from each diseased tissue sample relative to stem-like cells in normal samples in each tissue plotted against the malignancy continuum. Samples are colored based on if they are from different disease stage. |
Top |
Malignant transformation related pathway analysis |
| Find out the enriched GO biological processes and KEGG pathways involved in transition from healthy to precancer to cancer |
| Tissue | Disease Stage | Enriched GO biological Processes |
| Colorectum | AD |  |
| Colorectum | SER |  |
| Colorectum | MSS |  |
| Colorectum | MSI-H |  |
| Colorectum | FAP |  |
| ∗Top 15 enriched GO BP terms are showed in the bar plot of each disease state in each tissue. Each row represents a significant GO biological process which is colored according to the -log10(p.adjust). |
| Page: 1 2 3 4 5 6 7 8 9 |
| GO ID | Tissue | Disease Stage | Description | Gene Ratio | Bg Ratio | pvalue | p.adjust | Count |
| GO:000170112 | Lung | AIS | in utero embryonic development | 59/1849 | 367/18723 | 1.20e-04 | 2.75e-03 | 59 |
| Page: 1 |
| Pathway ID | Tissue | Disease Stage | Description | Gene Ratio | Bg Ratio | pvalue | p.adjust | qvalue | Count |
| Page: 1 |
Top |
Cell-cell communication analysis |
| Identification of potential cell-cell interactions between two cell types and their ligand-receptor pairs for different disease states |
| Ligand | Receptor | LRpair | Pathway | Tissue | Disease Stage |
| Page: 1 |
Top |
Single-cell gene regulatory network inference analysis |
| Find out the significant the regulons (TFs) and the target genes of each regulon across cell types for different disease states |
| TF | Cell Type | Tissue | Disease Stage | Target Gene | RSS | Regulon Activity |
| ∗The dot plots of a searched regulon are shown for all cell subpopulations in each disease state of each tissue based on the regulon specific score inferred using pySCENIC and by calculating the average expression. |
| Page: 1 |
Top |
Somatic mutation of malignant transformation related genes |
| Annotation of somatic variants for genes involved in malignant transformation |
| Hugo Symbol | Variant Class | Variant Classification | dbSNP RS | HGVSc | HGVSp | HGVSp Short | SWISSPROT | BIOTYPE | SIFT | PolyPhen | Tumor Sample Barcode | Tissue | Histology | Sex | Age | Stage | Therapy Types | Drugs | Outcome |
| NECAB1 | SNV | Missense_Mutation | c.455N>A | p.Cys152Tyr | p.C152Y | Q8N987 | protein_coding | deleterious(0) | possibly_damaging(0.648) | TCGA-A8-A08F-01 | Breast | breast invasive carcinoma | Female | <65 | III/IV | Chemotherapy | 5-fluorouracil | CR | |
| NECAB1 | SNV | Missense_Mutation | c.140N>A | p.Ser47Tyr | p.S47Y | Q8N987 | protein_coding | deleterious(0) | probably_damaging(1) | TCGA-AR-A0TV-01 | Breast | breast invasive carcinoma | Female | >=65 | I/II | Unknown | Unknown | SD | |
| NECAB1 | SNV | Missense_Mutation | c.307N>T | p.Leu103Phe | p.L103F | Q8N987 | protein_coding | deleterious(0.03) | probably_damaging(0.963) | TCGA-BH-A0HF-01 | Breast | breast invasive carcinoma | Female | >=65 | I/II | Hormone Therapy | arimidex | SD | |
| NECAB1 | SNV | Missense_Mutation | c.548N>T | p.Ser183Leu | p.S183L | Q8N987 | protein_coding | tolerated(0.36) | benign(0) | TCGA-C8-A27A-01 | Breast | breast invasive carcinoma | Female | <65 | I/II | Chemotherapy | 5-fluorouracil | CR | |
| NECAB1 | SNV | Missense_Mutation | rs556182182 | c.694N>A | p.Asp232Asn | p.D232N | Q8N987 | protein_coding | tolerated(0.19) | benign(0.107) | TCGA-LD-A74U-01 | Breast | breast invasive carcinoma | Female | >=65 | III/IV | Chemotherapy | taxotere | SD |
| NECAB1 | SNV | Missense_Mutation | novel | c.23N>T | p.Ser8Leu | p.S8L | Q8N987 | protein_coding | deleterious_low_confidence(0.02) | possibly_damaging(0.885) | TCGA-PE-A5DE-01 | Breast | breast invasive carcinoma | Female | <65 | I/II | Chemotherapy | taxotere | CR |
| NECAB1 | insertion | Nonsense_Mutation | novel | c.817_818insTGAAATCTAGTTGTTTGTAATGATTGTCACTTATGTCT | p.Lys273MetfsTer7 | p.K273Mfs*7 | Q8N987 | protein_coding | TCGA-A2-A0EV-01 | Breast | breast invasive carcinoma | Female | >=65 | I/II | Unknown | Unknown | SD | ||
| NECAB1 | SNV | Missense_Mutation | novel | c.863N>G | p.Ile288Ser | p.I288S | Q8N987 | protein_coding | deleterious(0) | benign(0.398) | TCGA-EA-A3HU-01 | Cervix | cervical & endocervical cancer | Female | <65 | I/II | Unknown | Unknown | SD |
| NECAB1 | SNV | Missense_Mutation | c.115N>C | p.Asp39His | p.D39H | Q8N987 | protein_coding | deleterious(0) | probably_damaging(0.965) | TCGA-IR-A3LK-01 | Cervix | cervical & endocervical cancer | Female | >=65 | I/II | Chemotherapy | cisplatin | PD | |
| NECAB1 | SNV | Missense_Mutation | novel | c.178C>G | p.Leu60Val | p.L60V | Q8N987 | protein_coding | deleterious(0.01) | probably_damaging(0.994) | TCGA-5M-AATE-01 | Colorectum | colon adenocarcinoma | Male | >=65 | I/II | Unknown | Unknown | PD |
| Page: 1 2 3 4 5 |
Top |
Related drugs of malignant transformation related genes |
| Identification of chemicals and drugs interact with genes involved in malignant transfromation |
| (DGIdb 4.0) |
| Entrez ID | Symbol | Category | Interaction Types | Drug Claim Name | Drug Name | PMIDs |
| Page: 1 |

Copyright 2023-Present -The University of Texas Health Science Center at Houston |