| Tissue | Expression Dynamics | Abbreviation |
| Cervix | 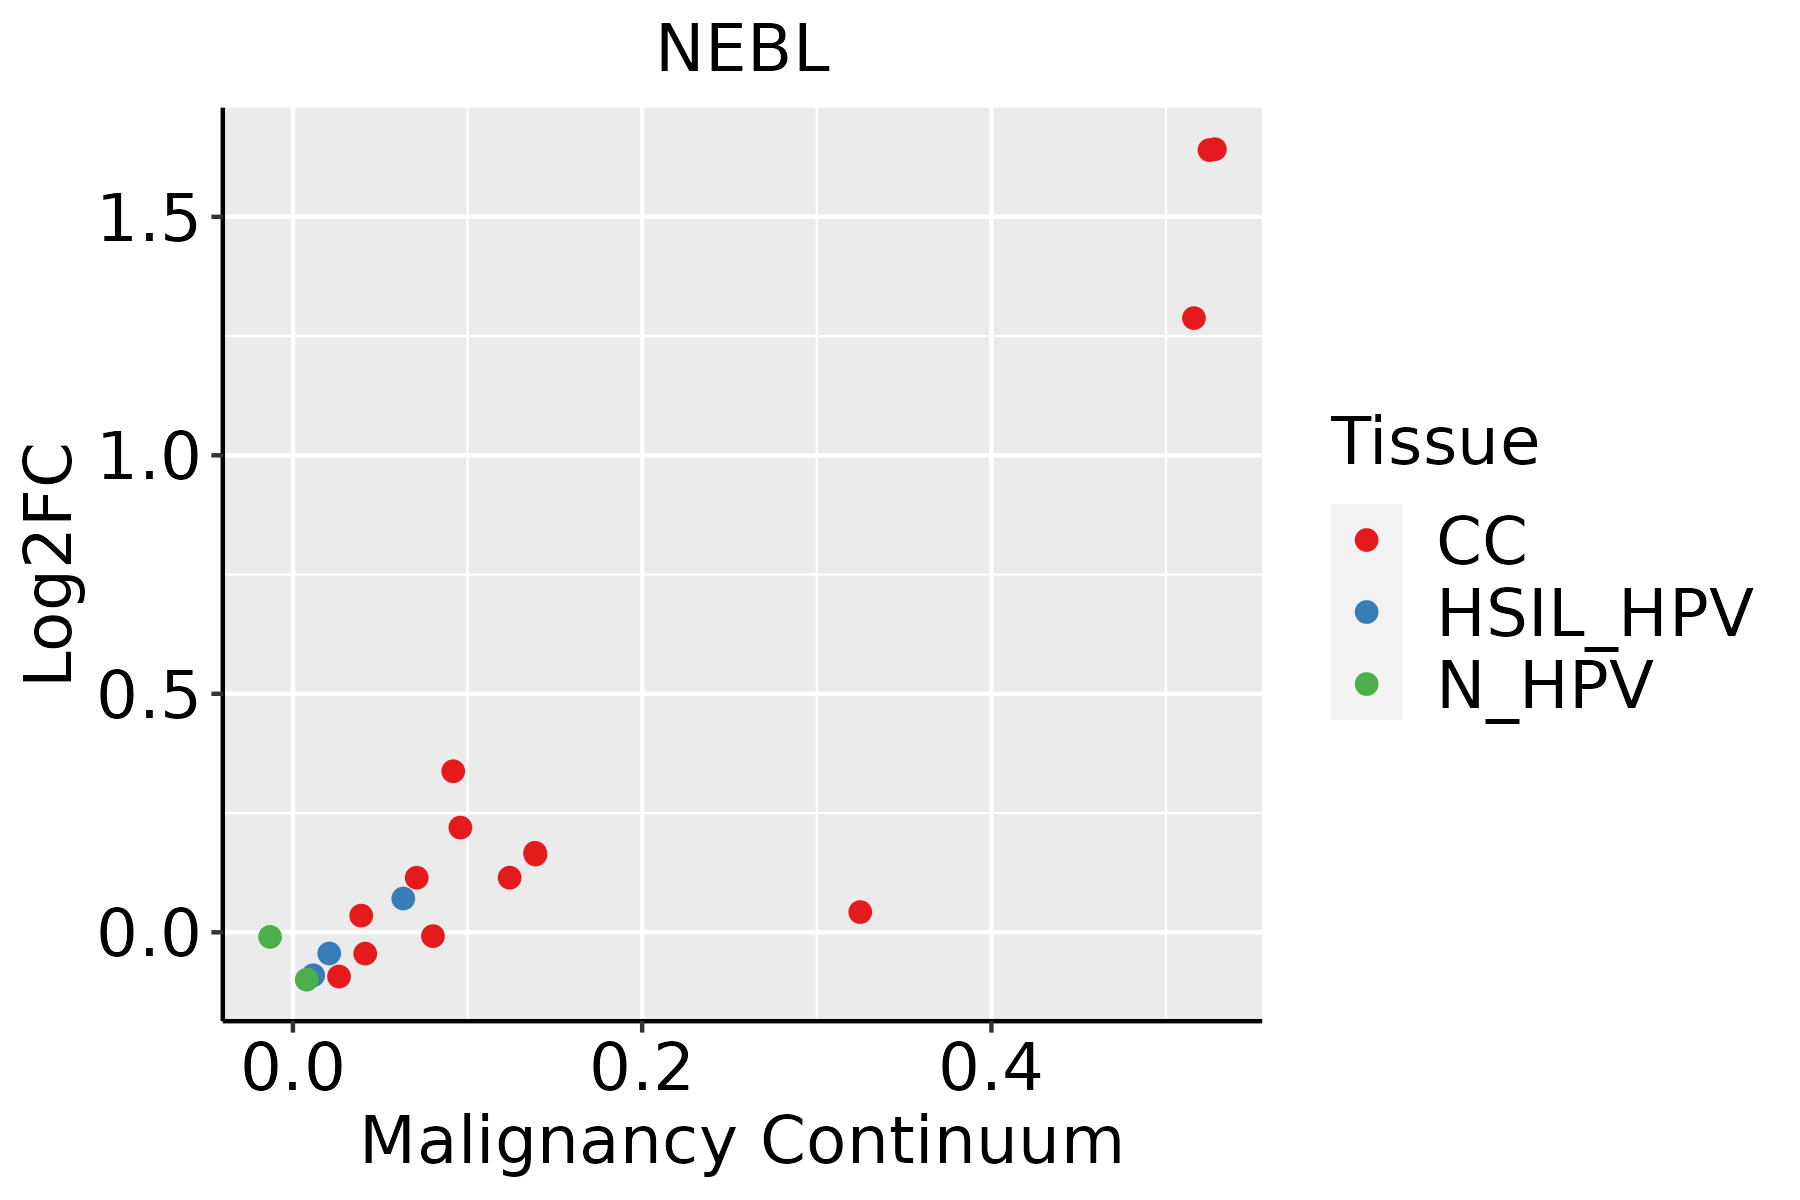 | CC: Cervix cancer |
| HSIL_HPV: HPV-infected high-grade squamous intraepithelial lesions |
| N_HPV: HPV-infected normal cervix |
| Colorectum (GSE201348) |  | FAP: Familial adenomatous polyposis |
| CRC: Colorectal cancer |
| Colorectum (HTA11) |  | AD: Adenomas |
| SER: Sessile serrated lesions |
| MSI-H: Microsatellite-high colorectal cancer |
| MSS: Microsatellite stable colorectal cancer |
| Endometrium |  | AEH: Atypical endometrial hyperplasia |
| EEC: Endometrioid Cancer |
| Esophagus | 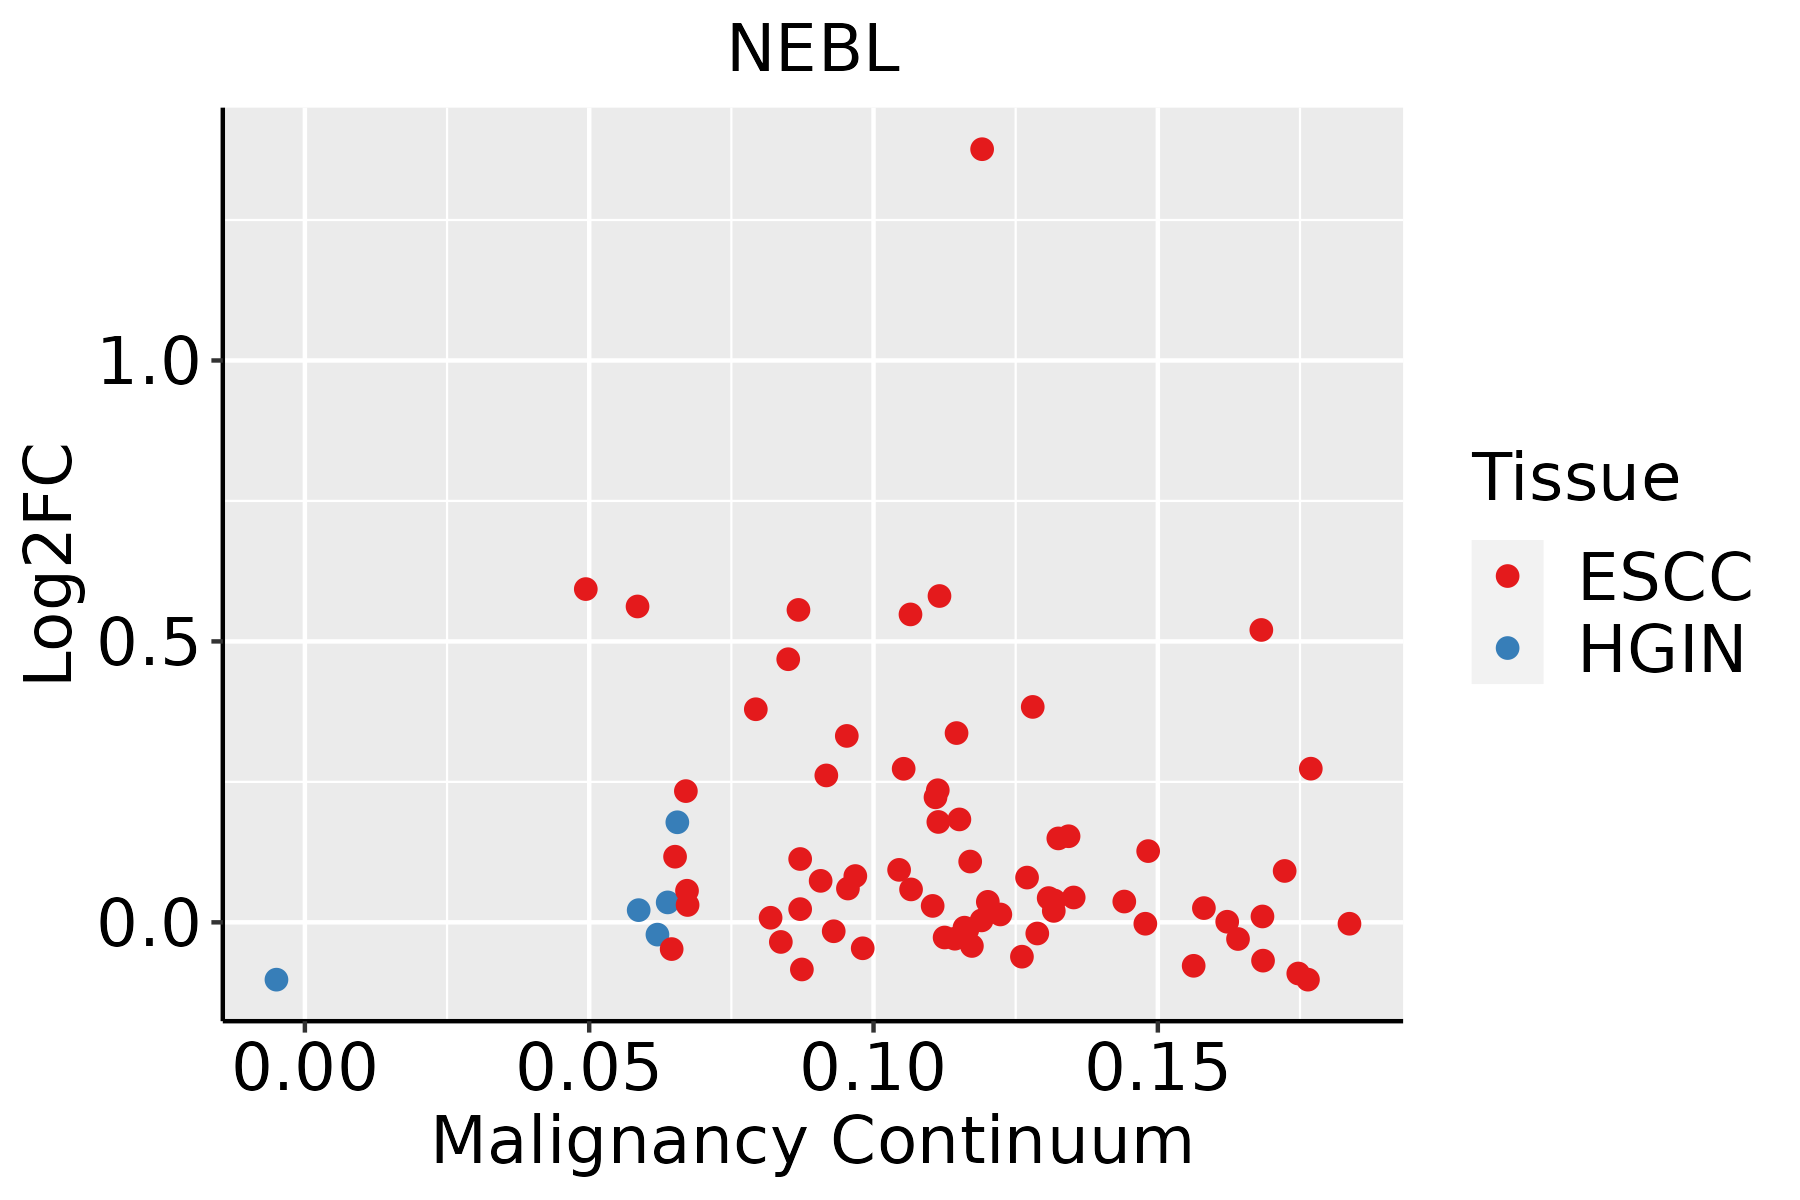 | ESCC: Esophageal squamous cell carcinoma |
| HGIN: High-grade intraepithelial neoplasias |
| LGIN: Low-grade intraepithelial neoplasias |
| Lung | 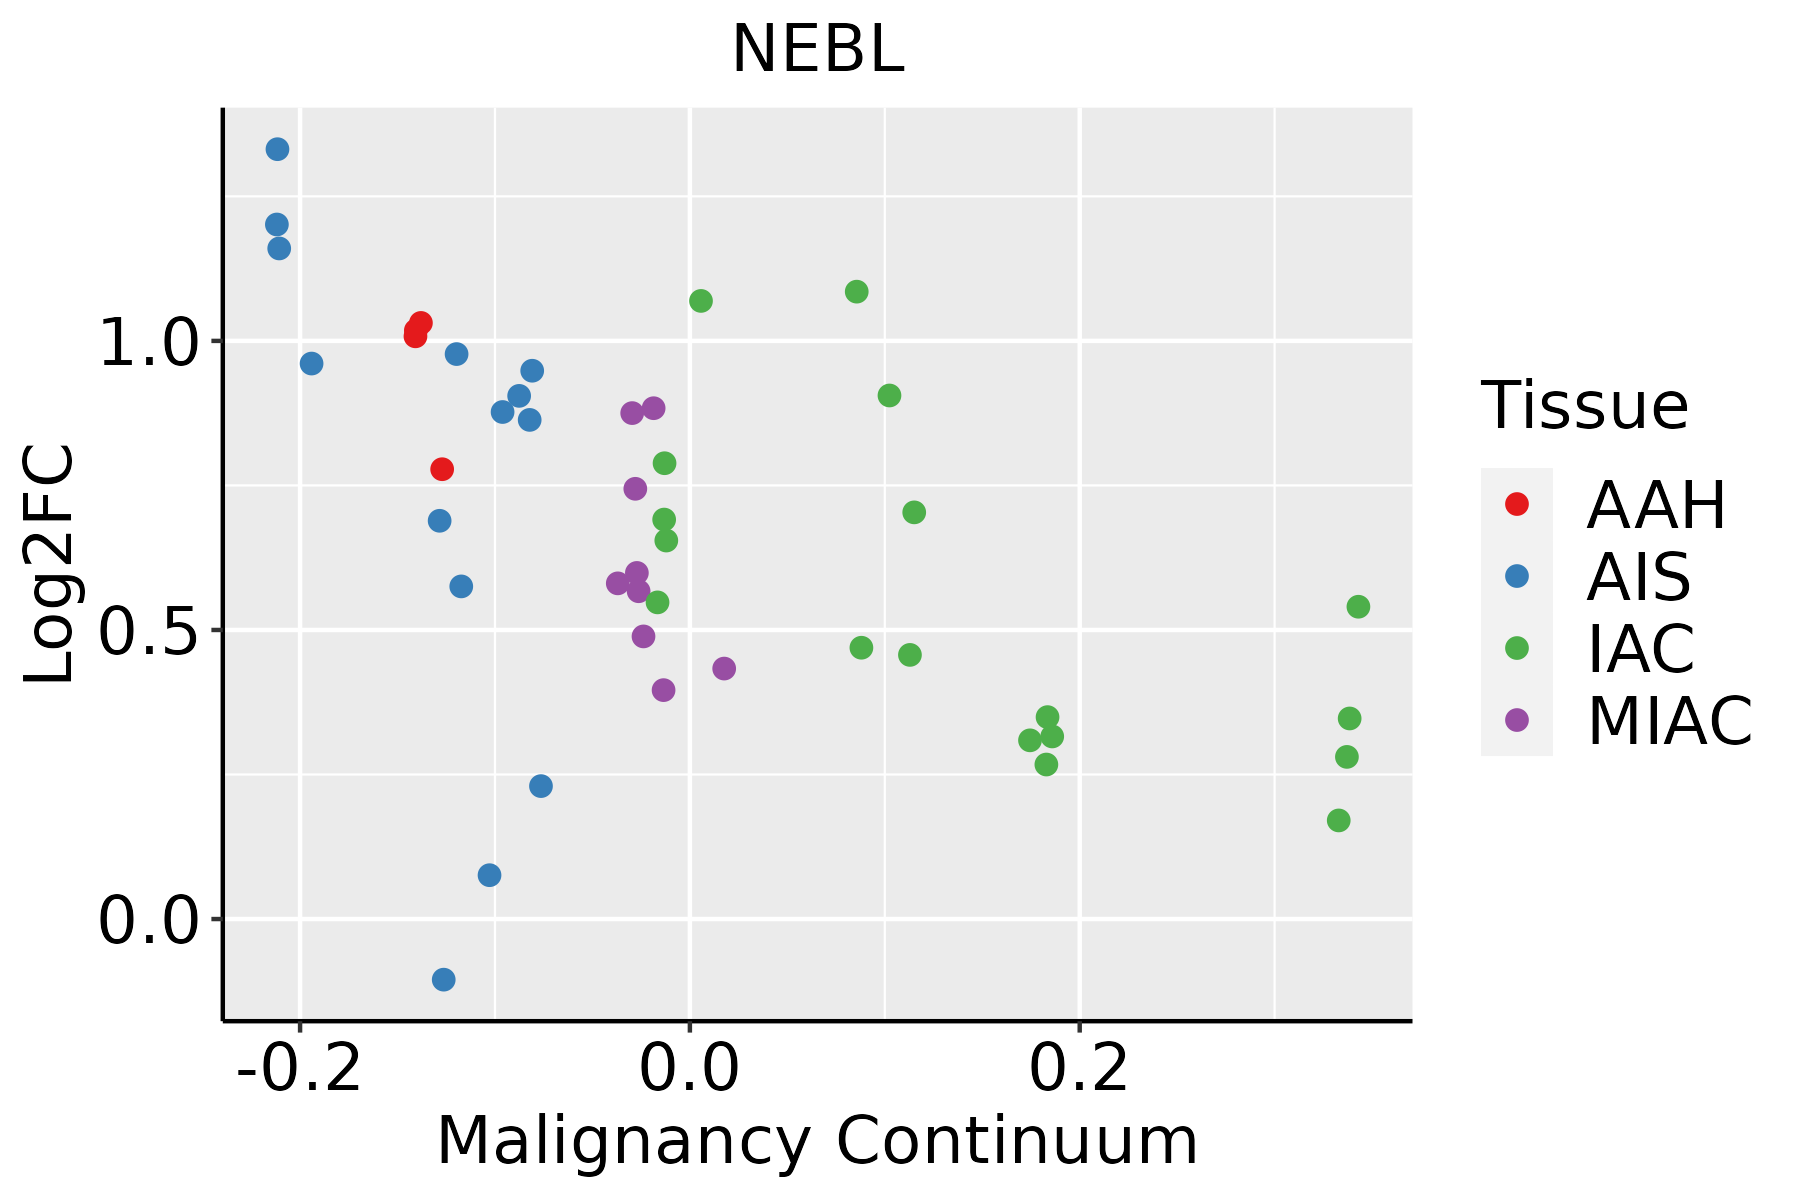 | AAH: Atypical adenomatous hyperplasia |
| AIS: Adenocarcinoma in situ |
| IAC: Invasive lung adenocarcinoma |
| MIA: Minimally invasive adenocarcinoma |
| Prostate | 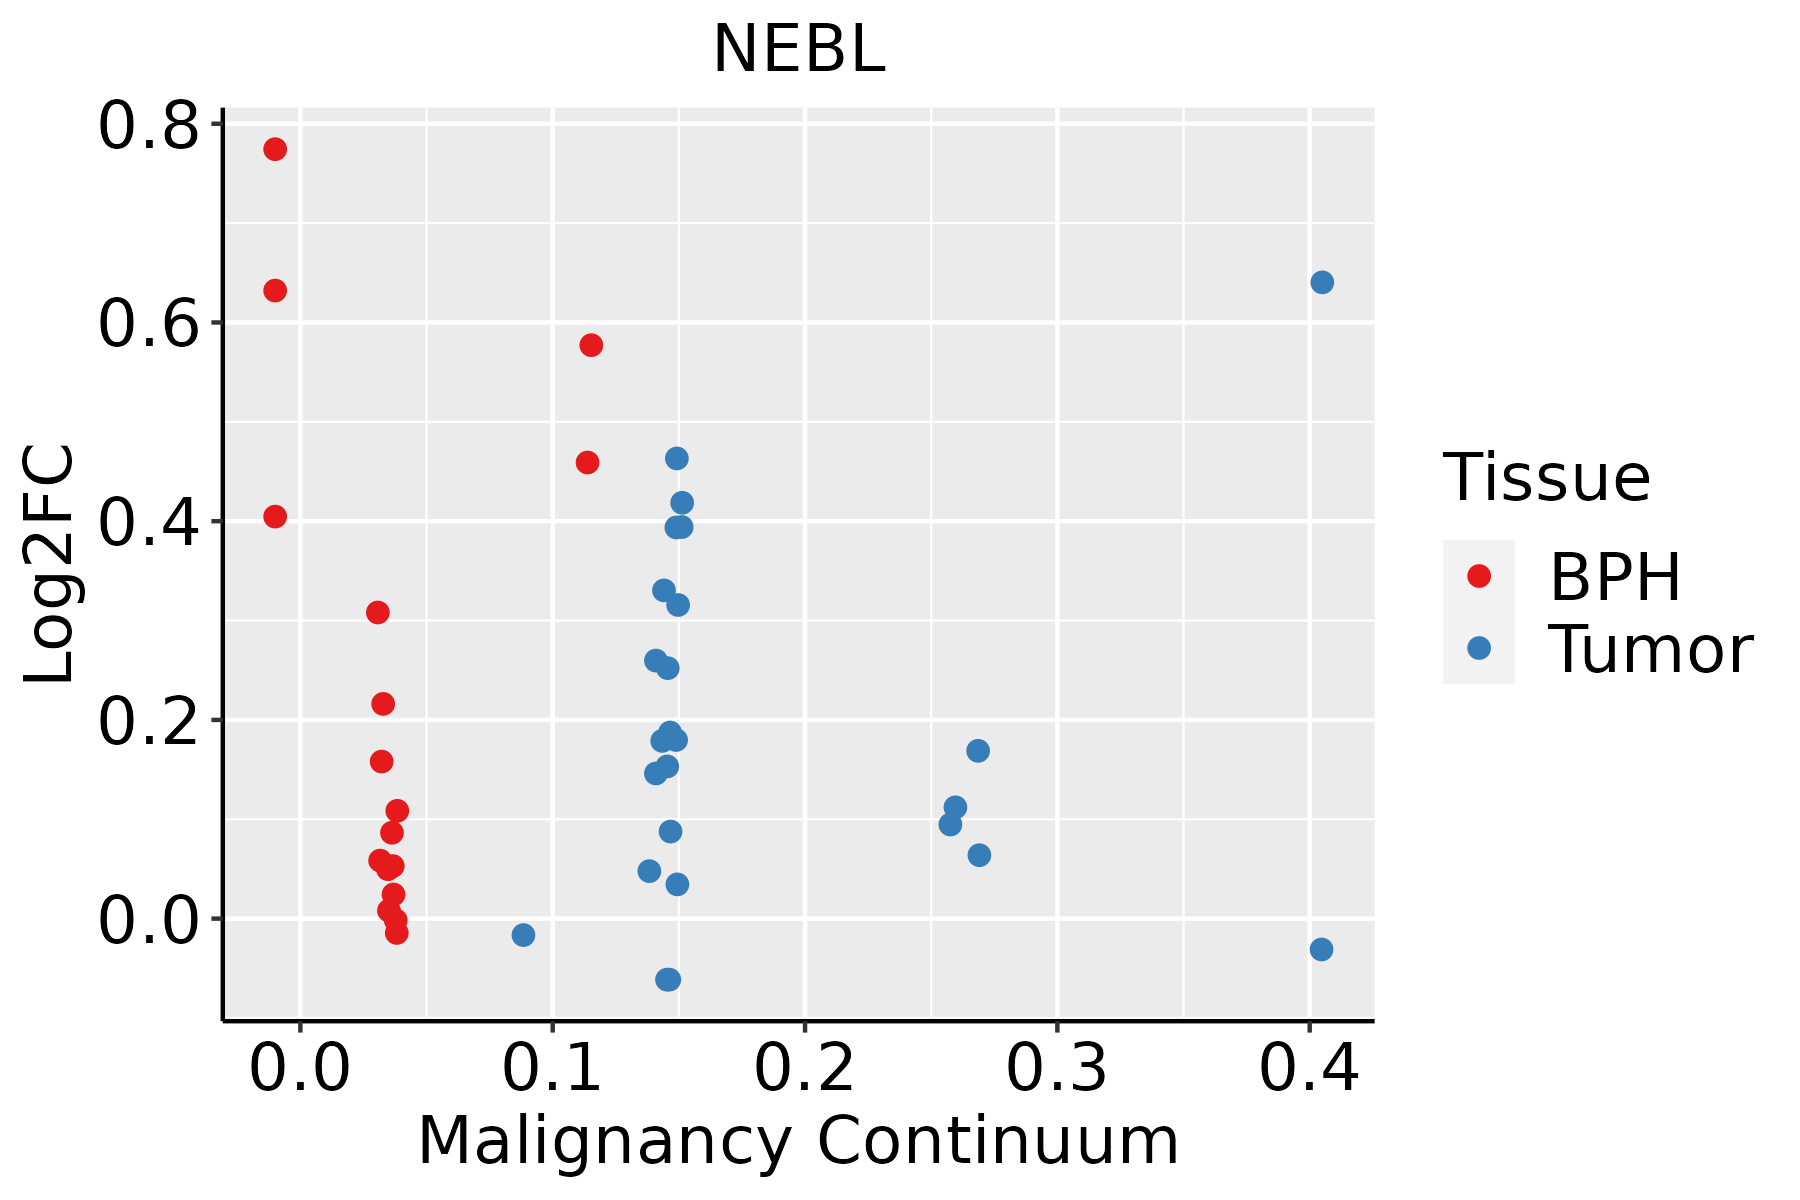 | BPH: Benign Prostatic Hyperplasia |
| Skin | 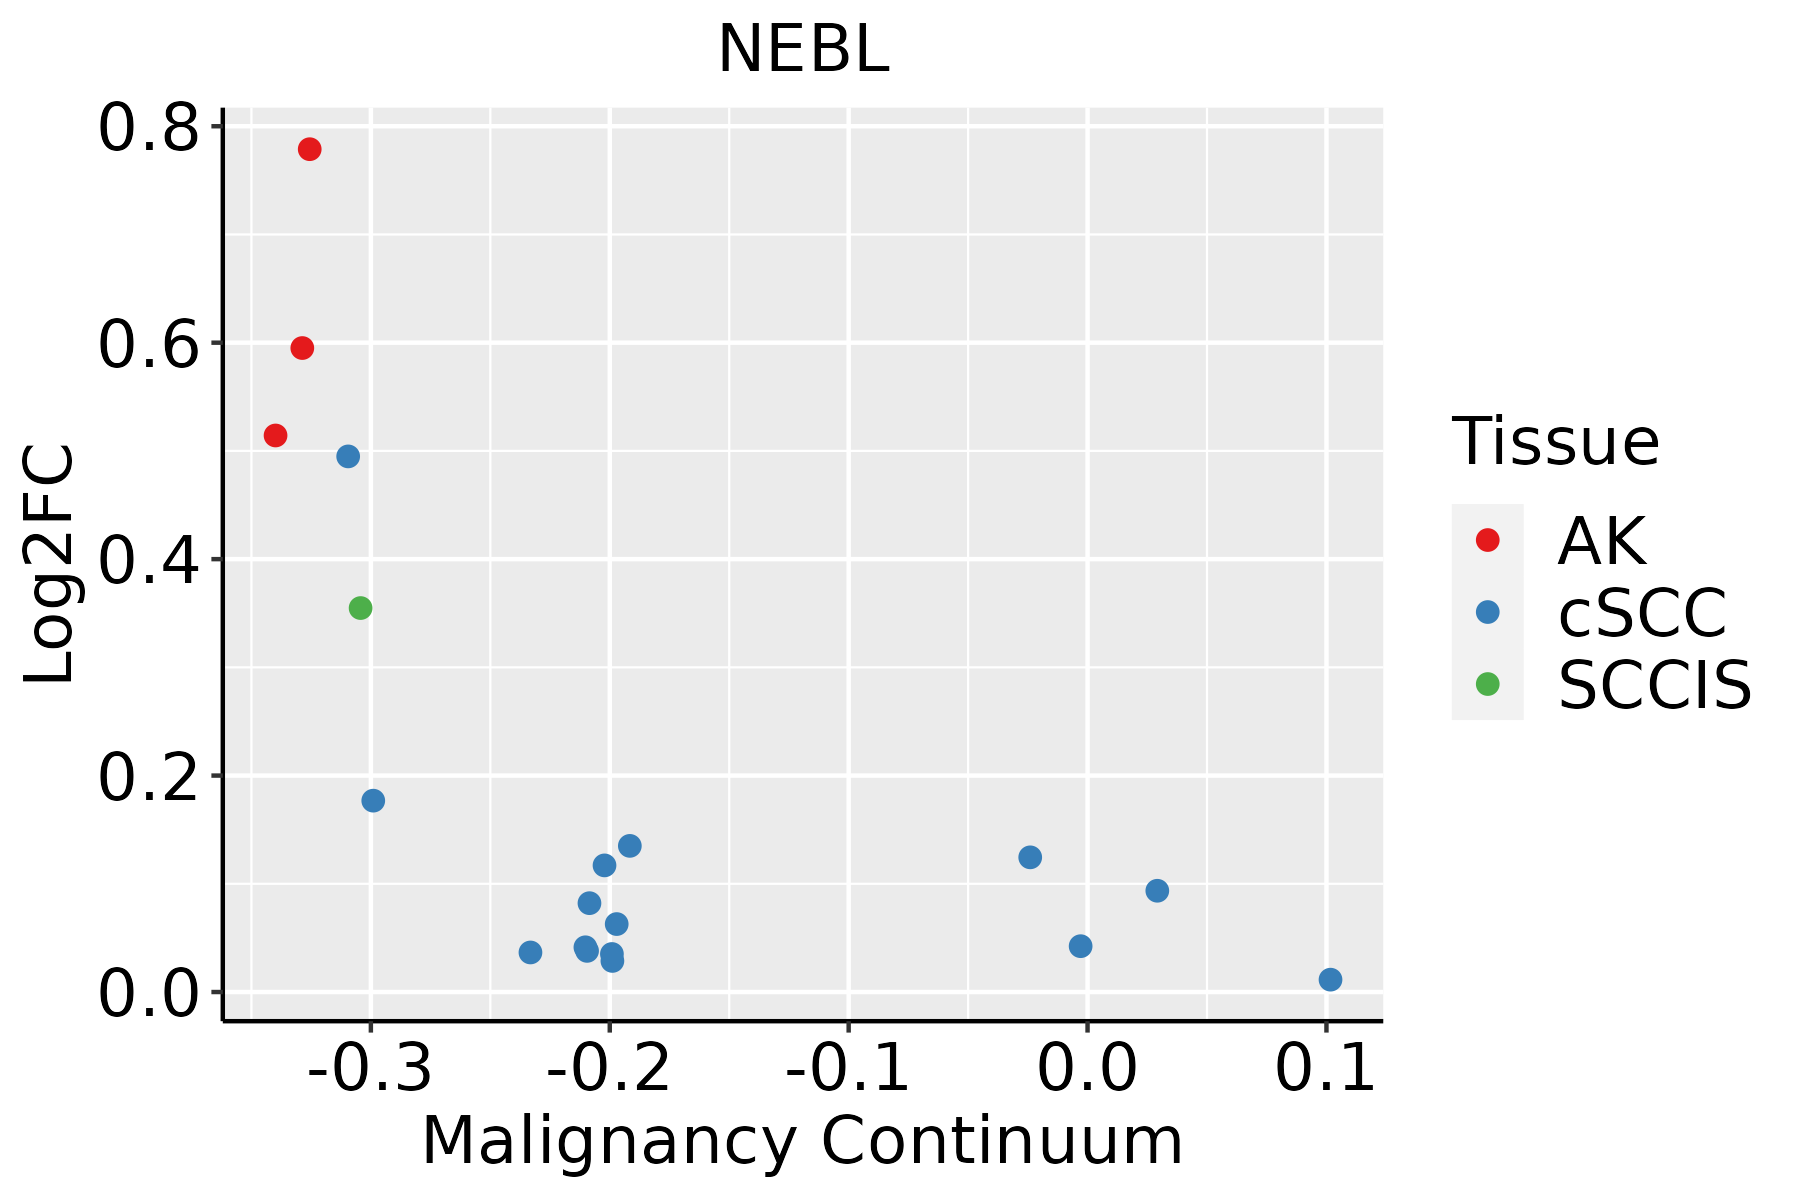 | AK: Actinic keratosis |
| cSCC: Cutaneous squamous cell carcinoma |
| SCCIS:squamous cell carcinoma in situ |
| Thyroid | 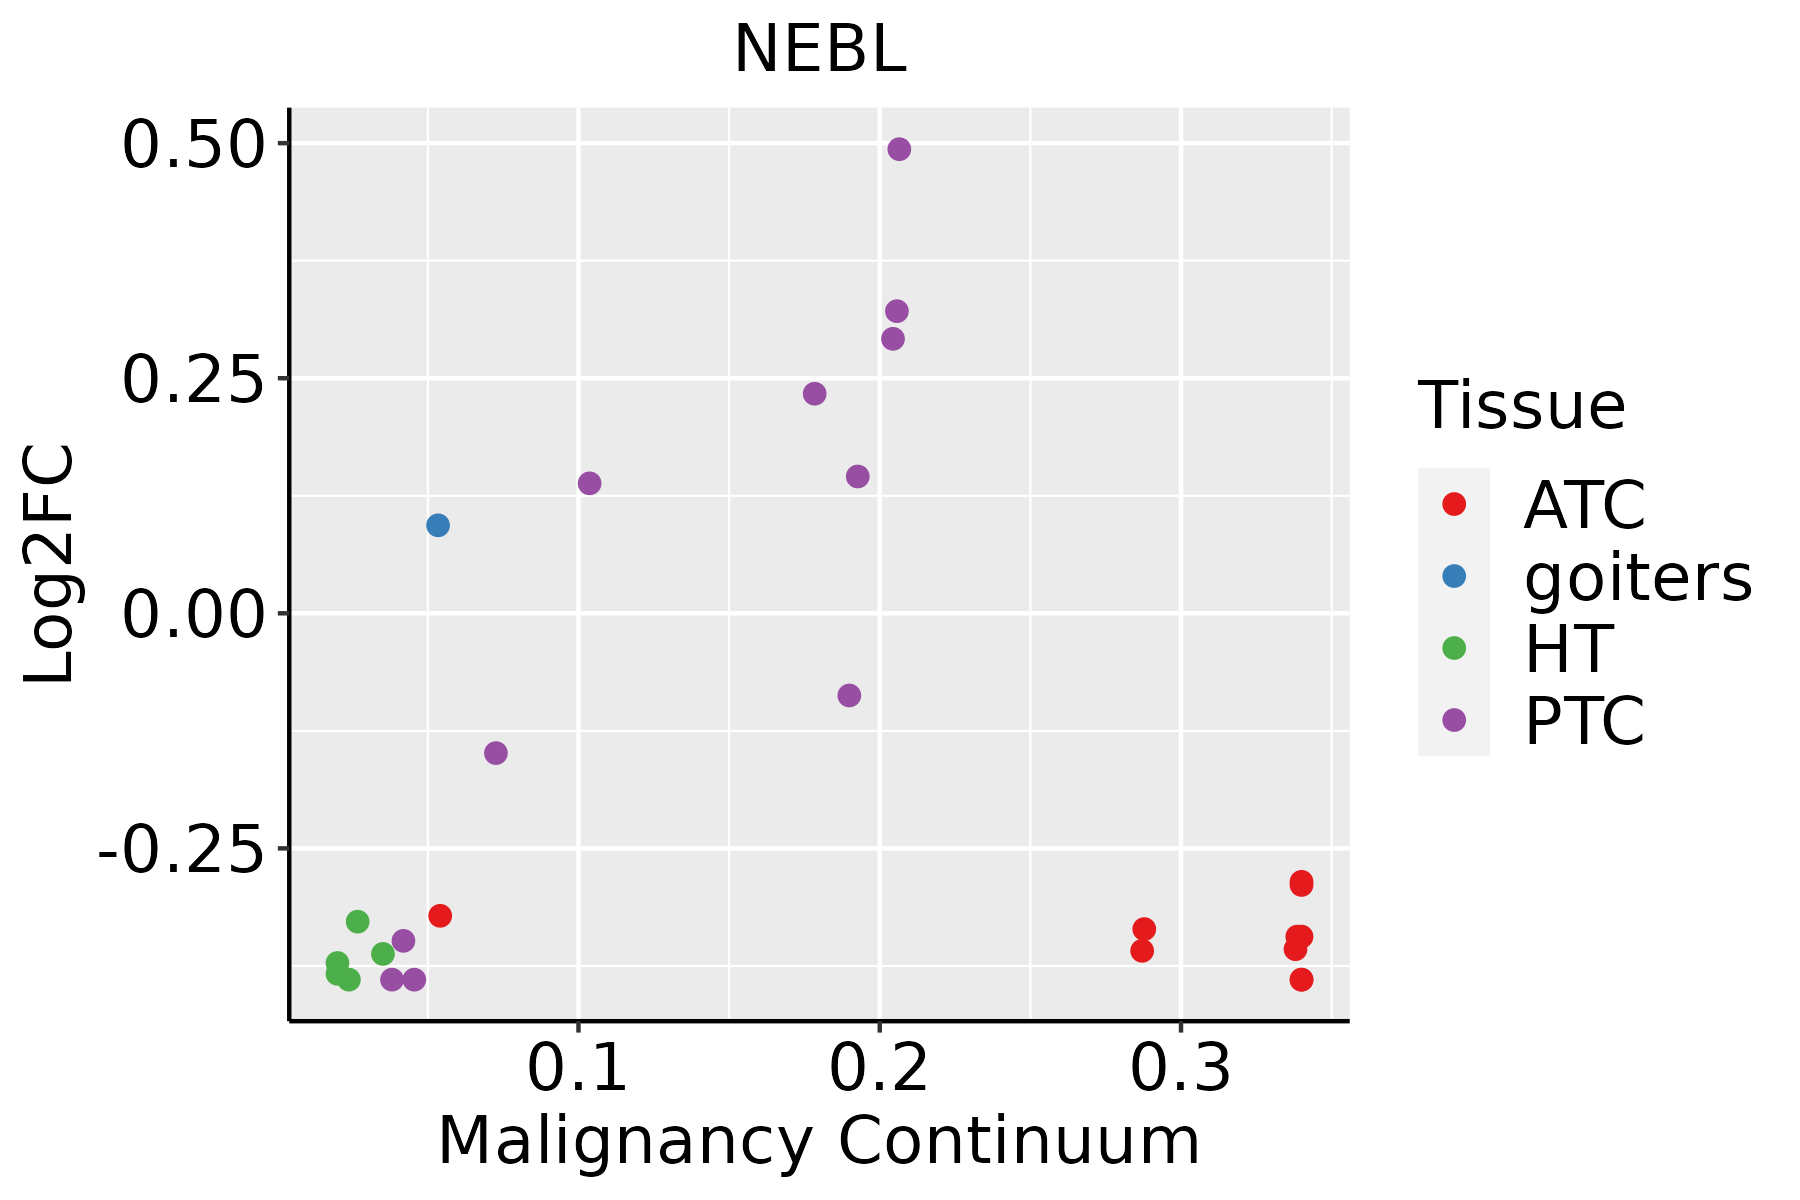 | ATC: Anaplastic thyroid cancer |
| HT: Hashimoto's thyroiditis |
| PTC: Papillary thyroid cancer |
| GO ID | Tissue | Disease Stage | Description | Gene Ratio | Bg Ratio | pvalue | p.adjust | Count |
| GO:000701510 | Cervix | CC | actin filament organization | 109/2311 | 442/18723 | 4.92e-13 | 2.45e-10 | 109 |
| GO:00605375 | Cervix | CC | muscle tissue development | 76/2311 | 403/18723 | 9.76e-05 | 1.27e-03 | 76 |
| GO:00310329 | Cervix | CC | actomyosin structure organization | 43/2311 | 196/18723 | 1.11e-04 | 1.40e-03 | 43 |
| GO:00147064 | Cervix | CC | striated muscle tissue development | 72/2311 | 384/18723 | 1.76e-04 | 2.07e-03 | 72 |
| GO:00426924 | Cervix | CC | muscle cell differentiation | 69/2311 | 384/18723 | 8.12e-04 | 7.09e-03 | 69 |
| GO:00511464 | Cervix | CC | striated muscle cell differentiation | 50/2311 | 283/18723 | 5.53e-03 | 3.19e-02 | 50 |
| GO:000701525 | Cervix | N_HPV | actin filament organization | 29/534 | 442/18723 | 3.00e-05 | 8.02e-04 | 29 |
| GO:006053722 | Cervix | N_HPV | muscle tissue development | 21/534 | 403/18723 | 6.10e-03 | 4.21e-02 | 21 |
| GO:0007015 | Colorectum | AD | actin filament organization | 167/3918 | 442/18723 | 1.65e-16 | 7.94e-14 | 167 |
| GO:0031032 | Colorectum | AD | actomyosin structure organization | 65/3918 | 196/18723 | 4.17e-05 | 7.37e-04 | 65 |
| GO:00070151 | Colorectum | SER | actin filament organization | 134/2897 | 442/18723 | 1.39e-15 | 5.70e-13 | 134 |
| GO:00310321 | Colorectum | SER | actomyosin structure organization | 45/2897 | 196/18723 | 3.60e-03 | 3.03e-02 | 45 |
| GO:00070152 | Colorectum | MSS | actin filament organization | 146/3467 | 442/18723 | 1.16e-13 | 2.67e-11 | 146 |
| GO:00310322 | Colorectum | MSS | actomyosin structure organization | 53/3467 | 196/18723 | 2.04e-03 | 1.75e-02 | 53 |
| GO:00070153 | Colorectum | MSI-H | actin filament organization | 50/1319 | 442/18723 | 6.19e-04 | 1.21e-02 | 50 |
| GO:00070154 | Colorectum | FAP | actin filament organization | 125/2622 | 442/18723 | 1.97e-15 | 3.03e-12 | 125 |
| GO:00310323 | Colorectum | FAP | actomyosin structure organization | 51/2622 | 196/18723 | 5.89e-06 | 1.88e-04 | 51 |
| GO:0055006 | Colorectum | FAP | cardiac cell development | 22/2622 | 91/18723 | 6.44e-03 | 4.01e-02 | 22 |
| GO:00070155 | Colorectum | CRC | actin filament organization | 104/2078 | 442/18723 | 4.75e-14 | 7.12e-11 | 104 |
| GO:00310324 | Colorectum | CRC | actomyosin structure organization | 45/2078 | 196/18723 | 1.49e-06 | 8.14e-05 | 45 |
| Hugo Symbol | Variant Class | Variant Classification | dbSNP RS | HGVSc | HGVSp | HGVSp Short | SWISSPROT | BIOTYPE | SIFT | PolyPhen | Tumor Sample Barcode | Tissue | Histology | Sex | Age | Stage | Therapy Types | Drugs | Outcome |
| NEBL | SNV | Missense_Mutation | | c.842C>T | p.Ser281Leu | p.S281L | O76041 | protein_coding | deleterious(0.01) | benign(0.143) | TCGA-AC-A6IW-01 | Breast | breast invasive carcinoma | Female | >=65 | I/II | Unknown | Unknown | SD |
| NEBL | SNV | Missense_Mutation | | c.54N>G | p.Ile18Met | p.I18M | O76041 | protein_coding | tolerated_low_confidence(0.12) | benign(0.066) | TCGA-AN-A0AM-01 | Breast | breast invasive carcinoma | Female | <65 | I/II | Unknown | Unknown | SD |
| NEBL | SNV | Missense_Mutation | | c.584N>A | p.Ala195Glu | p.A195E | O76041 | protein_coding | deleterious(0) | possibly_damaging(0.806) | TCGA-BH-A0BP-01 | Breast | breast invasive carcinoma | Female | >=65 | I/II | Unknown | Unknown | SD |
| NEBL | SNV | Missense_Mutation | | c.1138G>C | p.Glu380Gln | p.E380Q | O76041 | protein_coding | deleterious(0) | probably_damaging(0.972) | TCGA-BH-A18P-01 | Breast | breast invasive carcinoma | Female | <65 | I/II | Unknown | Unknown | PD |
| NEBL | SNV | Missense_Mutation | | c.40G>A | p.Glu14Lys | p.E14K | O76041 | protein_coding | tolerated_low_confidence(0.12) | possibly_damaging(0.893) | TCGA-C8-A1HM-01 | Breast | breast invasive carcinoma | Female | >=65 | I/II | Chemotherapy | doxorubicin | CR |
| NEBL | SNV | Missense_Mutation | novel | c.316N>G | p.Pro106Ala | p.P106A | O76041 | protein_coding | tolerated(0.08) | possibly_damaging(0.517) | TCGA-D8-A13Z-01 | Breast | breast invasive carcinoma | Female | <65 | I/II | Chemotherapy | doxorubicine | SD |
| NEBL | insertion | Frame_Shift_Ins | novel | c.2182_2183insTGAATCGTTGTTTAAATGAATATAATTTTAACCTAAG | p.Thr728MetfsTer19 | p.T728Mfs*19 | O76041 | protein_coding | | | TCGA-AR-A0U0-01 | Breast | breast invasive carcinoma | Female | >=65 | I/II | Unknown | Unknown | SD |
| NEBL | SNV | Missense_Mutation | novel | c.1131N>T | p.Glu377Asp | p.E377D | O76041 | protein_coding | deleterious(0) | benign(0.088) | TCGA-VS-A9UJ-01 | Cervix | cervical & endocervical cancer | Female | <65 | I/II | Unknown | Unknown | PD |
| NEBL | SNV | Missense_Mutation | | c.272N>C | p.Gly91Ala | p.G91A | O76041 | protein_coding | tolerated(0.33) | benign(0.009) | TCGA-AA-3984-01 | Colorectum | colon adenocarcinoma | Female | <65 | I/II | Unknown | Unknown | SD |
| NEBL | SNV | Missense_Mutation | | c.1115A>G | p.Glu372Gly | p.E372G | O76041 | protein_coding | tolerated(0.26) | possibly_damaging(0.626) | TCGA-AD-6964-01 | Colorectum | colon adenocarcinoma | Male | <65 | III/IV | Chemotherapy | folfox | PD |


