| Tissue | Expression Dynamics | Abbreviation |
| Esophagus |  | ESCC: Esophageal squamous cell carcinoma |
| HGIN: High-grade intraepithelial neoplasias |
| LGIN: Low-grade intraepithelial neoplasias |
| Liver | 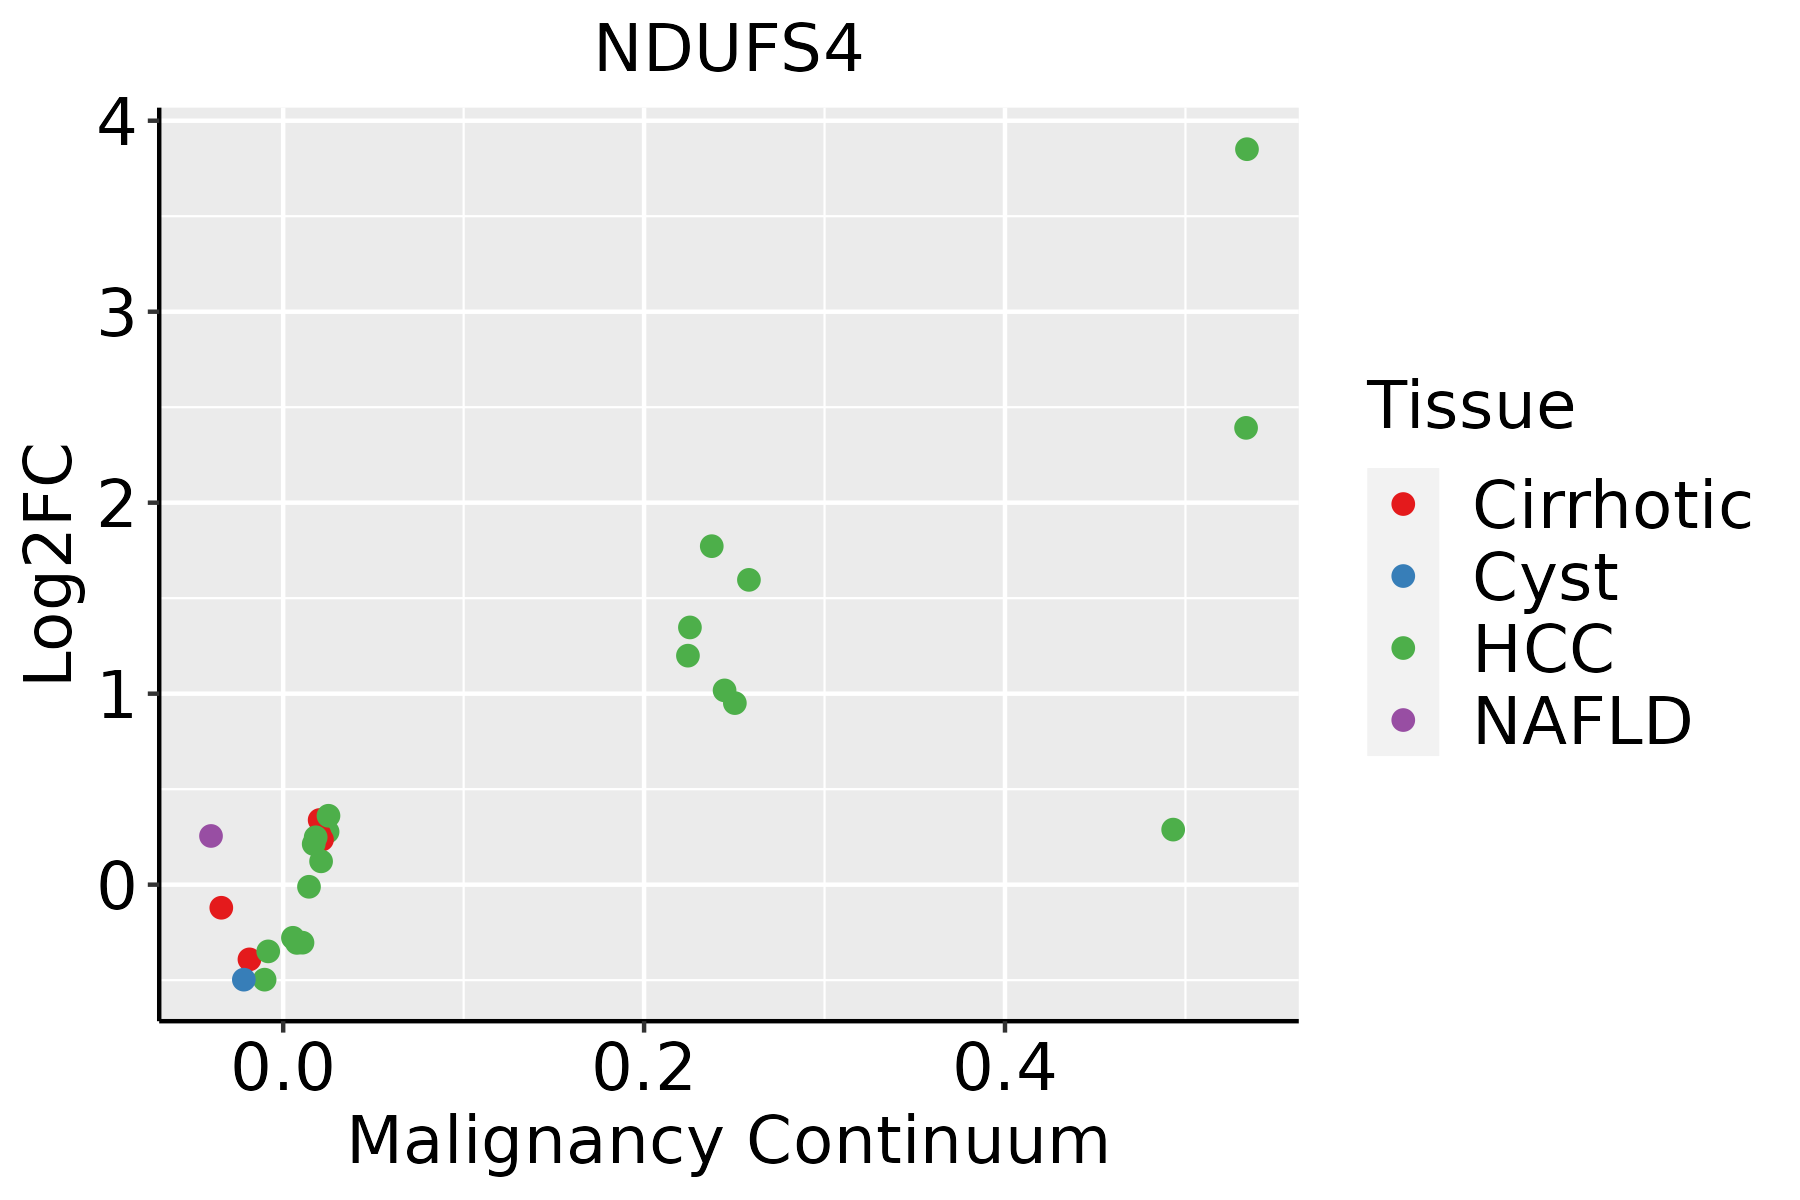 | HCC: Hepatocellular carcinoma |
| NAFLD: Non-alcoholic fatty liver disease |
| Oral Cavity | 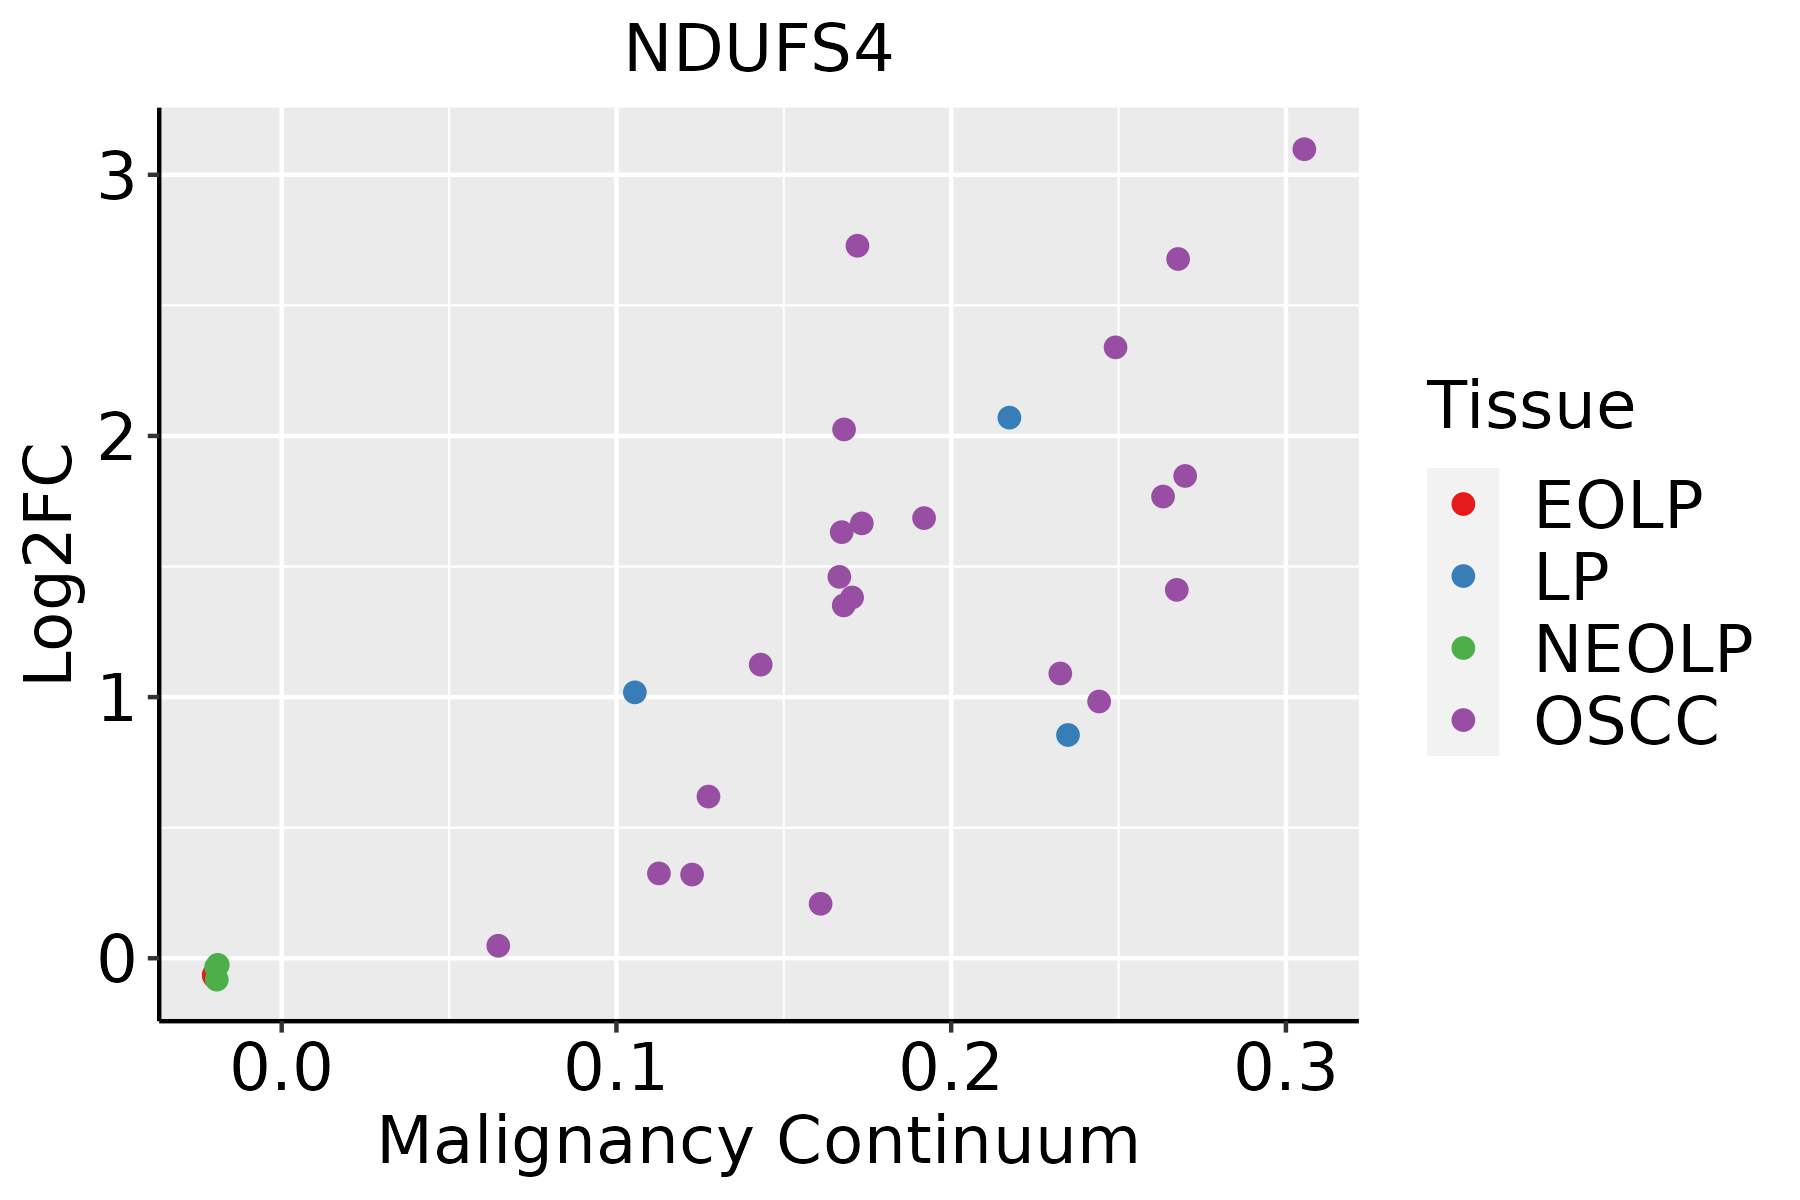 | EOLP: Erosive Oral lichen planus |
| LP: leukoplakia |
| NEOLP: Non-erosive oral lichen planus |
| OSCC: Oral squamous cell carcinoma |
| Prostate | 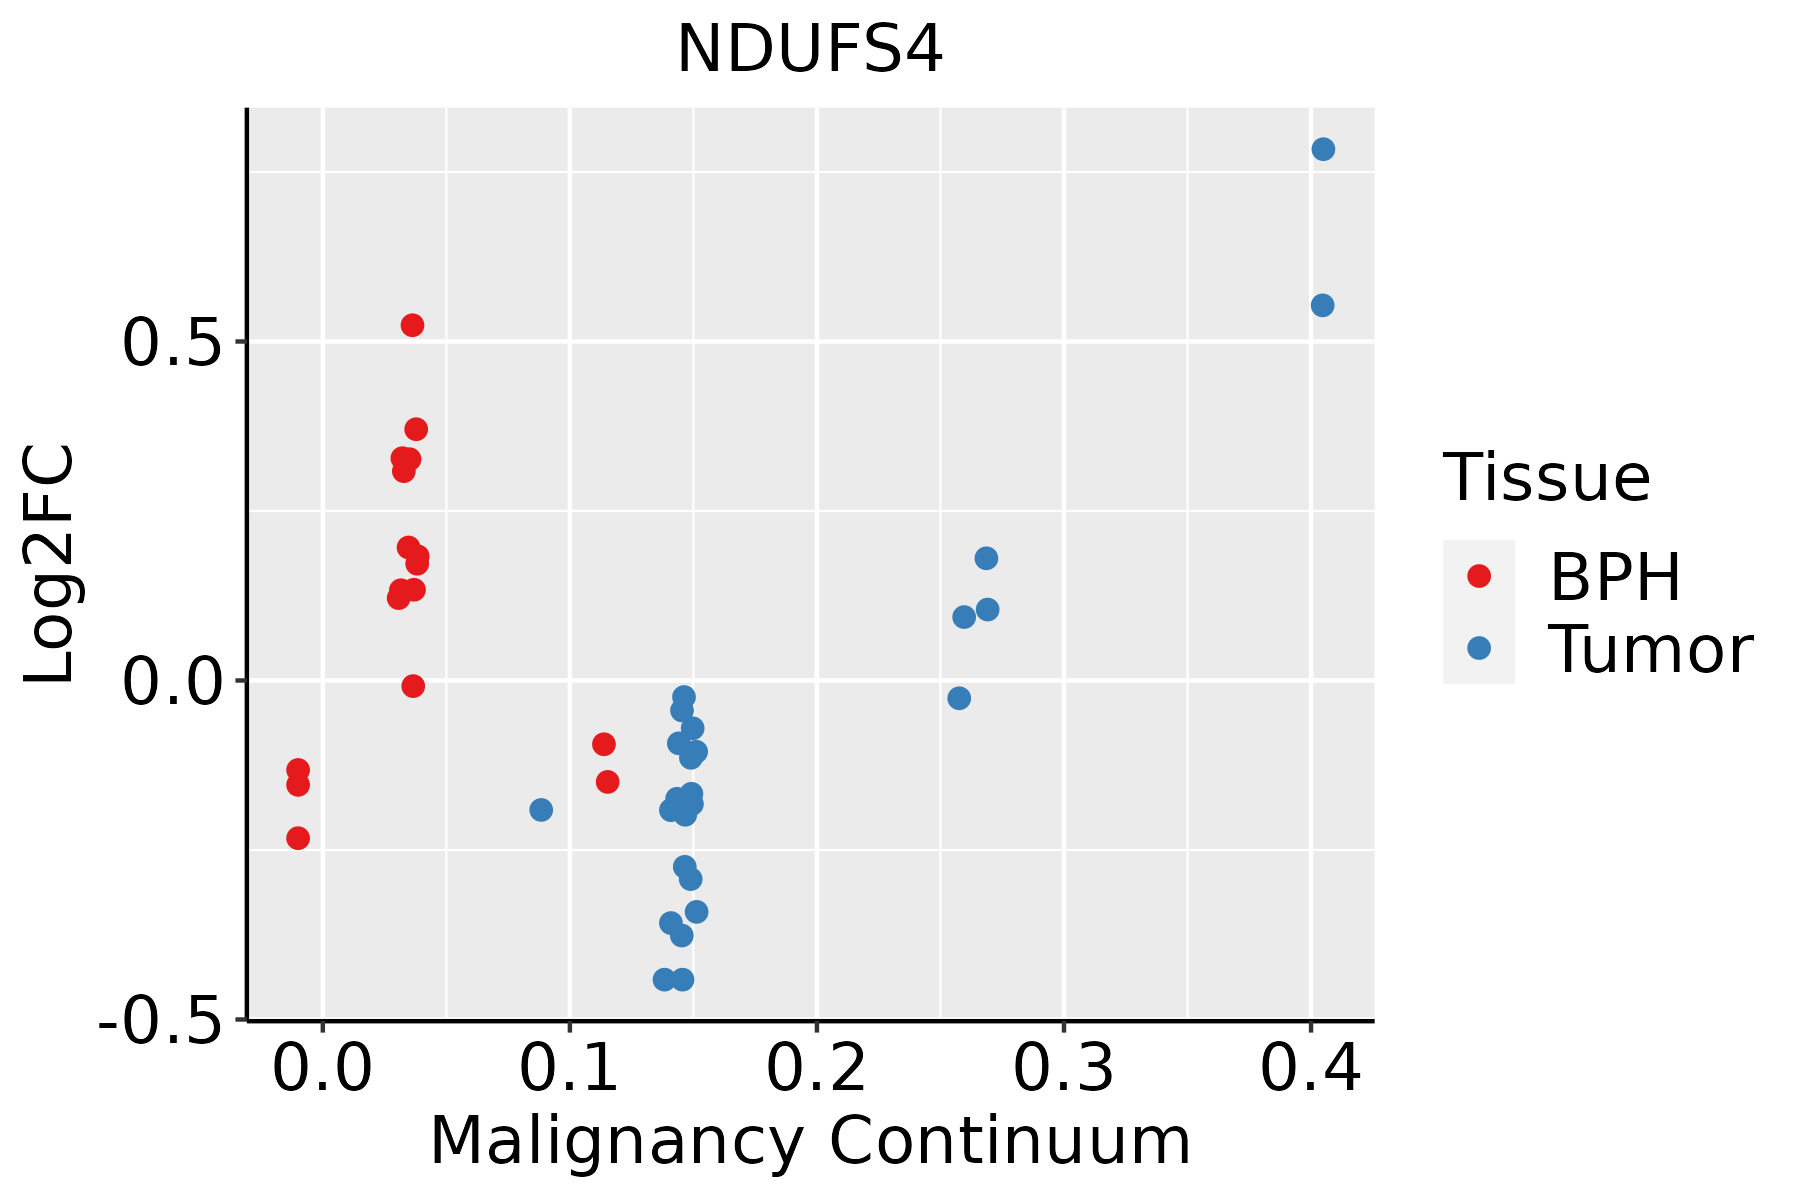 | BPH: Benign Prostatic Hyperplasia |
| Skin | 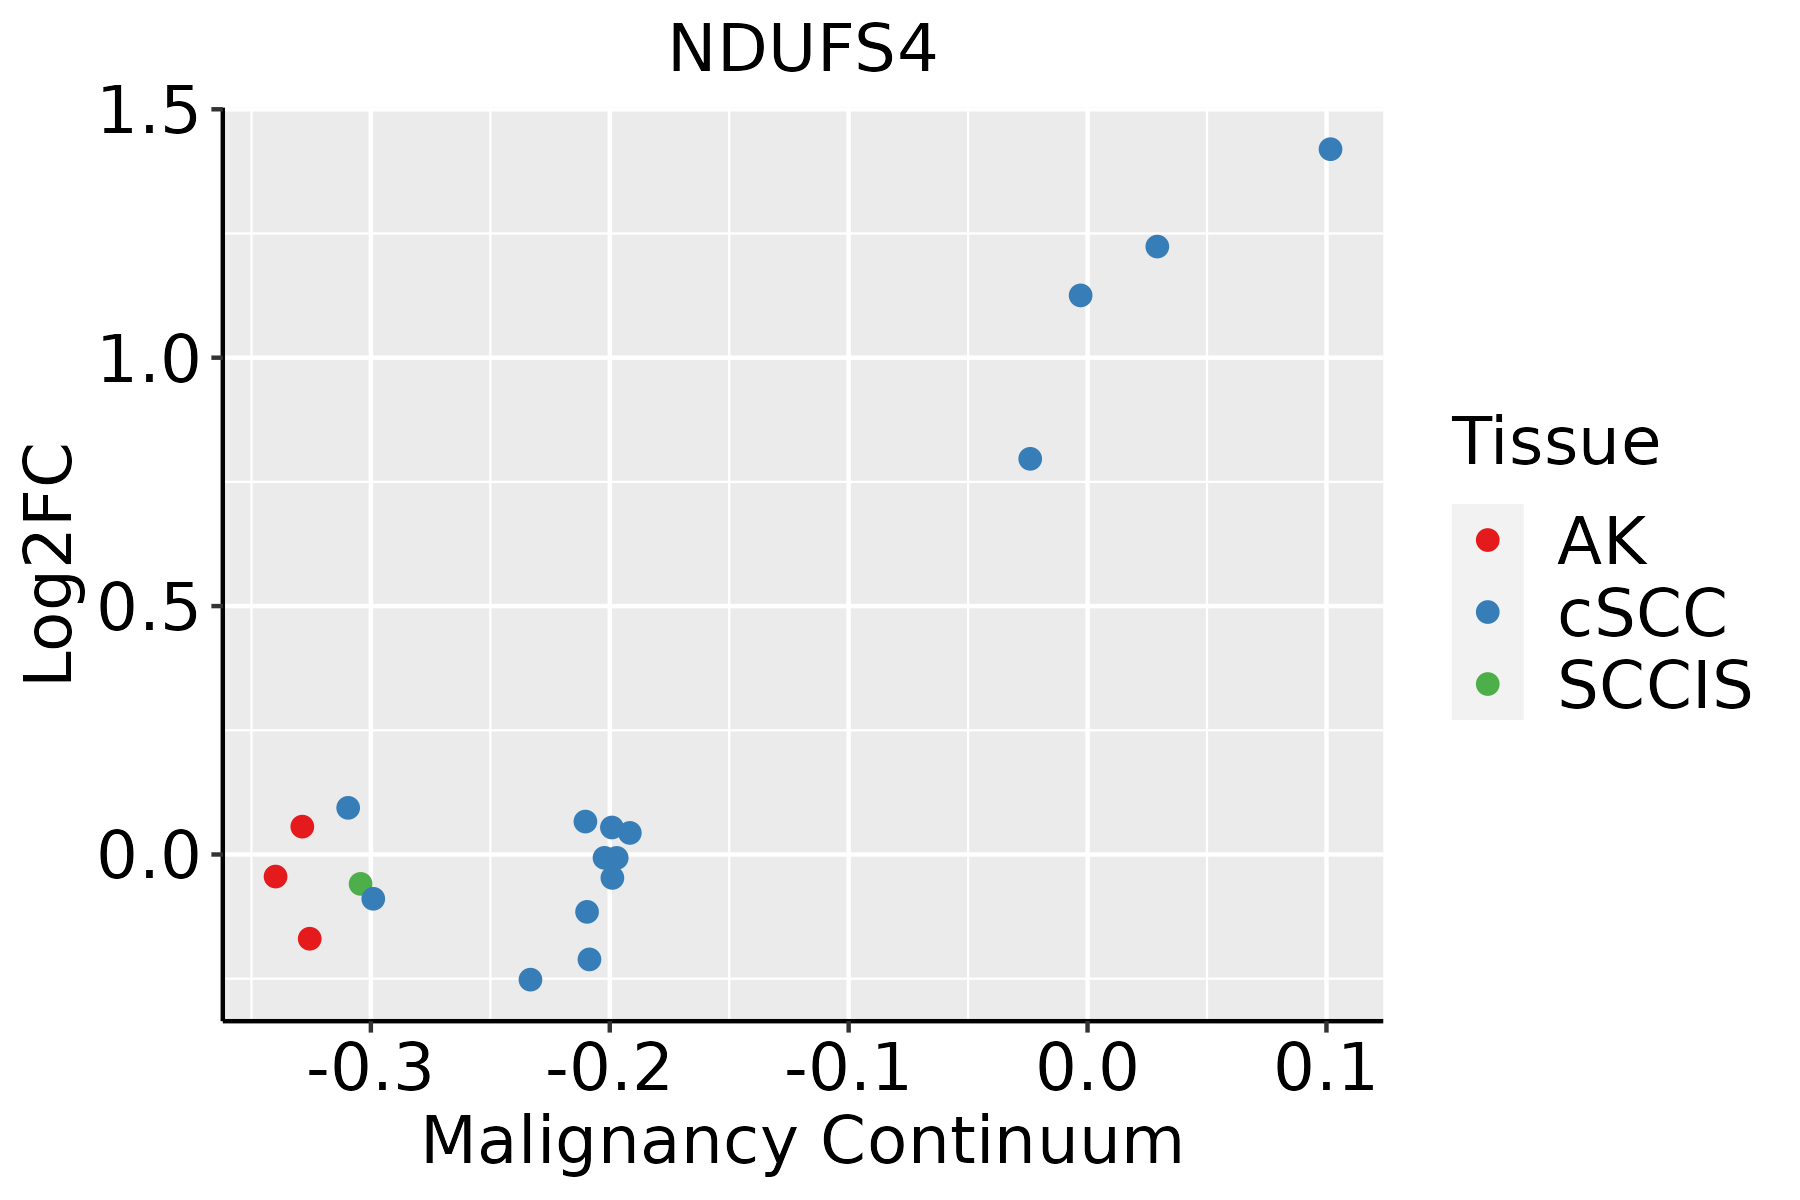 | AK: Actinic keratosis |
| cSCC: Cutaneous squamous cell carcinoma |
| SCCIS:squamous cell carcinoma in situ |
| Thyroid |  | ATC: Anaplastic thyroid cancer |
| HT: Hashimoto's thyroiditis |
| PTC: Papillary thyroid cancer |
| GO ID | Tissue | Disease Stage | Description | Gene Ratio | Bg Ratio | pvalue | p.adjust | Count |
| GO:000611920 | Esophagus | HGIN | oxidative phosphorylation | 69/2587 | 141/18723 | 1.37e-23 | 2.05e-20 | 69 |
| GO:000906020 | Esophagus | HGIN | aerobic respiration | 81/2587 | 189/18723 | 1.07e-22 | 9.26e-20 | 81 |
| GO:004603427 | Esophagus | HGIN | ATP metabolic process | 101/2587 | 277/18723 | 1.53e-21 | 1.02e-18 | 101 |
| GO:000609120 | Esophagus | HGIN | generation of precursor metabolites and energy | 145/2587 | 490/18723 | 3.41e-20 | 2.04e-17 | 145 |
| GO:004533320 | Esophagus | HGIN | cellular respiration | 86/2587 | 230/18723 | 2.41e-19 | 1.20e-16 | 86 |
| GO:001598020 | Esophagus | HGIN | energy derivation by oxidation of organic compounds | 105/2587 | 318/18723 | 1.16e-18 | 4.99e-16 | 105 |
| GO:004277320 | Esophagus | HGIN | ATP synthesis coupled electron transport | 49/2587 | 95/18723 | 2.21e-18 | 7.36e-16 | 49 |
| GO:004277520 | Esophagus | HGIN | mitochondrial ATP synthesis coupled electron transport | 49/2587 | 95/18723 | 2.21e-18 | 7.36e-16 | 49 |
| GO:003310820 | Esophagus | HGIN | mitochondrial respiratory chain complex assembly | 47/2587 | 93/18723 | 3.15e-17 | 8.60e-15 | 47 |
| GO:002290420 | Esophagus | HGIN | respiratory electron transport chain | 51/2587 | 114/18723 | 9.63e-16 | 2.41e-13 | 51 |
| GO:001964620 | Esophagus | HGIN | aerobic electron transport chain | 43/2587 | 87/18723 | 1.98e-15 | 4.41e-13 | 43 |
| GO:002290020 | Esophagus | HGIN | electron transport chain | 66/2587 | 175/18723 | 2.21e-15 | 4.73e-13 | 66 |
| GO:001025720 | Esophagus | HGIN | NADH dehydrogenase complex assembly | 31/2587 | 57/18723 | 5.89e-13 | 8.62e-11 | 31 |
| GO:003298120 | Esophagus | HGIN | mitochondrial respiratory chain complex I assembly | 31/2587 | 57/18723 | 5.89e-13 | 8.62e-11 | 31 |
| GO:000612020 | Esophagus | HGIN | mitochondrial electron transport, NADH to ubiquinone | 28/2587 | 51/18723 | 5.72e-12 | 7.30e-10 | 28 |
| GO:00481458 | Esophagus | HGIN | regulation of fibroblast proliferation | 23/2587 | 80/18723 | 3.71e-04 | 5.77e-03 | 23 |
| GO:00481447 | Esophagus | HGIN | fibroblast proliferation | 23/2587 | 81/18723 | 4.52e-04 | 6.62e-03 | 23 |
| GO:0006091110 | Esophagus | ESCC | generation of precursor metabolites and energy | 331/8552 | 490/18723 | 3.86e-23 | 8.45e-21 | 331 |
| GO:0045333110 | Esophagus | ESCC | cellular respiration | 173/8552 | 230/18723 | 4.53e-20 | 5.99e-18 | 173 |
| GO:0033108110 | Esophagus | ESCC | mitochondrial respiratory chain complex assembly | 83/8552 | 93/18723 | 9.56e-19 | 1.05e-16 | 83 |
| Pathway ID | Tissue | Disease Stage | Description | Gene Ratio | Bg Ratio | pvalue | p.adjust | qvalue | Count |
| hsa0501239 | Esophagus | HGIN | Parkinson disease | 124/1383 | 266/8465 | 5.95e-32 | 9.70e-30 | 7.70e-30 | 124 |
| hsa0501630 | Esophagus | HGIN | Huntington disease | 129/1383 | 306/8465 | 6.81e-28 | 7.41e-26 | 5.88e-26 | 129 |
| hsa0502030 | Esophagus | HGIN | Prion disease | 117/1383 | 273/8465 | 4.15e-26 | 3.38e-24 | 2.69e-24 | 117 |
| hsa0501430 | Esophagus | HGIN | Amyotrophic lateral sclerosis | 140/1383 | 364/8465 | 2.13e-25 | 1.16e-23 | 9.19e-24 | 140 |
| hsa0019030 | Esophagus | HGIN | Oxidative phosphorylation | 68/1383 | 134/8465 | 1.73e-20 | 8.07e-19 | 6.41e-19 | 68 |
| hsa0520839 | Esophagus | HGIN | Chemical carcinogenesis - reactive oxygen species | 92/1383 | 223/8465 | 2.41e-19 | 9.83e-18 | 7.80e-18 | 92 |
| hsa0502230 | Esophagus | HGIN | Pathways of neurodegeneration - multiple diseases | 153/1383 | 476/8465 | 1.22e-18 | 4.41e-17 | 3.50e-17 | 153 |
| hsa0501030 | Esophagus | HGIN | Alzheimer disease | 130/1383 | 384/8465 | 5.26e-18 | 1.71e-16 | 1.36e-16 | 130 |
| hsa0471439 | Esophagus | HGIN | Thermogenesis | 91/1383 | 232/8465 | 1.97e-17 | 5.36e-16 | 4.25e-16 | 91 |
| hsa0541530 | Esophagus | HGIN | Diabetic cardiomyopathy | 80/1383 | 203/8465 | 1.35e-15 | 3.38e-14 | 2.69e-14 | 80 |
| hsa0493230 | Esophagus | HGIN | Non-alcoholic fatty liver disease | 66/1383 | 155/8465 | 5.21e-15 | 1.21e-13 | 9.64e-14 | 66 |
| hsa0472327 | Esophagus | HGIN | Retrograde endocannabinoid signaling | 36/1383 | 148/8465 | 7.52e-03 | 4.63e-02 | 3.68e-02 | 36 |
| hsa05012114 | Esophagus | HGIN | Parkinson disease | 124/1383 | 266/8465 | 5.95e-32 | 9.70e-30 | 7.70e-30 | 124 |
| hsa05016113 | Esophagus | HGIN | Huntington disease | 129/1383 | 306/8465 | 6.81e-28 | 7.41e-26 | 5.88e-26 | 129 |
| hsa05020113 | Esophagus | HGIN | Prion disease | 117/1383 | 273/8465 | 4.15e-26 | 3.38e-24 | 2.69e-24 | 117 |
| hsa05014113 | Esophagus | HGIN | Amyotrophic lateral sclerosis | 140/1383 | 364/8465 | 2.13e-25 | 1.16e-23 | 9.19e-24 | 140 |
| hsa00190113 | Esophagus | HGIN | Oxidative phosphorylation | 68/1383 | 134/8465 | 1.73e-20 | 8.07e-19 | 6.41e-19 | 68 |
| hsa05208115 | Esophagus | HGIN | Chemical carcinogenesis - reactive oxygen species | 92/1383 | 223/8465 | 2.41e-19 | 9.83e-18 | 7.80e-18 | 92 |
| hsa05022113 | Esophagus | HGIN | Pathways of neurodegeneration - multiple diseases | 153/1383 | 476/8465 | 1.22e-18 | 4.41e-17 | 3.50e-17 | 153 |
| hsa05010113 | Esophagus | HGIN | Alzheimer disease | 130/1383 | 384/8465 | 5.26e-18 | 1.71e-16 | 1.36e-16 | 130 |
| Hugo Symbol | Variant Class | Variant Classification | dbSNP RS | HGVSc | HGVSp | HGVSp Short | SWISSPROT | BIOTYPE | SIFT | PolyPhen | Tumor Sample Barcode | Tissue | Histology | Sex | Age | Stage | Therapy Types | Drugs | Outcome |
| NDUFS4 | insertion | Nonsense_Mutation | novel | c.342_343insAGTTGTTAAATTTACAACTTTACAAAAAGGTTCA | p.Ala115SerfsTer3 | p.A115Sfs*3 | O43181 | protein_coding | | | TCGA-B6-A0I8-01 | Breast | breast invasive carcinoma | Female | <65 | I/II | Unknown | Unknown | PD |
| NDUFS4 | SNV | Missense_Mutation | novel | c.494C>A | p.Ser165Tyr | p.S165Y | O43181 | protein_coding | deleterious(0) | possibly_damaging(0.767) | TCGA-AG-A002-01 | Colorectum | rectum adenocarcinoma | Male | <65 | I/II | Unknown | Unknown | SD |
| NDUFS4 | SNV | Missense_Mutation | | c.210N>T | p.Glu70Asp | p.E70D | O43181 | protein_coding | tolerated(0.08) | probably_damaging(0.984) | TCGA-AP-A051-01 | Endometrium | uterine corpus endometrioid carcinoma | Female | >=65 | I/II | Unknown | Unknown | SD |
| NDUFS4 | SNV | Missense_Mutation | | c.43N>C | p.Trp15Arg | p.W15R | O43181 | protein_coding | tolerated_low_confidence(0.35) | benign(0.014) | TCGA-AX-A0J0-01 | Endometrium | uterine corpus endometrioid carcinoma | Female | <65 | I/II | Unknown | Unknown | SD |
| NDUFS4 | SNV | Missense_Mutation | | c.521N>A | p.Thr174Lys | p.T174K | O43181 | protein_coding | deleterious(0) | possibly_damaging(0.598) | TCGA-B5-A0JY-01 | Endometrium | uterine corpus endometrioid carcinoma | Female | <65 | III/IV | Chemotherapy | doxorubicin | SD |
| NDUFS4 | SNV | Missense_Mutation | rs766855689 | c.217N>C | p.Lys73Gln | p.K73Q | O43181 | protein_coding | deleterious(0.03) | probably_damaging(0.995) | TCGA-E6-A1LX-01 | Endometrium | uterine corpus endometrioid carcinoma | Female | <65 | I/II | Unknown | Unknown | SD |
| NDUFS4 | SNV | Missense_Mutation | novel | c.473N>C | p.Lys158Thr | p.K158T | O43181 | protein_coding | deleterious(0) | possibly_damaging(0.716) | TCGA-EY-A548-01 | Endometrium | uterine corpus endometrioid carcinoma | Female | >=65 | I/II | Unknown | Unknown | SD |
| NDUFS4 | SNV | Missense_Mutation | novel | c.337G>T | p.Gly113Cys | p.G113C | O43181 | protein_coding | deleterious(0) | probably_damaging(1) | TCGA-EY-A5W2-01 | Endometrium | uterine corpus endometrioid carcinoma | Female | >=65 | I/II | Unknown | Unknown | SD |
| NDUFS4 | SNV | Missense_Mutation | novel | c.148N>G | p.Thr50Ala | p.T50A | O43181 | protein_coding | tolerated(0.3) | benign(0.003) | TCGA-FI-A2D0-01 | Endometrium | uterine corpus endometrioid carcinoma | Female | <65 | I/II | Unknown | Unknown | SD |
| NDUFS4 | insertion | Frame_Shift_Ins | novel | c.331_332insATTTGCA | p.Leu111TyrfsTer11 | p.L111Yfs*11 | O43181 | protein_coding | | | TCGA-D1-A0ZP-01 | Endometrium | uterine corpus endometrioid carcinoma | Female | <65 | III/IV | Chemotherapy | paclitaxel | PD |


