
|
|||||
|
 | |
| |
| |
| |
| |
| |
|
Gene: NDUFS3 |
Gene summary for NDUFS3 |
| Gene information | Species | Human | Gene symbol | NDUFS3 | Gene ID | 4722 |
| Gene name | NADH:ubiquinone oxidoreductase core subunit S3 | |
| Gene Alias | CI-30 | |
| Cytomap | 11p11.2 | |
| Gene Type | protein-coding | GO ID | GO:0001558 | UniProtAcc | O75489 |
Top |
Malignant transformation analysis |
| Identification of the aberrant gene expression in precancerous and cancerous lesions by comparing the gene expression of stem-like cells in diseased tissues with normal stem cells |
| Entrez ID | Symbol | Replicates | Species | Organ | Tissue | Adj P-value | Log2FC | Malignancy |
| 4722 | NDUFS3 | HTA11_3410_2000001011 | Human | Colorectum | AD | 9.20e-12 | 3.28e-01 | 0.0155 |
| 4722 | NDUFS3 | HTA11_2487_2000001011 | Human | Colorectum | SER | 1.09e-14 | 5.60e-01 | -0.1808 |
| 4722 | NDUFS3 | HTA11_1938_2000001011 | Human | Colorectum | AD | 6.08e-12 | 6.49e-01 | -0.0811 |
| 4722 | NDUFS3 | HTA11_78_2000001011 | Human | Colorectum | AD | 3.23e-06 | 3.99e-01 | -0.1088 |
| 4722 | NDUFS3 | HTA11_347_2000001011 | Human | Colorectum | AD | 9.55e-33 | 7.29e-01 | -0.1954 |
| 4722 | NDUFS3 | HTA11_411_2000001011 | Human | Colorectum | SER | 1.99e-10 | 8.04e-01 | -0.2602 |
| 4722 | NDUFS3 | HTA11_2112_2000001011 | Human | Colorectum | SER | 1.25e-02 | 5.11e-01 | -0.2196 |
| 4722 | NDUFS3 | HTA11_3361_2000001011 | Human | Colorectum | AD | 1.26e-09 | 5.97e-01 | -0.1207 |
| 4722 | NDUFS3 | HTA11_83_2000001011 | Human | Colorectum | SER | 2.40e-11 | 6.78e-01 | -0.1526 |
| 4722 | NDUFS3 | HTA11_696_2000001011 | Human | Colorectum | AD | 2.65e-40 | 7.77e-01 | -0.1464 |
| 4722 | NDUFS3 | HTA11_866_2000001011 | Human | Colorectum | AD | 4.44e-12 | 3.78e-01 | -0.1001 |
| 4722 | NDUFS3 | HTA11_1391_2000001011 | Human | Colorectum | AD | 1.39e-26 | 8.41e-01 | -0.059 |
| 4722 | NDUFS3 | HTA11_2992_2000001011 | Human | Colorectum | SER | 3.71e-10 | 8.82e-01 | -0.1706 |
| 4722 | NDUFS3 | HTA11_5212_2000001011 | Human | Colorectum | AD | 4.00e-08 | 5.45e-01 | -0.2061 |
| 4722 | NDUFS3 | HTA11_5216_2000001011 | Human | Colorectum | SER | 3.56e-08 | 6.83e-01 | -0.1462 |
| 4722 | NDUFS3 | HTA11_546_2000001011 | Human | Colorectum | AD | 1.54e-12 | 6.30e-01 | -0.0842 |
| 4722 | NDUFS3 | HTA11_7862_2000001011 | Human | Colorectum | AD | 6.23e-06 | 3.93e-01 | -0.0179 |
| 4722 | NDUFS3 | HTA11_866_3004761011 | Human | Colorectum | AD | 1.11e-19 | 5.70e-01 | 0.096 |
| 4722 | NDUFS3 | HTA11_4255_2000001011 | Human | Colorectum | SER | 1.19e-03 | 5.56e-01 | 0.0446 |
| 4722 | NDUFS3 | HTA11_8622_2000001021 | Human | Colorectum | SER | 6.34e-04 | 4.01e-01 | 0.0528 |
| Page: 1 2 3 4 5 6 7 8 9 |
| Tissue | Expression Dynamics | Abbreviation |
| Colorectum (GSE201348) |  | FAP: Familial adenomatous polyposis |
| CRC: Colorectal cancer | ||
| Colorectum (HTA11) |  | AD: Adenomas |
| SER: Sessile serrated lesions | ||
| MSI-H: Microsatellite-high colorectal cancer | ||
| MSS: Microsatellite stable colorectal cancer | ||
| Esophagus |  | ESCC: Esophageal squamous cell carcinoma |
| HGIN: High-grade intraepithelial neoplasias | ||
| LGIN: Low-grade intraepithelial neoplasias | ||
| Liver | 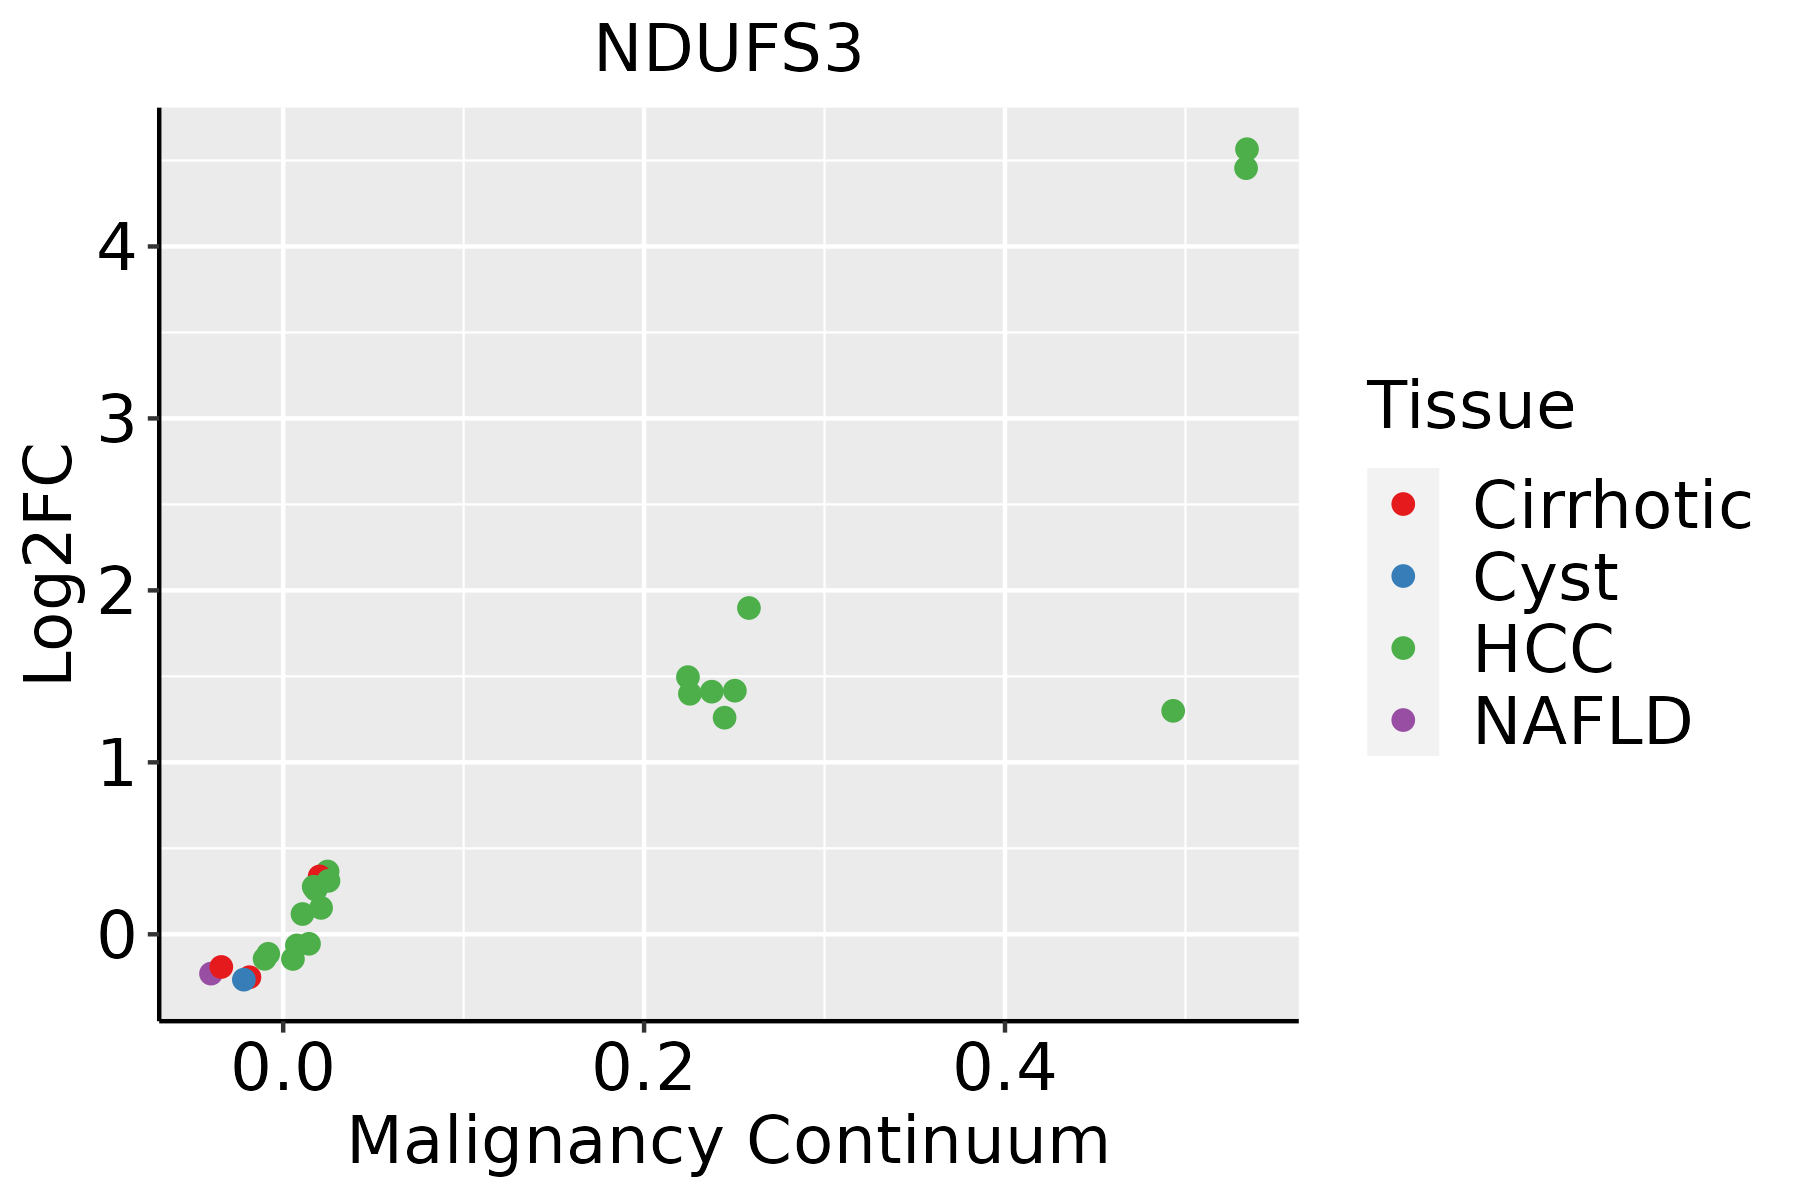 | HCC: Hepatocellular carcinoma |
| NAFLD: Non-alcoholic fatty liver disease | ||
| Oral Cavity | 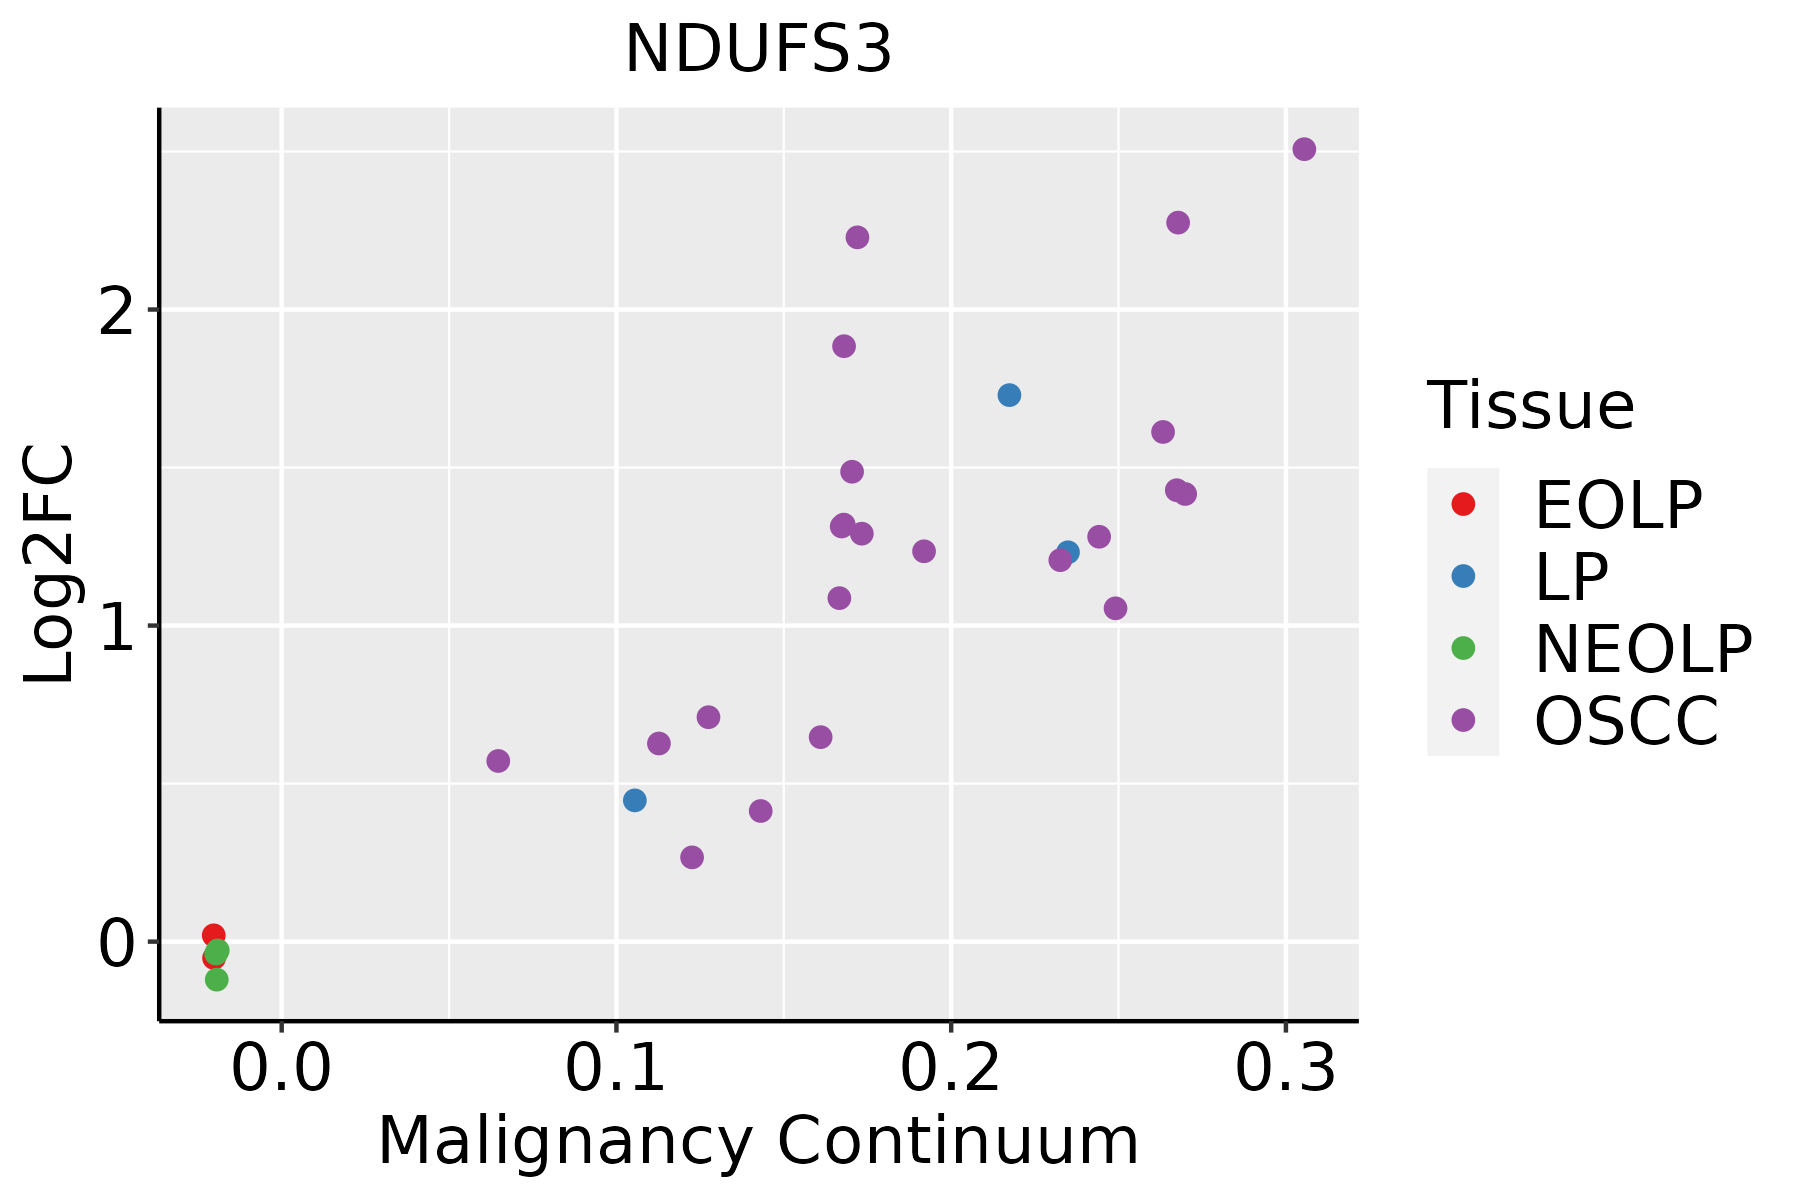 | EOLP: Erosive Oral lichen planus |
| LP: leukoplakia | ||
| NEOLP: Non-erosive oral lichen planus | ||
| OSCC: Oral squamous cell carcinoma | ||
| Prostate | 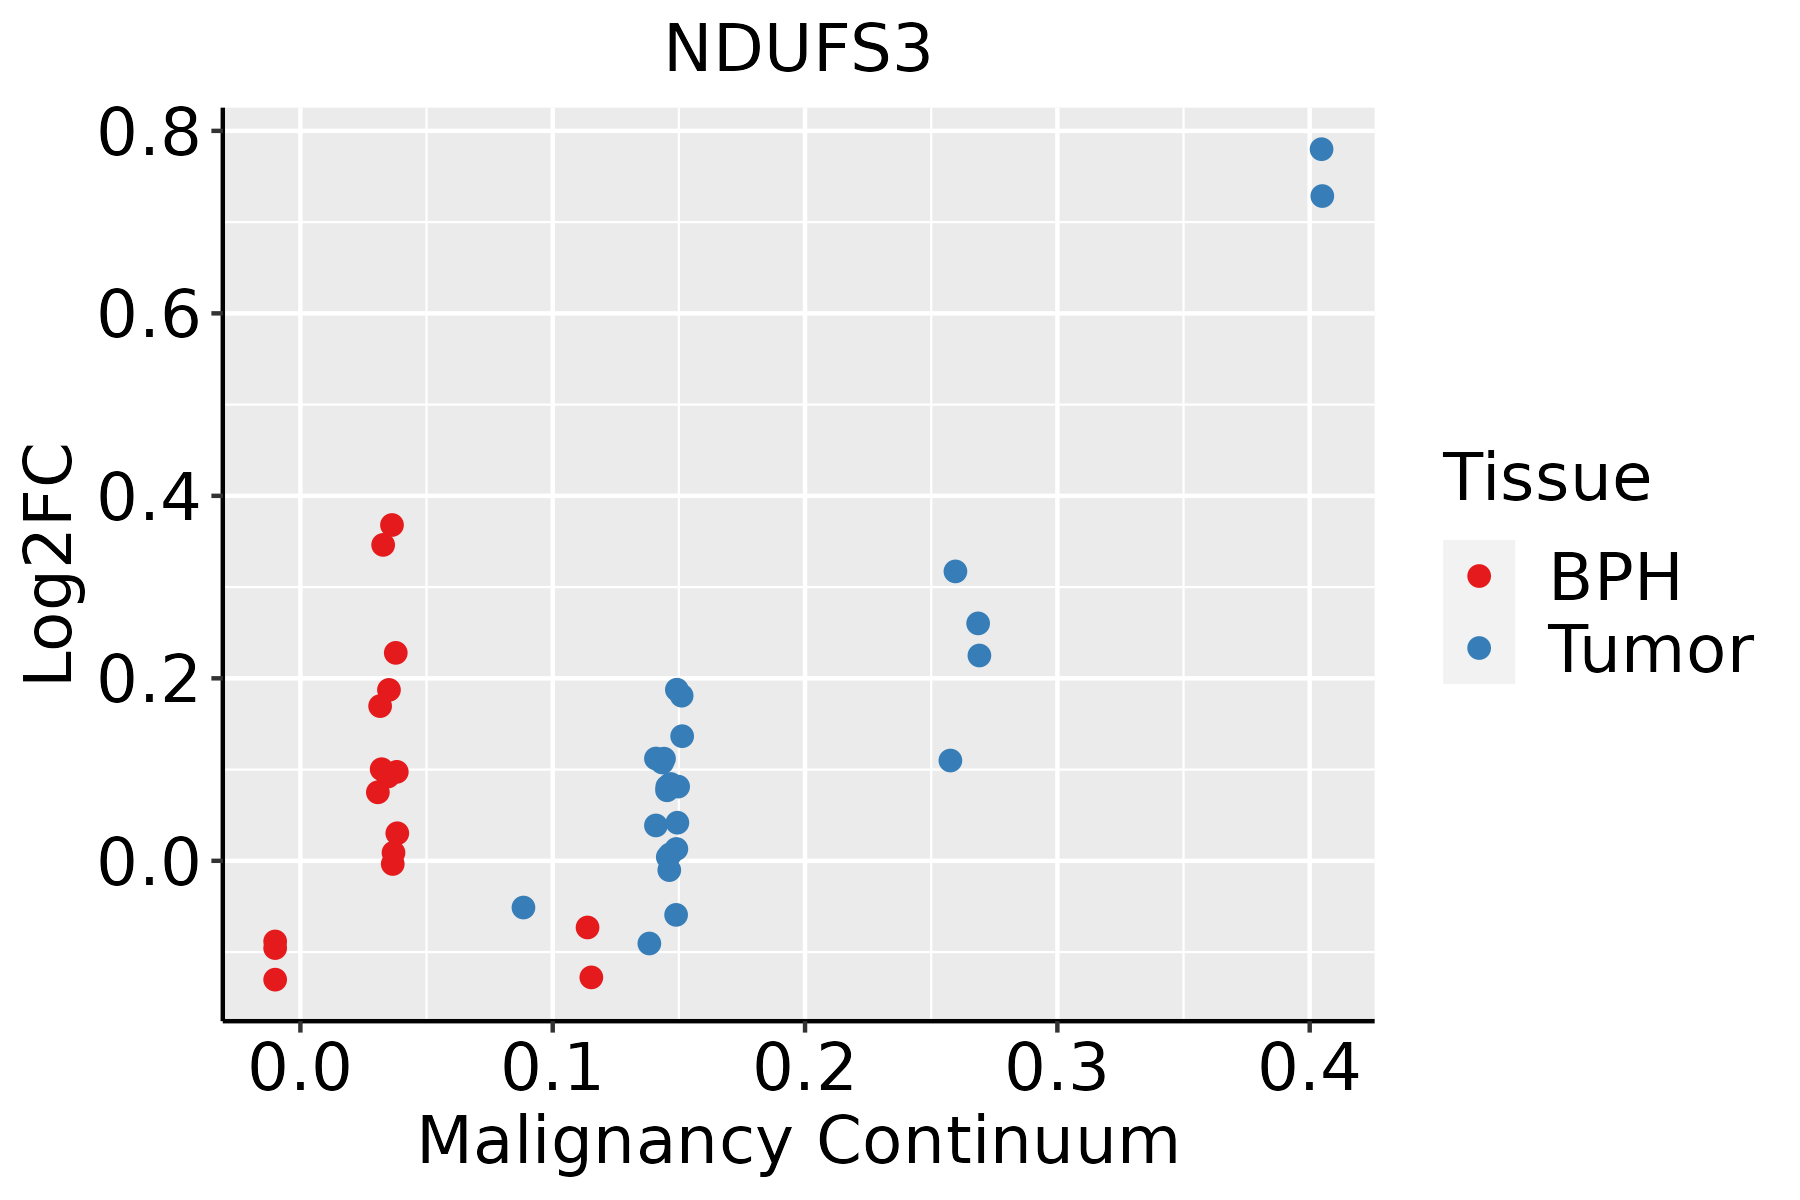 | BPH: Benign Prostatic Hyperplasia |
| Skin | 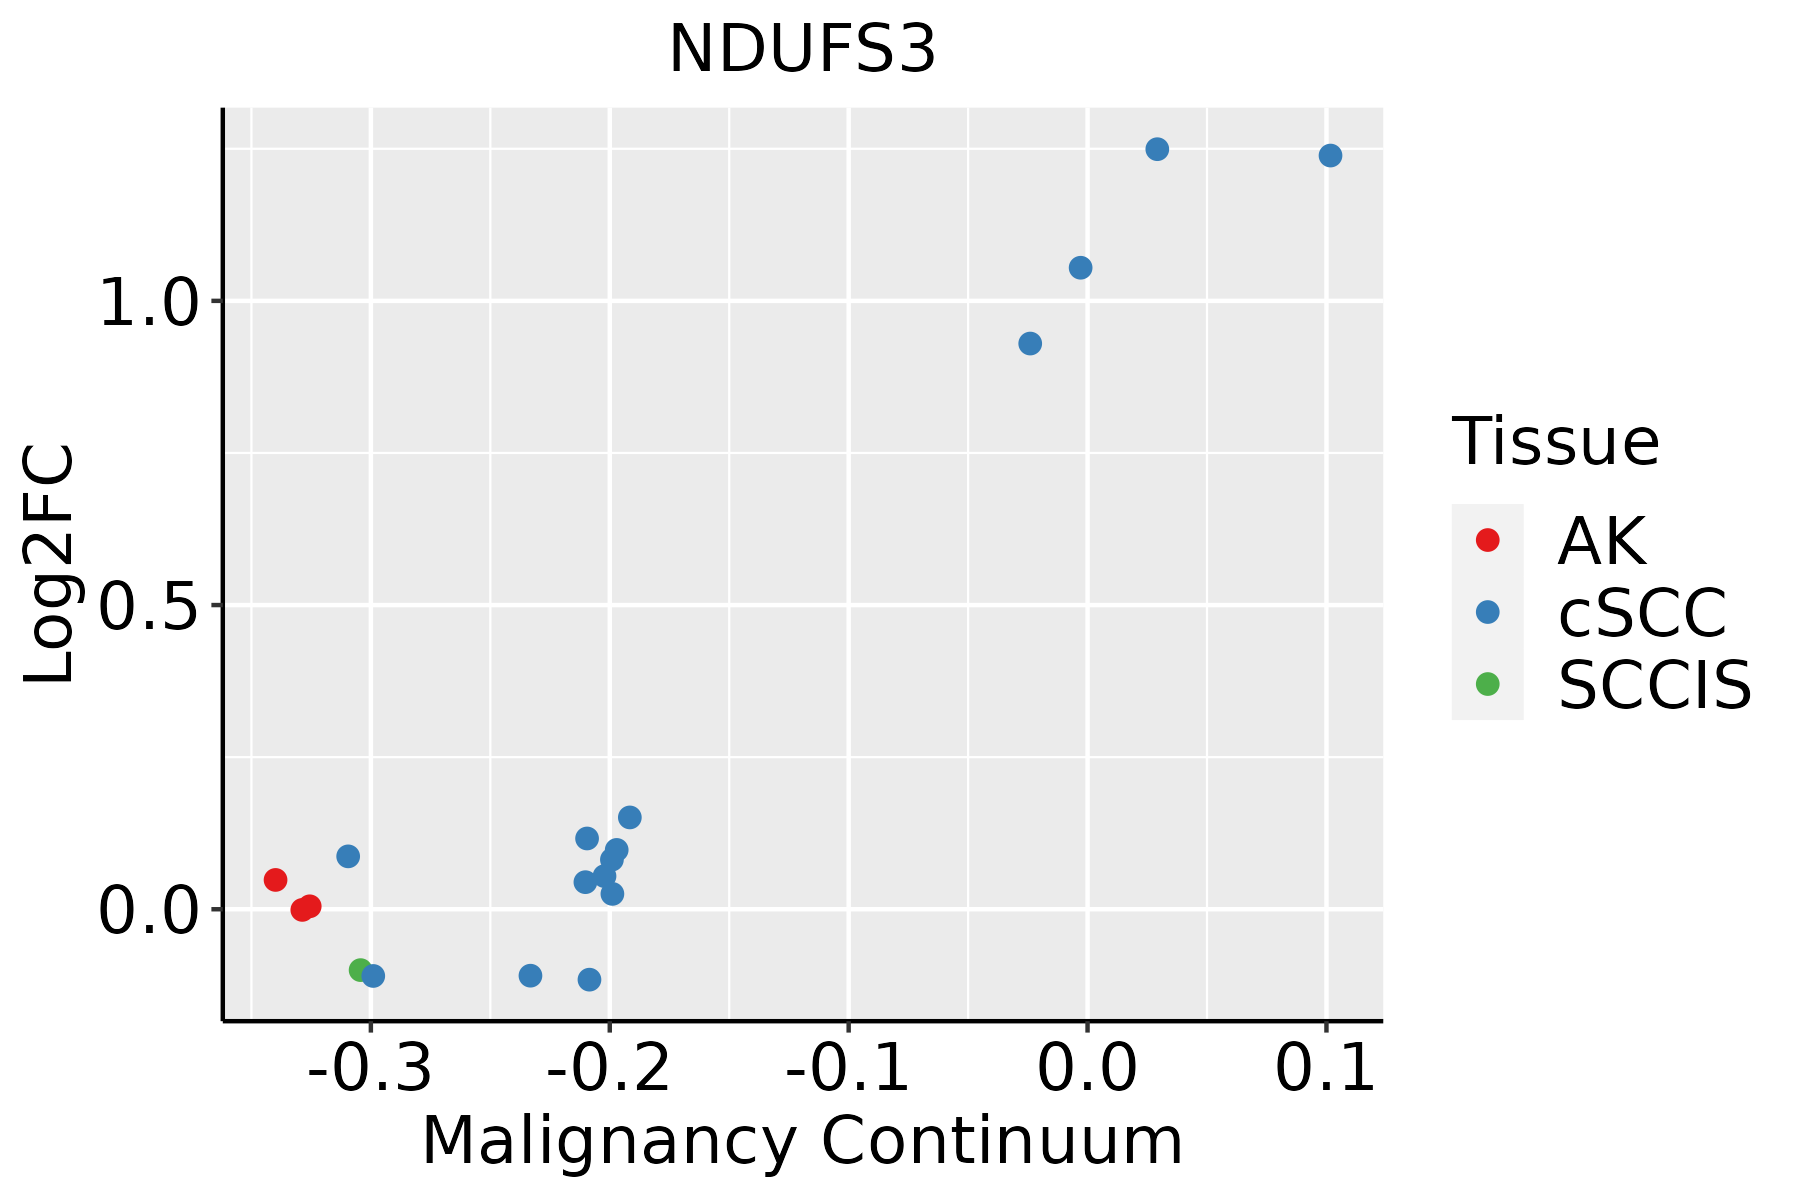 | AK: Actinic keratosis |
| cSCC: Cutaneous squamous cell carcinoma | ||
| SCCIS:squamous cell carcinoma in situ | ||
| Thyroid |  | ATC: Anaplastic thyroid cancer |
| HT: Hashimoto's thyroiditis | ||
| PTC: Papillary thyroid cancer |
| ∗log2FC in expression of this searched gene in stem-like cells from each diseased tissue sample relative to stem-like cells in normal samples in each tissue plotted against the malignancy continuum. Samples are colored based on if they are from different disease stage. |
Top |
Malignant transformation related pathway analysis |
| Find out the enriched GO biological processes and KEGG pathways involved in transition from healthy to precancer to cancer |
| Tissue | Disease Stage | Enriched GO biological Processes |
| Colorectum | AD |  |
| Colorectum | SER |  |
| Colorectum | MSS |  |
| Colorectum | MSI-H |  |
| Colorectum | FAP |  |
| ∗Top 15 enriched GO BP terms are showed in the bar plot of each disease state in each tissue. Each row represents a significant GO biological process which is colored according to the -log10(p.adjust). |
| Page: 1 2 3 4 5 6 7 8 9 |
| GO ID | Tissue | Disease Stage | Description | Gene Ratio | Bg Ratio | pvalue | p.adjust | Count |
| GO:0046034 | Colorectum | AD | ATP metabolic process | 142/3918 | 277/18723 | 2.64e-29 | 8.26e-26 | 142 |
| GO:0006091 | Colorectum | AD | generation of precursor metabolites and energy | 209/3918 | 490/18723 | 3.17e-28 | 6.61e-25 | 209 |
| GO:0009060 | Colorectum | AD | aerobic respiration | 108/3918 | 189/18723 | 9.14e-28 | 1.43e-24 | 108 |
| GO:0045333 | Colorectum | AD | cellular respiration | 119/3918 | 230/18723 | 3.21e-25 | 4.02e-22 | 119 |
| GO:0006119 | Colorectum | AD | oxidative phosphorylation | 83/3918 | 141/18723 | 7.95e-23 | 8.30e-20 | 83 |
| GO:0015980 | Colorectum | AD | energy derivation by oxidation of organic compounds | 143/3918 | 318/18723 | 2.78e-22 | 2.49e-19 | 143 |
| GO:0022900 | Colorectum | AD | electron transport chain | 89/3918 | 175/18723 | 1.42e-18 | 8.91e-16 | 89 |
| GO:0019646 | Colorectum | AD | aerobic electron transport chain | 53/3918 | 87/18723 | 5.58e-16 | 2.16e-13 | 53 |
| GO:0042773 | Colorectum | AD | ATP synthesis coupled electron transport | 56/3918 | 95/18723 | 6.76e-16 | 2.22e-13 | 56 |
| GO:0042775 | Colorectum | AD | mitochondrial ATP synthesis coupled electron transport | 56/3918 | 95/18723 | 6.76e-16 | 2.22e-13 | 56 |
| GO:0022904 | Colorectum | AD | respiratory electron transport chain | 63/3918 | 114/18723 | 8.23e-16 | 2.45e-13 | 63 |
| GO:0097193 | Colorectum | AD | intrinsic apoptotic signaling pathway | 108/3918 | 288/18723 | 6.25e-11 | 6.41e-09 | 108 |
| GO:0006120 | Colorectum | AD | mitochondrial electron transport, NADH to ubiquinone | 32/3918 | 51/18723 | 1.12e-10 | 1.11e-08 | 32 |
| GO:0010257 | Colorectum | AD | NADH dehydrogenase complex assembly | 34/3918 | 57/18723 | 2.15e-10 | 1.89e-08 | 34 |
| GO:0032981 | Colorectum | AD | mitochondrial respiratory chain complex I assembly | 34/3918 | 57/18723 | 2.15e-10 | 1.89e-08 | 34 |
| GO:0033108 | Colorectum | AD | mitochondrial respiratory chain complex assembly | 46/3918 | 93/18723 | 8.95e-10 | 6.91e-08 | 46 |
| GO:2001242 | Colorectum | AD | regulation of intrinsic apoptotic signaling pathway | 67/3918 | 164/18723 | 4.94e-09 | 3.16e-07 | 67 |
| GO:2001233 | Colorectum | AD | regulation of apoptotic signaling pathway | 119/3918 | 356/18723 | 2.14e-08 | 1.21e-06 | 119 |
| GO:0016049 | Colorectum | AD | cell growth | 143/3918 | 482/18723 | 2.83e-06 | 8.09e-05 | 143 |
| GO:0001558 | Colorectum | AD | regulation of cell growth | 124/3918 | 414/18723 | 7.67e-06 | 1.86e-04 | 124 |
| Page: 1 2 3 4 5 6 7 8 9 10 11 12 13 14 15 16 17 18 19 20 |
| Pathway ID | Tissue | Disease Stage | Description | Gene Ratio | Bg Ratio | pvalue | p.adjust | qvalue | Count |
| hsa05012 | Colorectum | AD | Parkinson disease | 147/2092 | 266/8465 | 2.53e-27 | 8.48e-25 | 5.41e-25 | 147 |
| hsa05208 | Colorectum | AD | Chemical carcinogenesis - reactive oxygen species | 126/2092 | 223/8465 | 1.01e-24 | 1.68e-22 | 1.07e-22 | 126 |
| hsa00190 | Colorectum | AD | Oxidative phosphorylation | 86/2092 | 134/8465 | 2.47e-22 | 2.76e-20 | 1.76e-20 | 86 |
| hsa05415 | Colorectum | AD | Diabetic cardiomyopathy | 114/2092 | 203/8465 | 3.65e-22 | 3.06e-20 | 1.95e-20 | 114 |
| hsa05010 | Colorectum | AD | Alzheimer disease | 174/2092 | 384/8465 | 1.82e-19 | 9.26e-18 | 5.91e-18 | 174 |
| hsa05016 | Colorectum | AD | Huntington disease | 147/2092 | 306/8465 | 1.93e-19 | 9.26e-18 | 5.91e-18 | 147 |
| hsa04714 | Colorectum | AD | Thermogenesis | 120/2092 | 232/8465 | 2.76e-19 | 1.16e-17 | 7.37e-18 | 120 |
| hsa04932 | Colorectum | AD | Non-alcoholic fatty liver disease | 90/2092 | 155/8465 | 4.83e-19 | 1.80e-17 | 1.15e-17 | 90 |
| hsa05020 | Colorectum | AD | Prion disease | 133/2092 | 273/8465 | 2.47e-18 | 8.29e-17 | 5.29e-17 | 133 |
| hsa05014 | Colorectum | AD | Amyotrophic lateral sclerosis | 164/2092 | 364/8465 | 4.28e-18 | 1.27e-16 | 8.09e-17 | 164 |
| hsa05022 | Colorectum | AD | Pathways of neurodegeneration - multiple diseases | 201/2092 | 476/8465 | 4.54e-18 | 1.27e-16 | 8.09e-17 | 201 |
| hsa04723 | Colorectum | AD | Retrograde endocannabinoid signaling | 59/2092 | 148/8465 | 2.94e-05 | 2.73e-04 | 1.74e-04 | 59 |
| hsa050121 | Colorectum | AD | Parkinson disease | 147/2092 | 266/8465 | 2.53e-27 | 8.48e-25 | 5.41e-25 | 147 |
| hsa052081 | Colorectum | AD | Chemical carcinogenesis - reactive oxygen species | 126/2092 | 223/8465 | 1.01e-24 | 1.68e-22 | 1.07e-22 | 126 |
| hsa001901 | Colorectum | AD | Oxidative phosphorylation | 86/2092 | 134/8465 | 2.47e-22 | 2.76e-20 | 1.76e-20 | 86 |
| hsa054151 | Colorectum | AD | Diabetic cardiomyopathy | 114/2092 | 203/8465 | 3.65e-22 | 3.06e-20 | 1.95e-20 | 114 |
| hsa050101 | Colorectum | AD | Alzheimer disease | 174/2092 | 384/8465 | 1.82e-19 | 9.26e-18 | 5.91e-18 | 174 |
| hsa050161 | Colorectum | AD | Huntington disease | 147/2092 | 306/8465 | 1.93e-19 | 9.26e-18 | 5.91e-18 | 147 |
| hsa047141 | Colorectum | AD | Thermogenesis | 120/2092 | 232/8465 | 2.76e-19 | 1.16e-17 | 7.37e-18 | 120 |
| hsa049321 | Colorectum | AD | Non-alcoholic fatty liver disease | 90/2092 | 155/8465 | 4.83e-19 | 1.80e-17 | 1.15e-17 | 90 |
| Page: 1 2 3 4 5 6 7 8 9 10 11 12 13 14 |
Top |
Cell-cell communication analysis |
| Identification of potential cell-cell interactions between two cell types and their ligand-receptor pairs for different disease states |
| Ligand | Receptor | LRpair | Pathway | Tissue | Disease Stage |
| Page: 1 |
Top |
Single-cell gene regulatory network inference analysis |
| Find out the significant the regulons (TFs) and the target genes of each regulon across cell types for different disease states |
| TF | Cell Type | Tissue | Disease Stage | Target Gene | RSS | Regulon Activity |
| ∗The dot plots of a searched regulon are shown for all cell subpopulations in each disease state of each tissue based on the regulon specific score inferred using pySCENIC and by calculating the average expression. |
| Page: 1 |
Top |
Somatic mutation of malignant transformation related genes |
| Annotation of somatic variants for genes involved in malignant transformation |
| Hugo Symbol | Variant Class | Variant Classification | dbSNP RS | HGVSc | HGVSp | HGVSp Short | SWISSPROT | BIOTYPE | SIFT | PolyPhen | Tumor Sample Barcode | Tissue | Histology | Sex | Age | Stage | Therapy Types | Drugs | Outcome |
| NDUFS3 | SNV | Missense_Mutation | c.700N>T | p.Asp234Tyr | p.D234Y | O75489 | protein_coding | deleterious(0) | probably_damaging(0.987) | TCGA-C8-A12Y-01 | Breast | breast invasive carcinoma | Female | <65 | I/II | Unknown | Unknown | SD | |
| NDUFS3 | SNV | Missense_Mutation | novel | c.146N>G | p.Pro49Arg | p.P49R | O75489 | protein_coding | deleterious(0.02) | benign(0.319) | TCGA-C8-A8HR-01 | Breast | breast invasive carcinoma | Female | <65 | III/IV | Chemotherapy | 5-fluorouracil | CR |
| NDUFS3 | insertion | Nonsense_Mutation | novel | c.307_308insTTCAAGCCCTTAAGTTCTTAGCTTGAGAACCTGGTAT | p.His103LeufsTer9 | p.H103Lfs*9 | O75489 | protein_coding | TCGA-AN-A0FX-01 | Breast | breast invasive carcinoma | Female | <65 | I/II | Unknown | Unknown | SD | ||
| NDUFS3 | SNV | Missense_Mutation | c.247N>A | p.Glu83Lys | p.E83K | O75489 | protein_coding | deleterious(0) | benign(0.194) | TCGA-IR-A3LI-01 | Cervix | cervical & endocervical cancer | Female | <65 | I/II | Chemotherapy | cisplatin | CR | |
| NDUFS3 | SNV | Missense_Mutation | rs201457989 | c.34N>T | p.Arg12Cys | p.R12C | O75489 | protein_coding | deleterious(0) | benign(0.306) | TCGA-5M-AAT6-01 | Colorectum | colon adenocarcinoma | Female | <65 | III/IV | Unknown | Unknown | PD |
| NDUFS3 | SNV | Missense_Mutation | c.214N>C | p.Tyr72His | p.Y72H | O75489 | protein_coding | deleterious(0.03) | probably_damaging(0.962) | TCGA-AA-3492-01 | Colorectum | colon adenocarcinoma | Female | >=65 | I/II | Unknown | Unknown | SD | |
| NDUFS3 | SNV | Missense_Mutation | novel | c.263T>A | p.Ile88Asn | p.I88N | O75489 | protein_coding | deleterious(0) | possibly_damaging(0.794) | TCGA-AA-3949-01 | Colorectum | colon adenocarcinoma | Female | >=65 | III/IV | Unknown | Unknown | SD |
| NDUFS3 | SNV | Missense_Mutation | c.11N>T | p.Ala4Val | p.A4V | O75489 | protein_coding | tolerated(0.07) | benign(0) | TCGA-AD-A5EJ-01 | Colorectum | colon adenocarcinoma | Female | >=65 | I/II | Unknown | Unknown | SD | |
| NDUFS3 | SNV | Missense_Mutation | rs747054142 | c.432G>C | p.Lys144Asn | p.K144N | O75489 | protein_coding | deleterious(0) | probably_damaging(0.966) | TCGA-CM-4746-01 | Colorectum | colon adenocarcinoma | Male | <65 | I/II | Unknown | Unknown | SD |
| NDUFS3 | SNV | Missense_Mutation | novel | c.127N>G | p.Thr43Ala | p.T43A | O75489 | protein_coding | tolerated(0.42) | benign(0.005) | TCGA-A5-A1OF-01 | Endometrium | uterine corpus endometrioid carcinoma | Female | <65 | I/II | Unknown | Unknown | SD |
| Page: 1 2 3 |
Top |
Related drugs of malignant transformation related genes |
| Identification of chemicals and drugs interact with genes involved in malignant transfromation |
| (DGIdb 4.0) |
| Entrez ID | Symbol | Category | Interaction Types | Drug Claim Name | Drug Name | PMIDs |
| 4722 | NDUFS3 | DRUGGABLE GENOME, ENZYME | inhibitor | CHEMBL3545135 | NV-128 | |
| 4722 | NDUFS3 | DRUGGABLE GENOME, ENZYME | inhibitor | CHEMBL3545320 | ME-344 | |
| 4722 | NDUFS3 | DRUGGABLE GENOME, ENZYME | inhibitor | CHEMBL1703 | METFORMIN HYDROCHLORIDE |
| Page: 1 |

Copyright 2023-Present -The University of Texas Health Science Center at Houston |