| Tissue | Expression Dynamics | Abbreviation |
| Cervix | 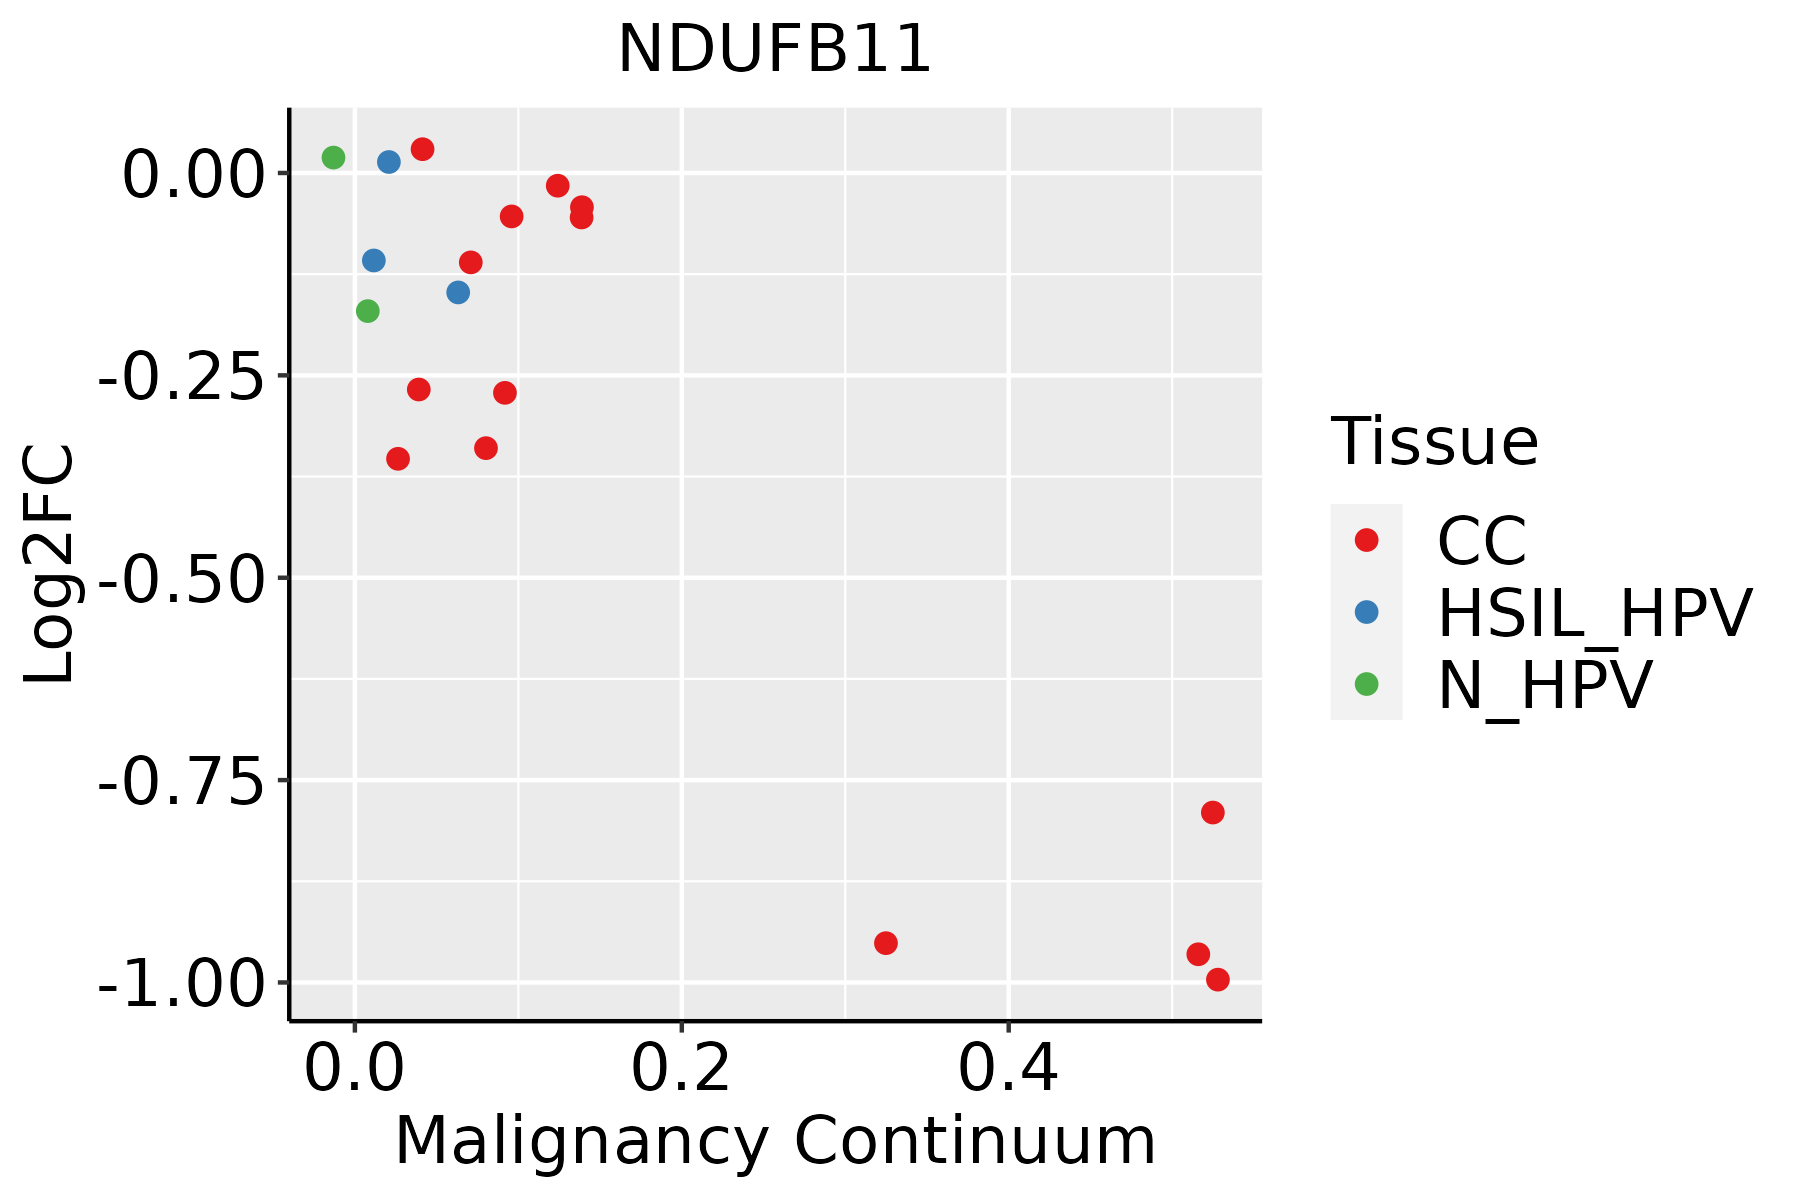 | CC: Cervix cancer |
| HSIL_HPV: HPV-infected high-grade squamous intraepithelial lesions |
| N_HPV: HPV-infected normal cervix |
| Colorectum (GSE201348) |  | FAP: Familial adenomatous polyposis |
| CRC: Colorectal cancer |
| Colorectum (HTA11) |  | AD: Adenomas |
| SER: Sessile serrated lesions |
| MSI-H: Microsatellite-high colorectal cancer |
| MSS: Microsatellite stable colorectal cancer |
| Endometrium | 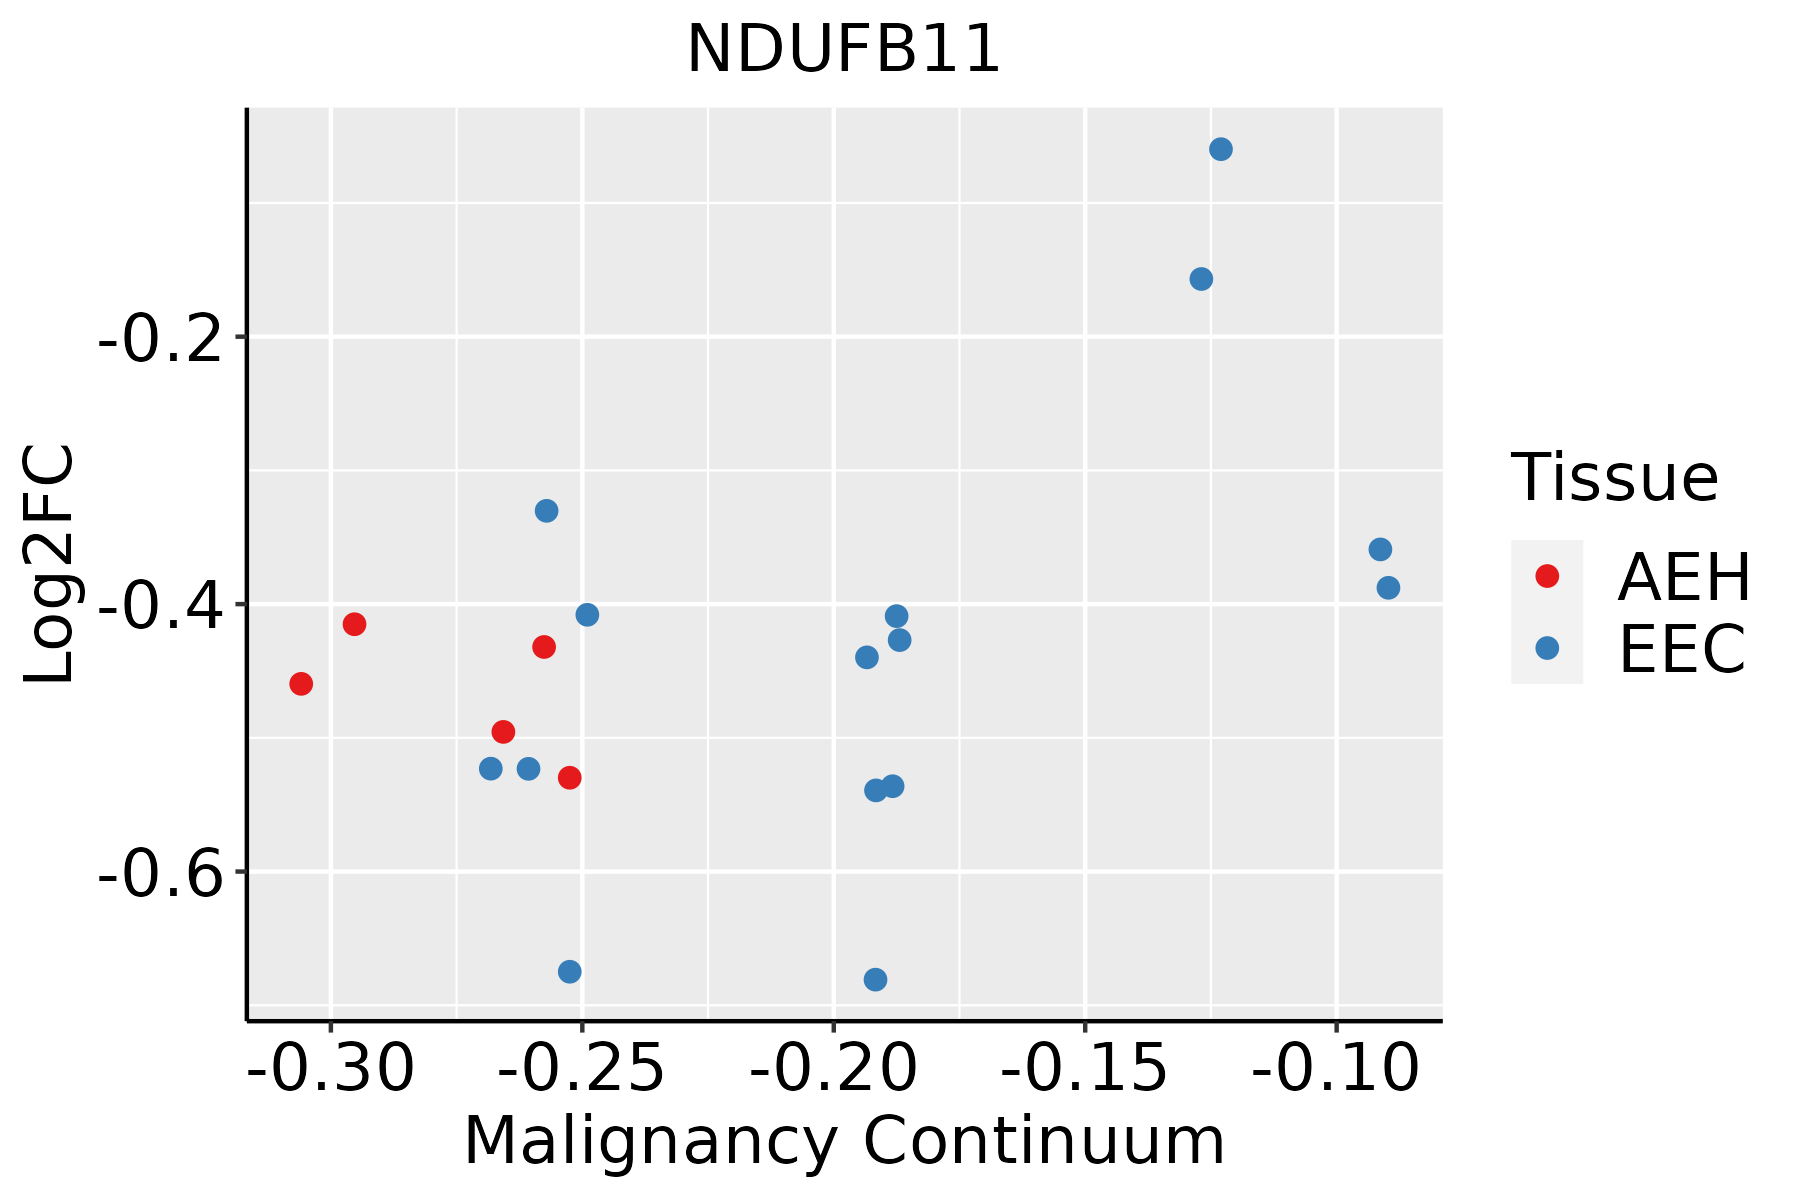 | AEH: Atypical endometrial hyperplasia |
| EEC: Endometrioid Cancer |
| Esophagus | 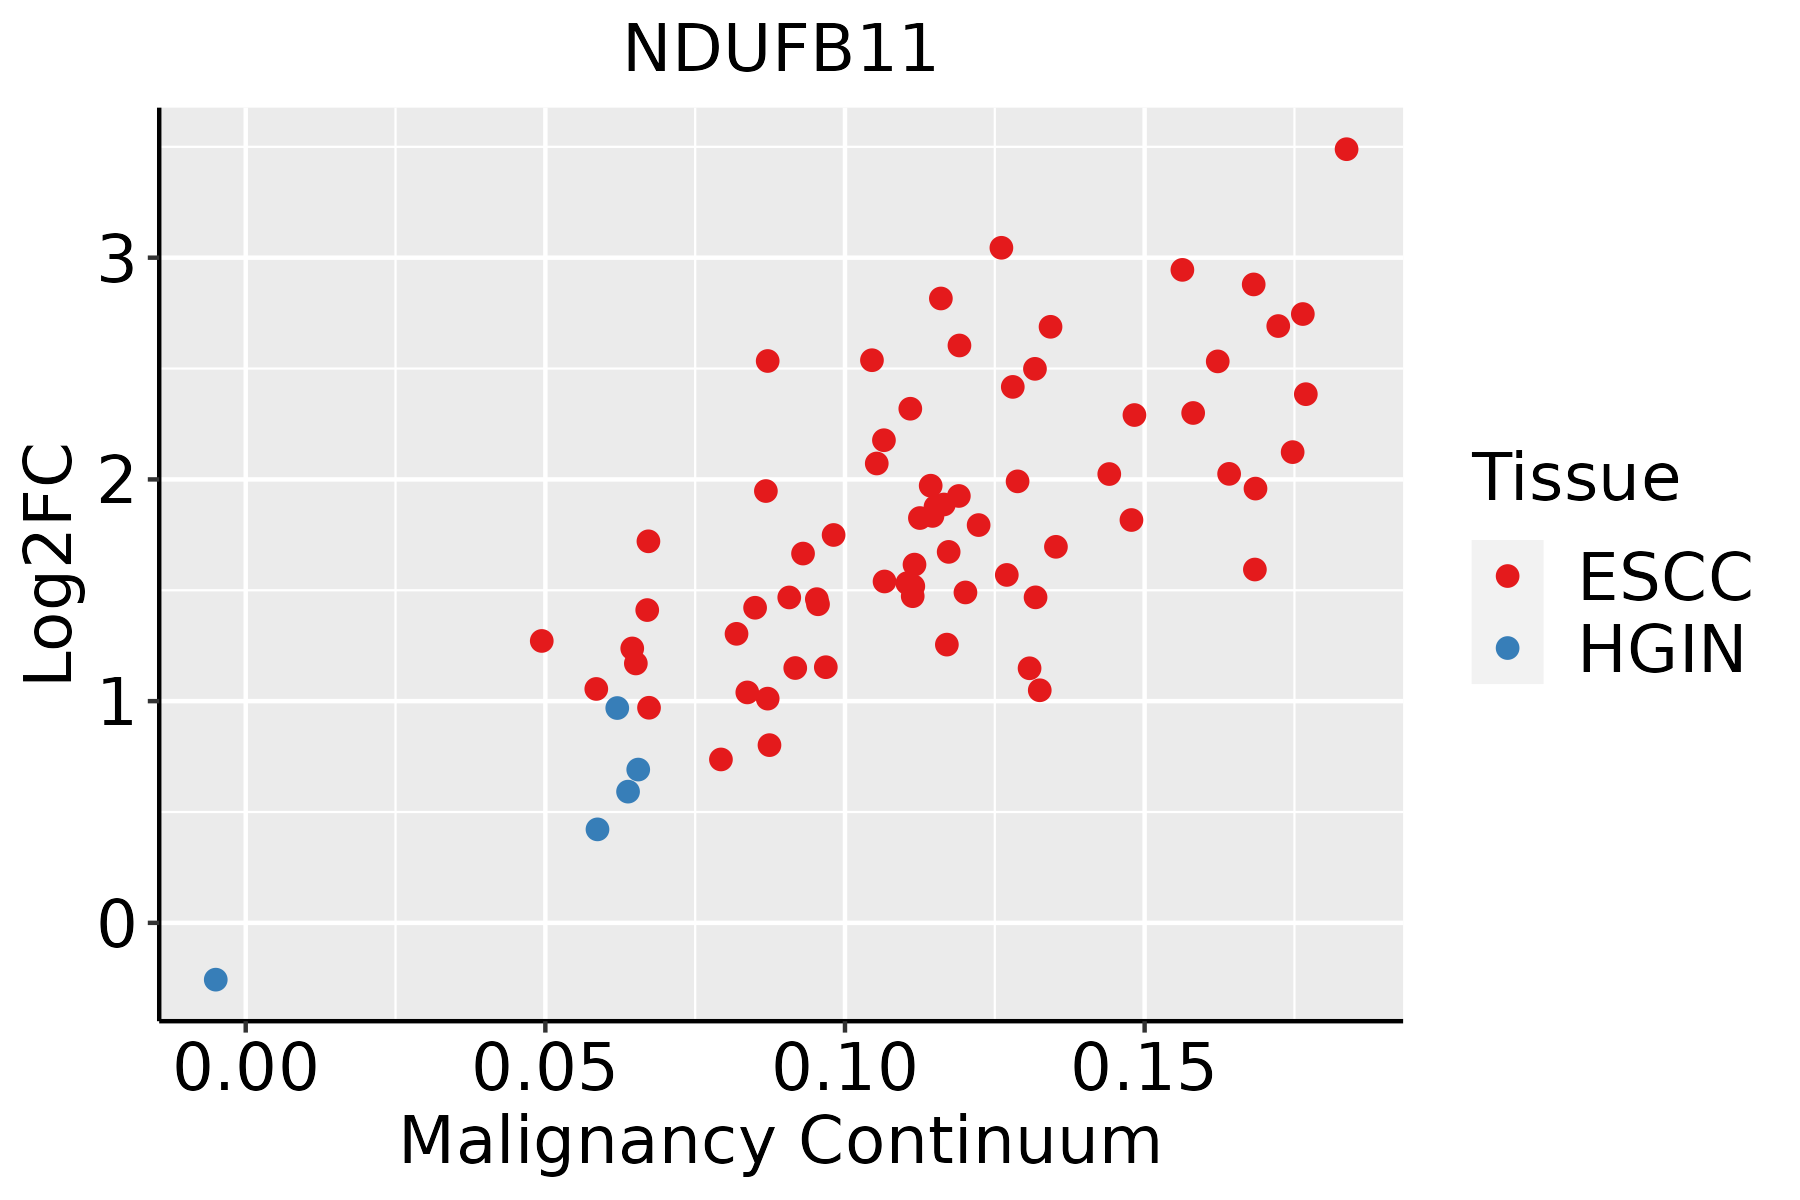 | ESCC: Esophageal squamous cell carcinoma |
| HGIN: High-grade intraepithelial neoplasias |
| LGIN: Low-grade intraepithelial neoplasias |
| GC |  | CAG: Chronic atrophic gastritis |
| CAG with IM: Chronic atrophic gastritis with intestinal metaplasia |
| CSG: Chronic superficial gastritis |
| GC: Gastric cancer |
| SIM: Severe intestinal metaplasia |
| WIM: Wild intestinal metaplasia |
| Liver |  | HCC: Hepatocellular carcinoma |
| NAFLD: Non-alcoholic fatty liver disease |
| Oral Cavity |  | EOLP: Erosive Oral lichen planus |
| LP: leukoplakia |
| NEOLP: Non-erosive oral lichen planus |
| OSCC: Oral squamous cell carcinoma |
| Prostate | 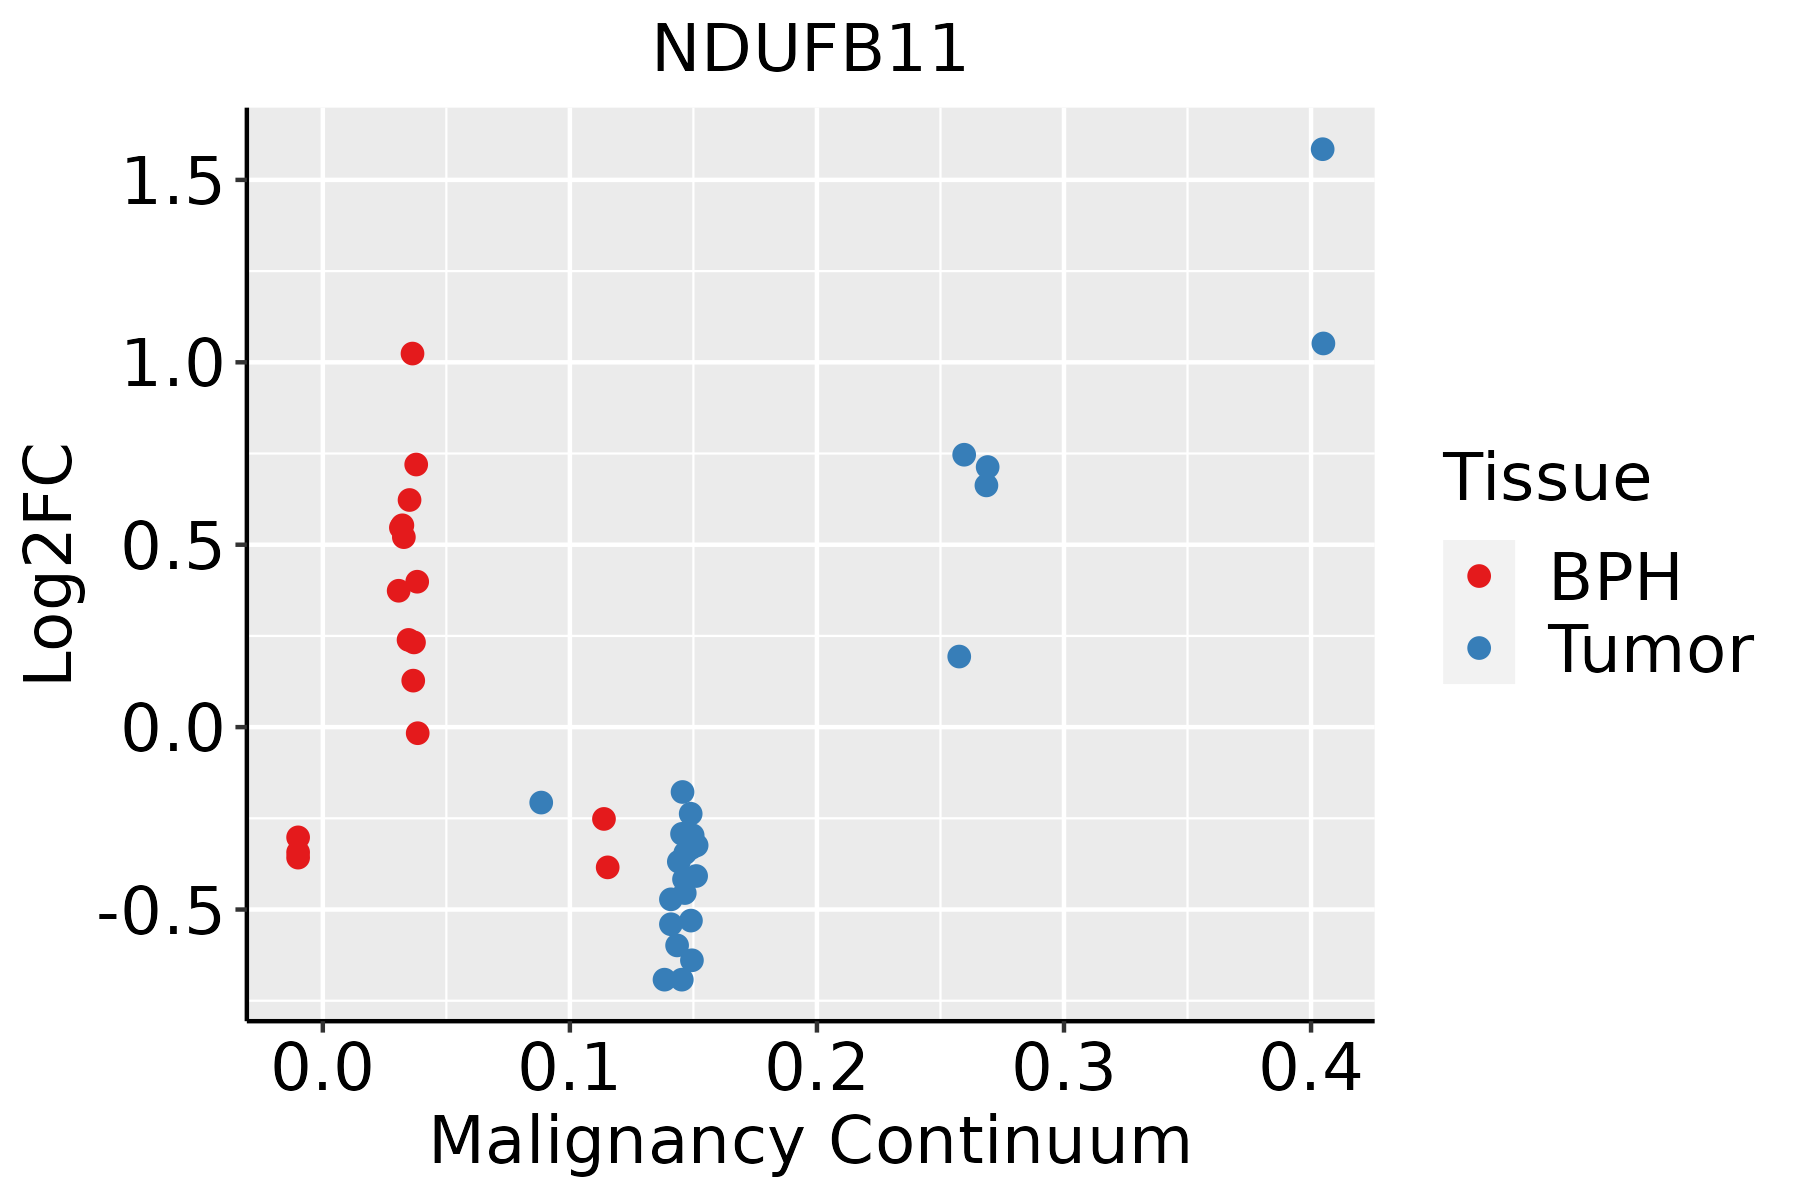 | BPH: Benign Prostatic Hyperplasia |
| Skin |  | AK: Actinic keratosis |
| cSCC: Cutaneous squamous cell carcinoma |
| SCCIS:squamous cell carcinoma in situ |
| Thyroid |  | ATC: Anaplastic thyroid cancer |
| HT: Hashimoto's thyroiditis |
| PTC: Papillary thyroid cancer |
| GO ID | Tissue | Disease Stage | Description | Gene Ratio | Bg Ratio | pvalue | p.adjust | Count |
| GO:00102579 | Cervix | CC | NADH dehydrogenase complex assembly | 22/2311 | 57/18723 | 4.28e-07 | 1.67e-05 | 22 |
| GO:00329819 | Cervix | CC | mitochondrial respiratory chain complex I assembly | 22/2311 | 57/18723 | 4.28e-07 | 1.67e-05 | 22 |
| GO:00331089 | Cervix | CC | mitochondrial respiratory chain complex assembly | 26/2311 | 93/18723 | 3.97e-05 | 6.18e-04 | 26 |
| GO:001025714 | Cervix | N_HPV | NADH dehydrogenase complex assembly | 10/534 | 57/18723 | 4.24e-06 | 1.65e-04 | 10 |
| GO:003298114 | Cervix | N_HPV | mitochondrial respiratory chain complex I assembly | 10/534 | 57/18723 | 4.24e-06 | 1.65e-04 | 10 |
| GO:003310814 | Cervix | N_HPV | mitochondrial respiratory chain complex assembly | 10/534 | 93/18723 | 3.17e-04 | 4.75e-03 | 10 |
| GO:0010257 | Colorectum | AD | NADH dehydrogenase complex assembly | 34/3918 | 57/18723 | 2.15e-10 | 1.89e-08 | 34 |
| GO:0032981 | Colorectum | AD | mitochondrial respiratory chain complex I assembly | 34/3918 | 57/18723 | 2.15e-10 | 1.89e-08 | 34 |
| GO:0033108 | Colorectum | AD | mitochondrial respiratory chain complex assembly | 46/3918 | 93/18723 | 8.95e-10 | 6.91e-08 | 46 |
| GO:00102571 | Colorectum | SER | NADH dehydrogenase complex assembly | 30/2897 | 57/18723 | 7.92e-11 | 1.19e-08 | 30 |
| GO:00329811 | Colorectum | SER | mitochondrial respiratory chain complex I assembly | 30/2897 | 57/18723 | 7.92e-11 | 1.19e-08 | 30 |
| GO:00331081 | Colorectum | SER | mitochondrial respiratory chain complex assembly | 39/2897 | 93/18723 | 8.13e-10 | 8.74e-08 | 39 |
| GO:00102572 | Colorectum | MSS | NADH dehydrogenase complex assembly | 33/3467 | 57/18723 | 4.07e-11 | 4.86e-09 | 33 |
| GO:00329812 | Colorectum | MSS | mitochondrial respiratory chain complex I assembly | 33/3467 | 57/18723 | 4.07e-11 | 4.86e-09 | 33 |
| GO:00331082 | Colorectum | MSS | mitochondrial respiratory chain complex assembly | 44/3467 | 93/18723 | 2.17e-10 | 2.09e-08 | 44 |
| GO:00102573 | Colorectum | MSI-H | NADH dehydrogenase complex assembly | 25/1319 | 57/18723 | 1.40e-14 | 3.53e-12 | 25 |
| GO:00329813 | Colorectum | MSI-H | mitochondrial respiratory chain complex I assembly | 25/1319 | 57/18723 | 1.40e-14 | 3.53e-12 | 25 |
| GO:00331083 | Colorectum | MSI-H | mitochondrial respiratory chain complex assembly | 30/1319 | 93/18723 | 5.71e-13 | 1.27e-10 | 30 |
| GO:001025710 | Endometrium | AEH | NADH dehydrogenase complex assembly | 25/2100 | 57/18723 | 4.20e-10 | 4.20e-08 | 25 |
| GO:003298110 | Endometrium | AEH | mitochondrial respiratory chain complex I assembly | 25/2100 | 57/18723 | 4.20e-10 | 4.20e-08 | 25 |
| Pathway ID | Tissue | Disease Stage | Description | Gene Ratio | Bg Ratio | pvalue | p.adjust | qvalue | Count |
| hsa0520820 | Cervix | CC | Chemical carcinogenesis - reactive oxygen species | 92/1267 | 223/8465 | 4.71e-22 | 5.09e-20 | 3.01e-20 | 92 |
| hsa0501220 | Cervix | CC | Parkinson disease | 102/1267 | 266/8465 | 1.81e-21 | 1.47e-19 | 8.66e-20 | 102 |
| hsa0019018 | Cervix | CC | Oxidative phosphorylation | 64/1267 | 134/8465 | 1.25e-19 | 8.07e-18 | 4.77e-18 | 64 |
| hsa0502018 | Cervix | CC | Prion disease | 98/1267 | 273/8465 | 2.64e-18 | 1.42e-16 | 8.42e-17 | 98 |
| hsa0541520 | Cervix | CC | Diabetic cardiomyopathy | 76/1267 | 203/8465 | 1.40e-15 | 6.46e-14 | 3.82e-14 | 76 |
| hsa0501018 | Cervix | CC | Alzheimer disease | 113/1267 | 384/8465 | 9.67e-14 | 3.92e-12 | 2.32e-12 | 113 |
| hsa0501618 | Cervix | CC | Huntington disease | 94/1267 | 306/8465 | 8.49e-13 | 3.06e-11 | 1.81e-11 | 94 |
| hsa0502218 | Cervix | CC | Pathways of neurodegeneration - multiple diseases | 128/1267 | 476/8465 | 2.87e-12 | 9.29e-11 | 5.50e-11 | 128 |
| hsa0493218 | Cervix | CC | Non-alcoholic fatty liver disease | 58/1267 | 155/8465 | 3.58e-12 | 1.05e-10 | 6.23e-11 | 58 |
| hsa0471420 | Cervix | CC | Thermogenesis | 76/1267 | 232/8465 | 4.29e-12 | 1.16e-10 | 6.85e-11 | 76 |
| hsa0501418 | Cervix | CC | Amyotrophic lateral sclerosis | 103/1267 | 364/8465 | 1.79e-11 | 4.47e-10 | 2.64e-10 | 103 |
| hsa0472318 | Cervix | CC | Retrograde endocannabinoid signaling | 42/1267 | 148/8465 | 1.79e-05 | 1.42e-04 | 8.40e-05 | 42 |
| hsa05208110 | Cervix | CC | Chemical carcinogenesis - reactive oxygen species | 92/1267 | 223/8465 | 4.71e-22 | 5.09e-20 | 3.01e-20 | 92 |
| hsa05012110 | Cervix | CC | Parkinson disease | 102/1267 | 266/8465 | 1.81e-21 | 1.47e-19 | 8.66e-20 | 102 |
| hsa0019019 | Cervix | CC | Oxidative phosphorylation | 64/1267 | 134/8465 | 1.25e-19 | 8.07e-18 | 4.77e-18 | 64 |
| hsa0502019 | Cervix | CC | Prion disease | 98/1267 | 273/8465 | 2.64e-18 | 1.42e-16 | 8.42e-17 | 98 |
| hsa05415110 | Cervix | CC | Diabetic cardiomyopathy | 76/1267 | 203/8465 | 1.40e-15 | 6.46e-14 | 3.82e-14 | 76 |
| hsa0501019 | Cervix | CC | Alzheimer disease | 113/1267 | 384/8465 | 9.67e-14 | 3.92e-12 | 2.32e-12 | 113 |
| hsa0501619 | Cervix | CC | Huntington disease | 94/1267 | 306/8465 | 8.49e-13 | 3.06e-11 | 1.81e-11 | 94 |
| hsa0502219 | Cervix | CC | Pathways of neurodegeneration - multiple diseases | 128/1267 | 476/8465 | 2.87e-12 | 9.29e-11 | 5.50e-11 | 128 |
| Hugo Symbol | Variant Class | Variant Classification | dbSNP RS | HGVSc | HGVSp | HGVSp Short | SWISSPROT | BIOTYPE | SIFT | PolyPhen | Tumor Sample Barcode | Tissue | Histology | Sex | Age | Stage | Therapy Types | Drugs | Outcome |
| NDUFB11 | SNV | Missense_Mutation | novel | c.406G>T | p.Val136Leu | p.V136L | Q9NX14 | protein_coding | tolerated(0.25) | possibly_damaging(0.472) | TCGA-E9-A22A-01 | Breast | breast invasive carcinoma | Female | >=65 | I/II | Hormone Therapy | tamoxiphen | SD |
| NDUFB11 | SNV | Missense_Mutation | rs781871228 | c.140G>A | p.Arg47Gln | p.R47Q | Q9NX14 | protein_coding | tolerated(0.19) | benign(0.086) | TCGA-C5-A2LZ-01 | Cervix | cervical & endocervical cancer | Female | >=65 | III/IV | Unknown | Unknown | PD |
| NDUFB11 | SNV | Missense_Mutation | rs782460503 | c.386N>A | p.Arg129His | p.R129H | Q9NX14 | protein_coding | deleterious(0.02) | benign(0.103) | TCGA-EA-A3HT-01 | Cervix | cervical & endocervical cancer | Female | >=65 | I/II | Unknown | Unknown | SD |
| NDUFB11 | SNV | Missense_Mutation | | c.263N>C | p.Arg88Pro | p.R88P | Q9NX14 | protein_coding | deleterious(0) | probably_damaging(0.946) | TCGA-Q1-A73P-01 | Cervix | cervical & endocervical cancer | Female | <65 | I/II | Unknown | Unknown | SD |
| NDUFB11 | SNV | Missense_Mutation | novel | c.11N>A | p.Gly4Glu | p.G4E | Q9NX14 | protein_coding | tolerated_low_confidence(0.07) | benign(0.031) | TCGA-AA-A01P-01 | Colorectum | colon adenocarcinoma | Female | >=65 | III/IV | Unknown | Unknown | PD |
| NDUFB11 | SNV | Missense_Mutation | novel | c.233A>C | p.Lys78Thr | p.K78T | Q9NX14 | protein_coding | tolerated(0.19) | benign(0.122) | TCGA-A5-A1OF-01 | Endometrium | uterine corpus endometrioid carcinoma | Female | <65 | I/II | Unknown | Unknown | SD |
| NDUFB11 | SNV | Missense_Mutation | rs782682185 | c.283G>A | p.Val95Ile | p.V95I | Q9NX14 | protein_coding | tolerated(1) | benign(0.009) | TCGA-AJ-A3BG-01 | Endometrium | uterine corpus endometrioid carcinoma | Female | >=65 | I/II | Chemotherapy | carboplatin | PD |
| NDUFB11 | SNV | Missense_Mutation | rs782460503 | c.386N>A | p.Arg129His | p.R129H | Q9NX14 | protein_coding | deleterious(0.02) | benign(0.103) | TCGA-AJ-A3EL-01 | Endometrium | uterine corpus endometrioid carcinoma | Female | <65 | I/II | Unknown | Unknown | SD |
| NDUFB11 | SNV | Missense_Mutation | rs782460503 | c.386N>A | p.Arg129His | p.R129H | Q9NX14 | protein_coding | deleterious(0.02) | benign(0.103) | TCGA-AP-A0LM-01 | Endometrium | uterine corpus endometrioid carcinoma | Female | <65 | III/IV | Chemotherapy | cisplatin | SD |
| NDUFB11 | SNV | Missense_Mutation | | c.263N>A | p.Arg88Gln | p.R88Q | Q9NX14 | protein_coding | tolerated(0.09) | benign(0.095) | TCGA-AP-A1DV-01 | Endometrium | uterine corpus endometrioid carcinoma | Female | <65 | I/II | Unknown | Unknown | SD |


