
|
|||||
|
 | |
| |
| |
| |
| |
| |
|
Gene: NDUFAF6 |
Gene summary for NDUFAF6 |
| Gene information | Species | Human | Gene symbol | NDUFAF6 | Gene ID | 137682 |
| Gene name | NADH:ubiquinone oxidoreductase complex assembly factor 6 | |
| Gene Alias | C8orf38 | |
| Cytomap | 8q22.1 | |
| Gene Type | protein-coding | GO ID | GO:0006996 | UniProtAcc | A0A075B6P0 |
Top |
Malignant transformation analysis |
| Identification of the aberrant gene expression in precancerous and cancerous lesions by comparing the gene expression of stem-like cells in diseased tissues with normal stem cells |
| Entrez ID | Symbol | Replicates | Species | Organ | Tissue | Adj P-value | Log2FC | Malignancy |
| 137682 | NDUFAF6 | GSM4909281 | Human | Breast | IDC | 1.27e-08 | 2.97e-01 | 0.21 |
| 137682 | NDUFAF6 | GSM4909282 | Human | Breast | IDC | 1.22e-06 | 2.16e-01 | -0.0288 |
| 137682 | NDUFAF6 | GSM4909286 | Human | Breast | IDC | 1.12e-04 | 2.39e-01 | 0.1081 |
| 137682 | NDUFAF6 | GSM4909293 | Human | Breast | IDC | 3.20e-02 | 1.48e-01 | 0.1581 |
| 137682 | NDUFAF6 | GSM4909304 | Human | Breast | IDC | 4.64e-31 | 5.70e-01 | 0.1636 |
| 137682 | NDUFAF6 | GSM4909305 | Human | Breast | IDC | 4.74e-02 | 2.01e-01 | 0.0436 |
| 137682 | NDUFAF6 | GSM4909306 | Human | Breast | IDC | 9.96e-04 | 2.21e-01 | 0.1564 |
| 137682 | NDUFAF6 | GSM4909307 | Human | Breast | IDC | 3.56e-03 | 2.33e-01 | 0.1569 |
| 137682 | NDUFAF6 | GSM4909308 | Human | Breast | IDC | 4.17e-12 | 3.48e-01 | 0.158 |
| 137682 | NDUFAF6 | GSM4909312 | Human | Breast | IDC | 5.37e-03 | 1.69e-01 | 0.1552 |
| 137682 | NDUFAF6 | GSM4909317 | Human | Breast | IDC | 1.79e-03 | 1.98e-01 | 0.1355 |
| 137682 | NDUFAF6 | GSM4909319 | Human | Breast | IDC | 7.23e-08 | 1.43e-02 | 0.1563 |
| 137682 | NDUFAF6 | GSM4909321 | Human | Breast | IDC | 5.29e-05 | 2.19e-01 | 0.1559 |
| 137682 | NDUFAF6 | M1 | Human | Breast | IDC | 1.75e-05 | 2.77e-01 | 0.1577 |
| 137682 | NDUFAF6 | DCIS2 | Human | Breast | DCIS | 1.55e-14 | 2.42e-02 | 0.0085 |
| 137682 | NDUFAF6 | CCI_1 | Human | Cervix | CC | 6.72e-03 | 5.06e-01 | 0.528 |
| 137682 | NDUFAF6 | CCI_2 | Human | Cervix | CC | 1.14e-16 | 1.62e+00 | 0.5249 |
| 137682 | NDUFAF6 | CCI_3 | Human | Cervix | CC | 4.36e-05 | 6.99e-01 | 0.516 |
| 137682 | NDUFAF6 | LZE2T | Human | Esophagus | ESCC | 1.05e-03 | 6.50e-01 | 0.082 |
| 137682 | NDUFAF6 | LZE4T | Human | Esophagus | ESCC | 1.06e-07 | 3.08e-01 | 0.0811 |
| Page: 1 2 3 4 5 6 7 |
| Tissue | Expression Dynamics | Abbreviation |
| Breast | 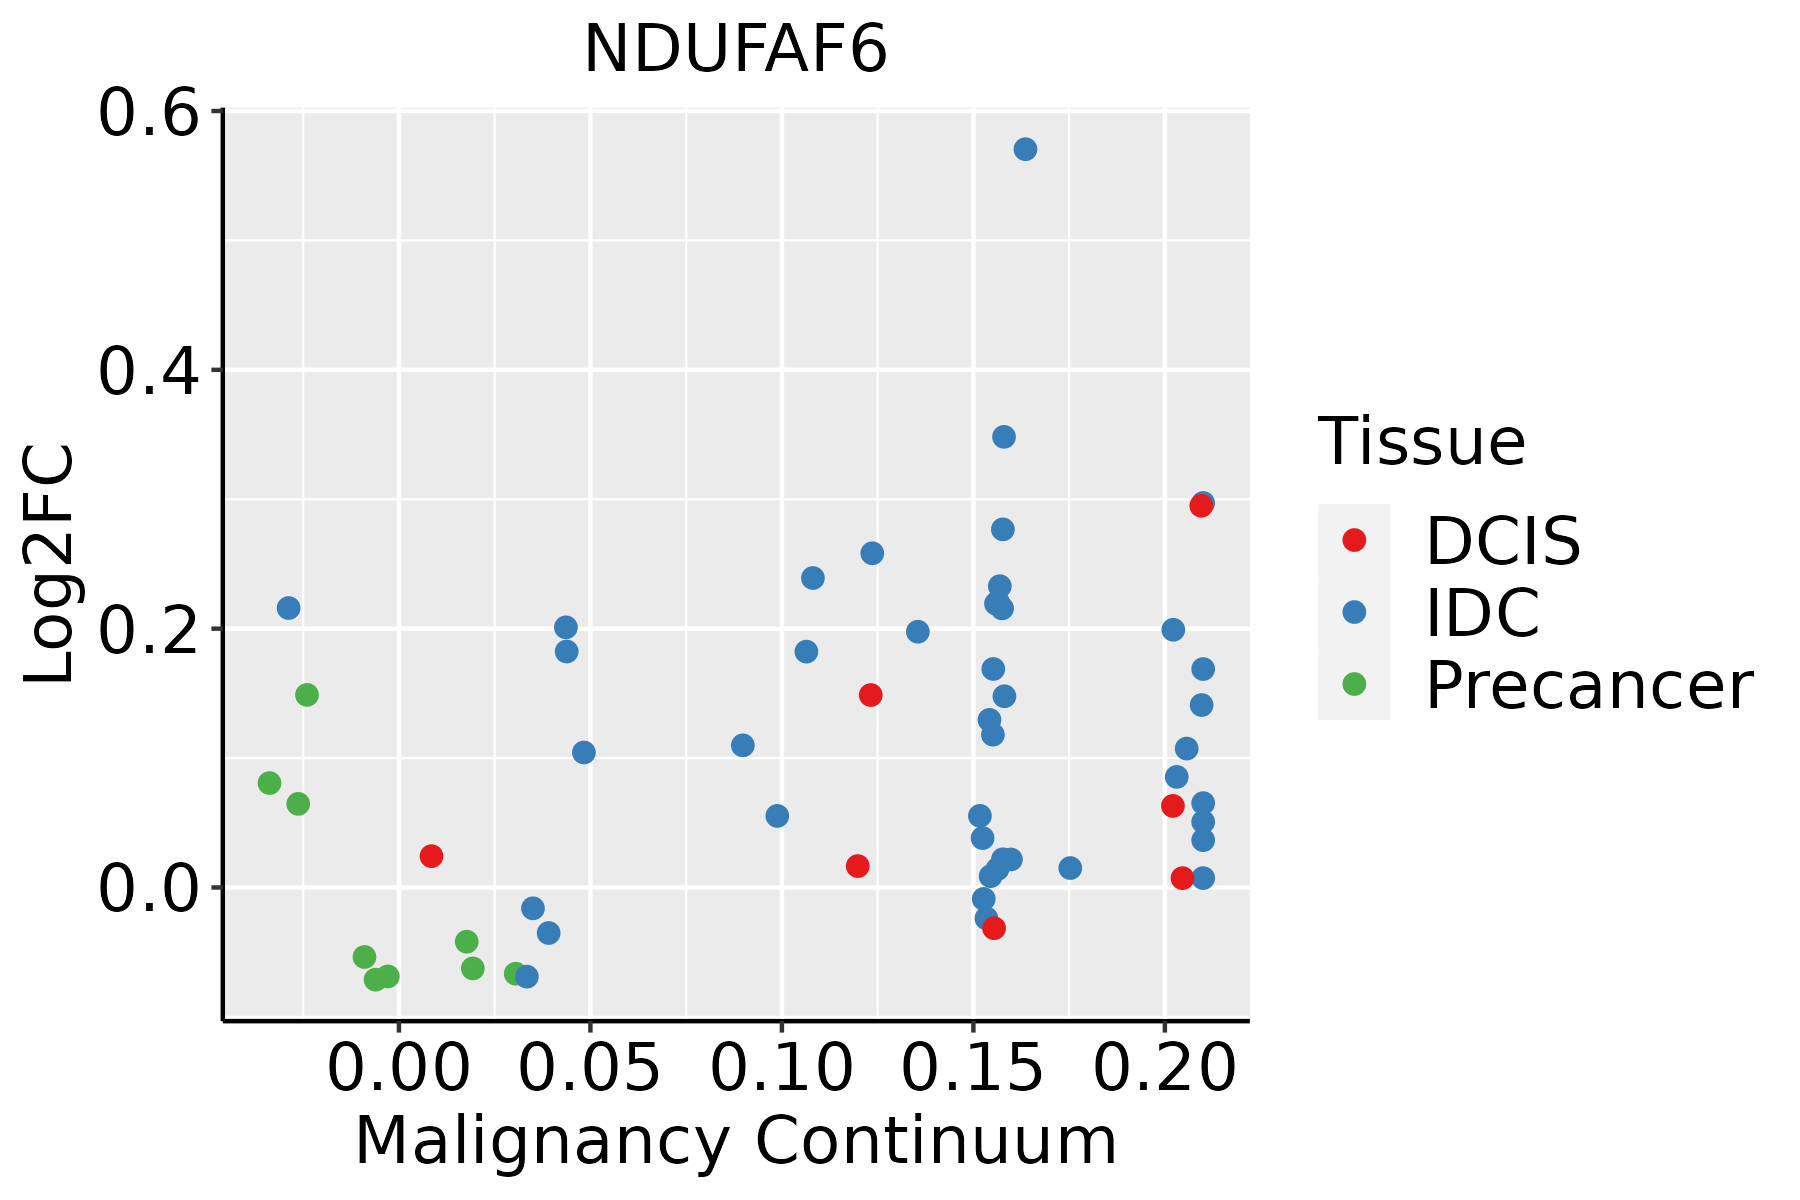 | IDC: Invasive ductal carcinoma |
| DCIS: Ductal carcinoma in situ | ||
| Precancer(BRCA1-mut): Precancerous lesion from BRCA1 mutation carriers | ||
| Cervix | 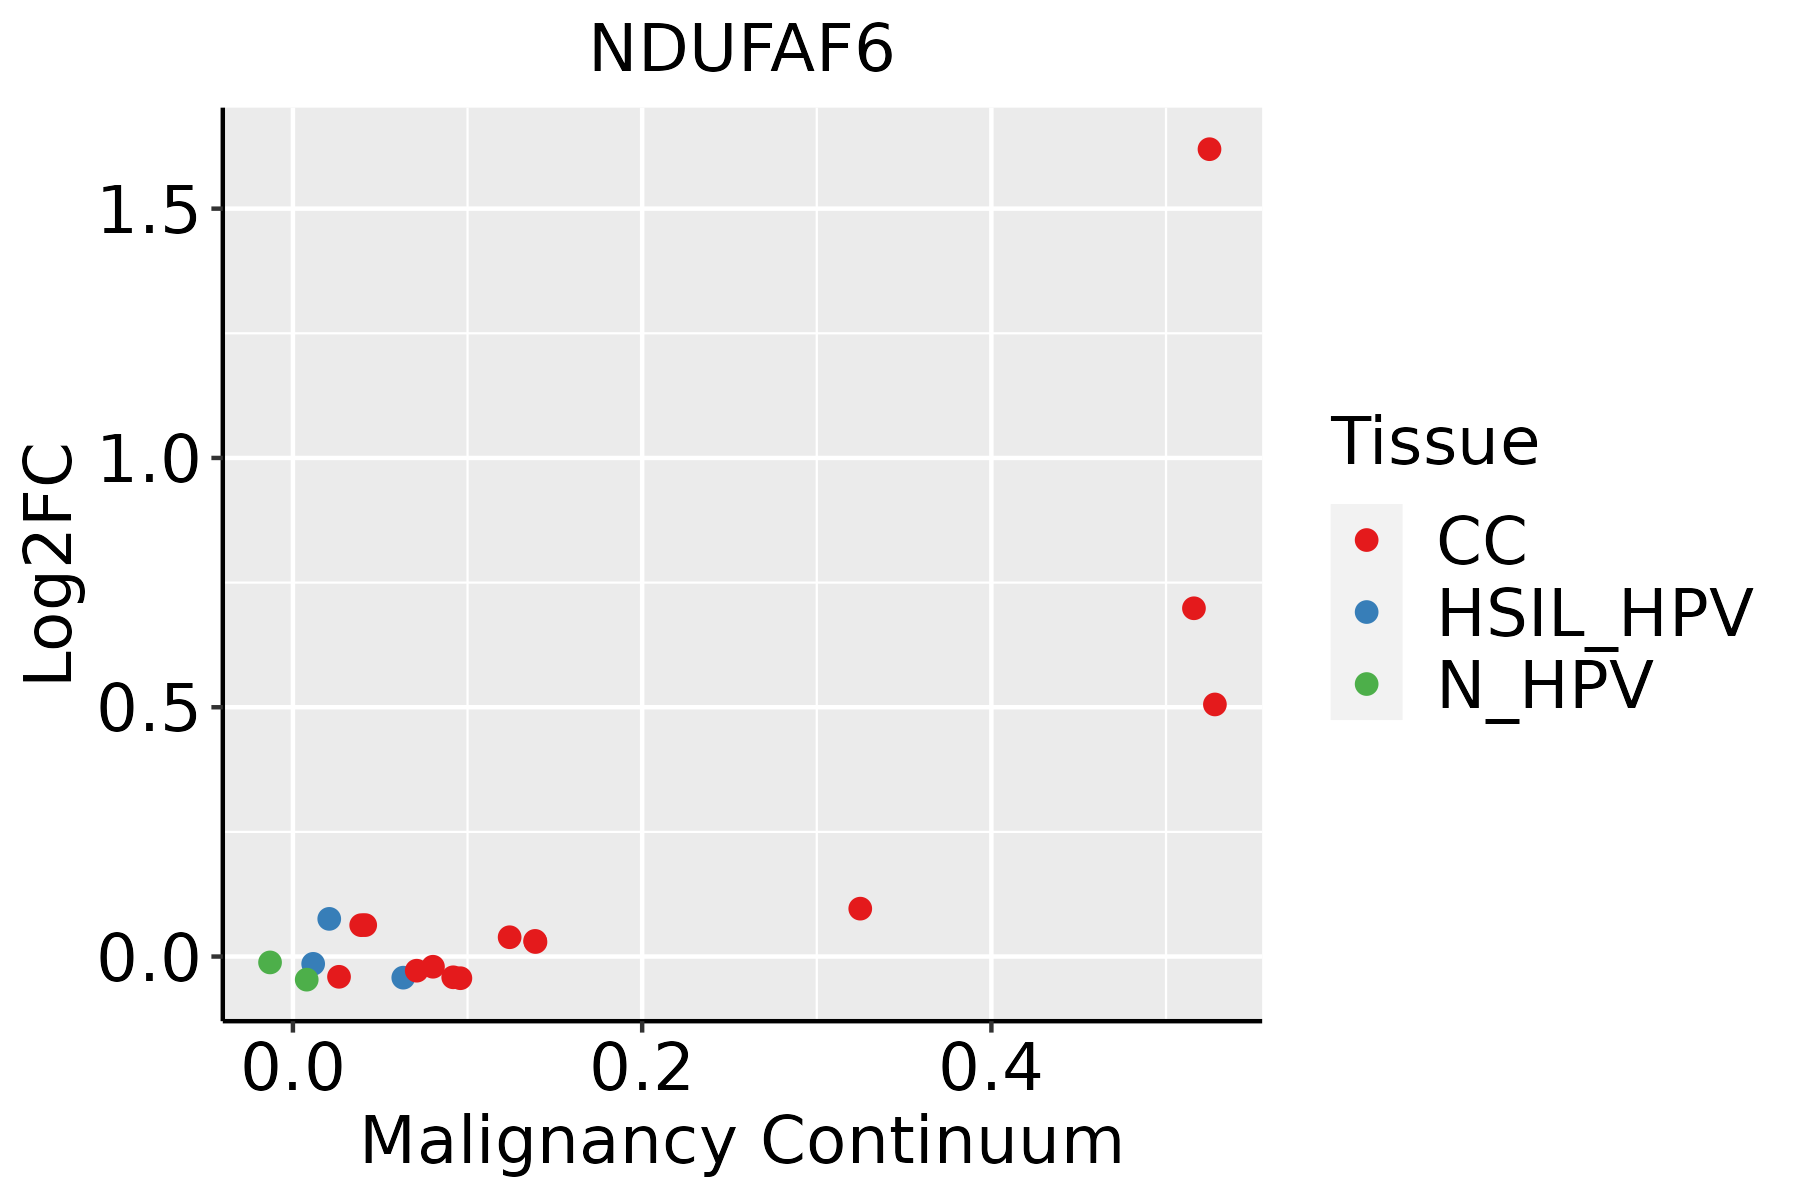 | CC: Cervix cancer |
| HSIL_HPV: HPV-infected high-grade squamous intraepithelial lesions | ||
| N_HPV: HPV-infected normal cervix | ||
| Esophagus | 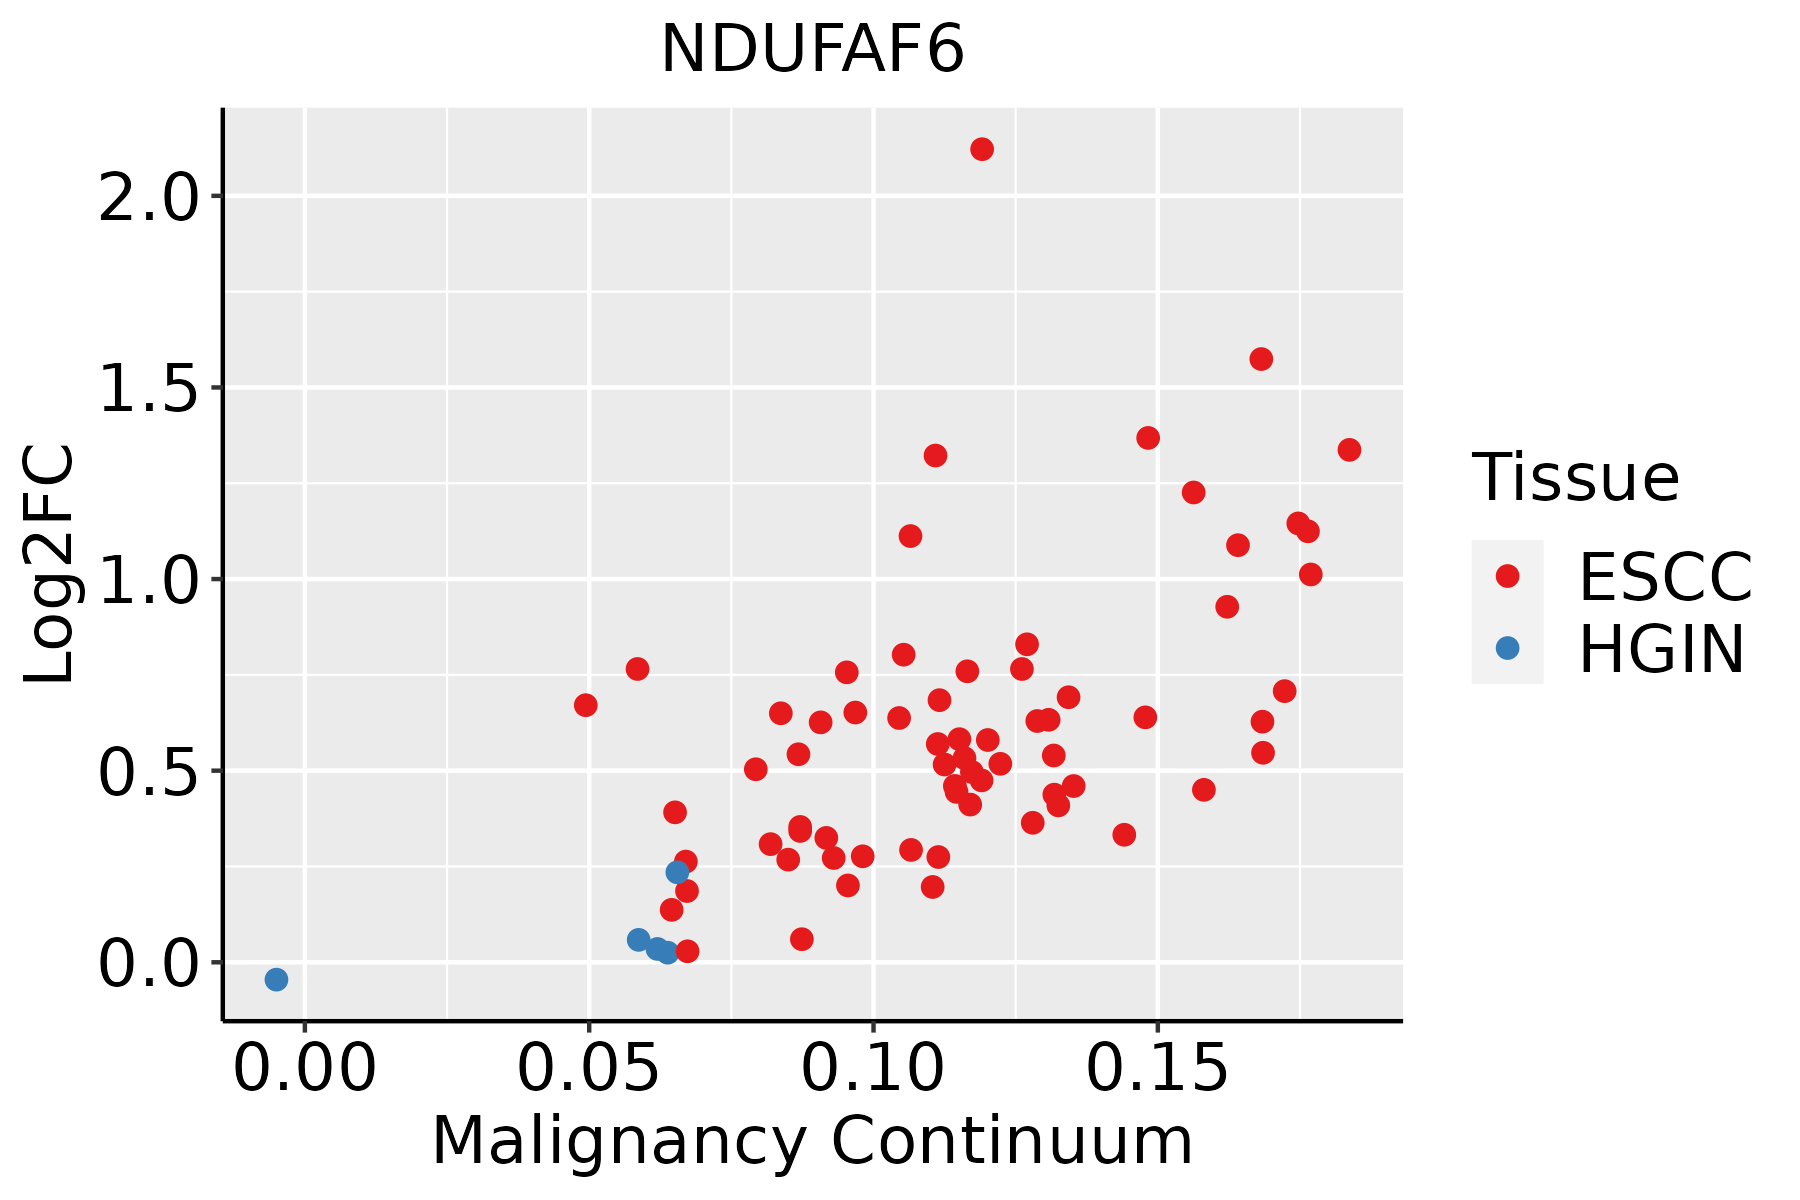 | ESCC: Esophageal squamous cell carcinoma |
| HGIN: High-grade intraepithelial neoplasias | ||
| LGIN: Low-grade intraepithelial neoplasias | ||
| Liver | 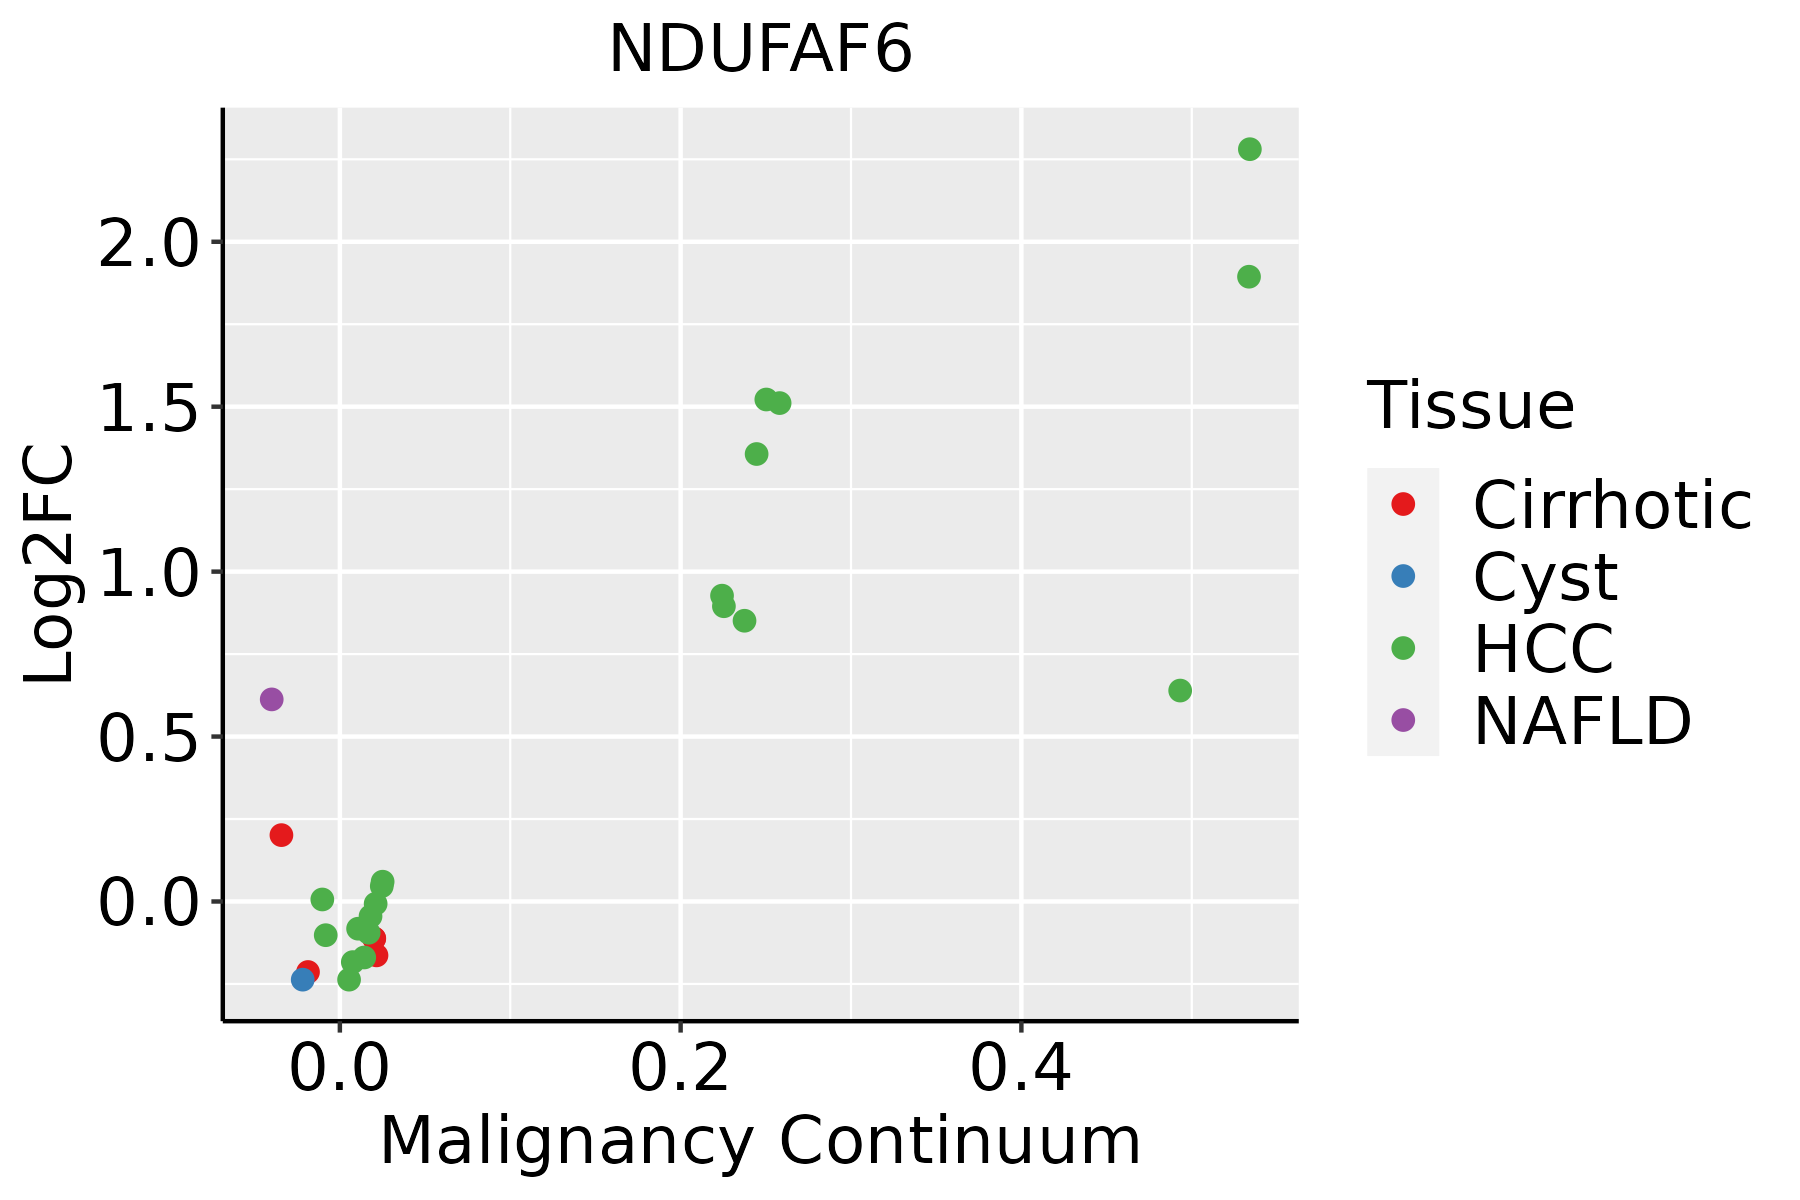 | HCC: Hepatocellular carcinoma |
| NAFLD: Non-alcoholic fatty liver disease | ||
| Oral Cavity |  | EOLP: Erosive Oral lichen planus |
| LP: leukoplakia | ||
| NEOLP: Non-erosive oral lichen planus | ||
| OSCC: Oral squamous cell carcinoma | ||
| Skin | 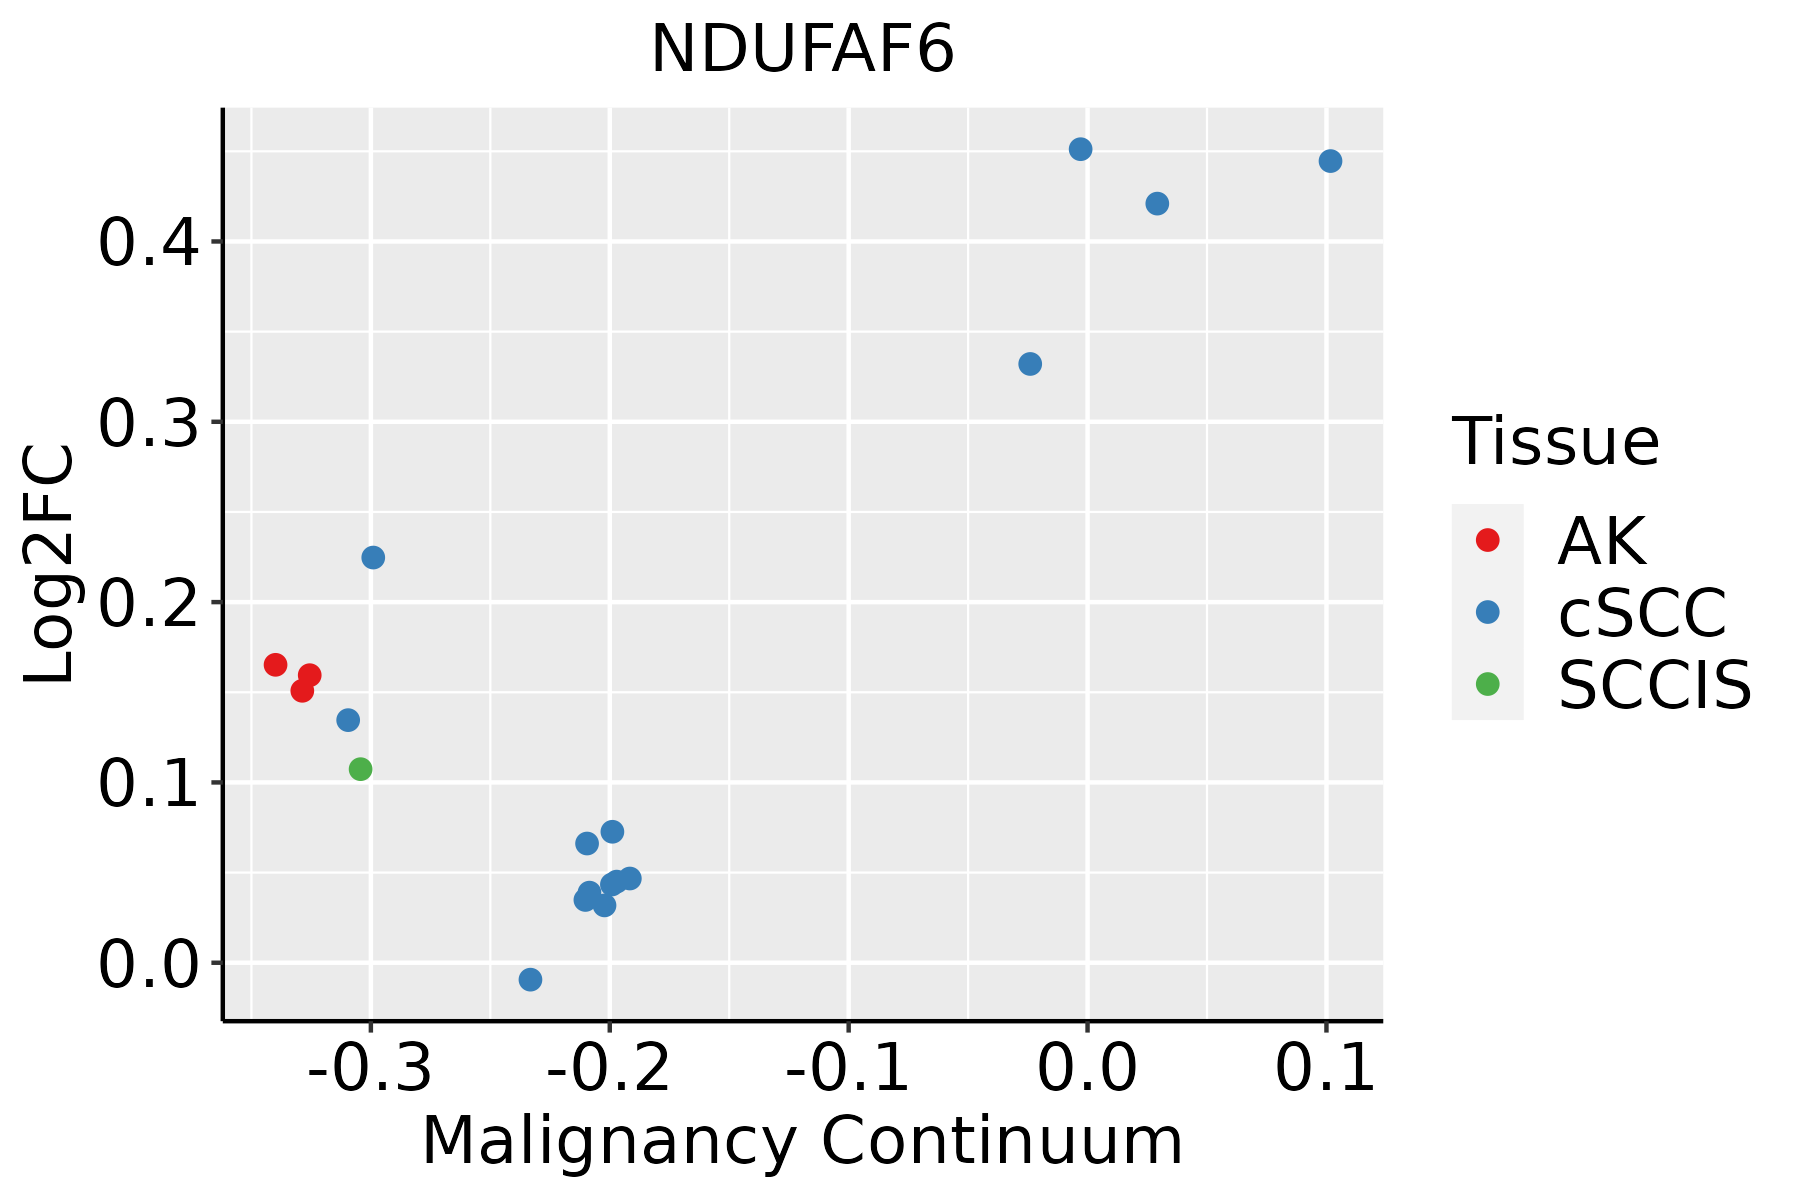 | AK: Actinic keratosis |
| cSCC: Cutaneous squamous cell carcinoma | ||
| SCCIS:squamous cell carcinoma in situ | ||
| Thyroid | 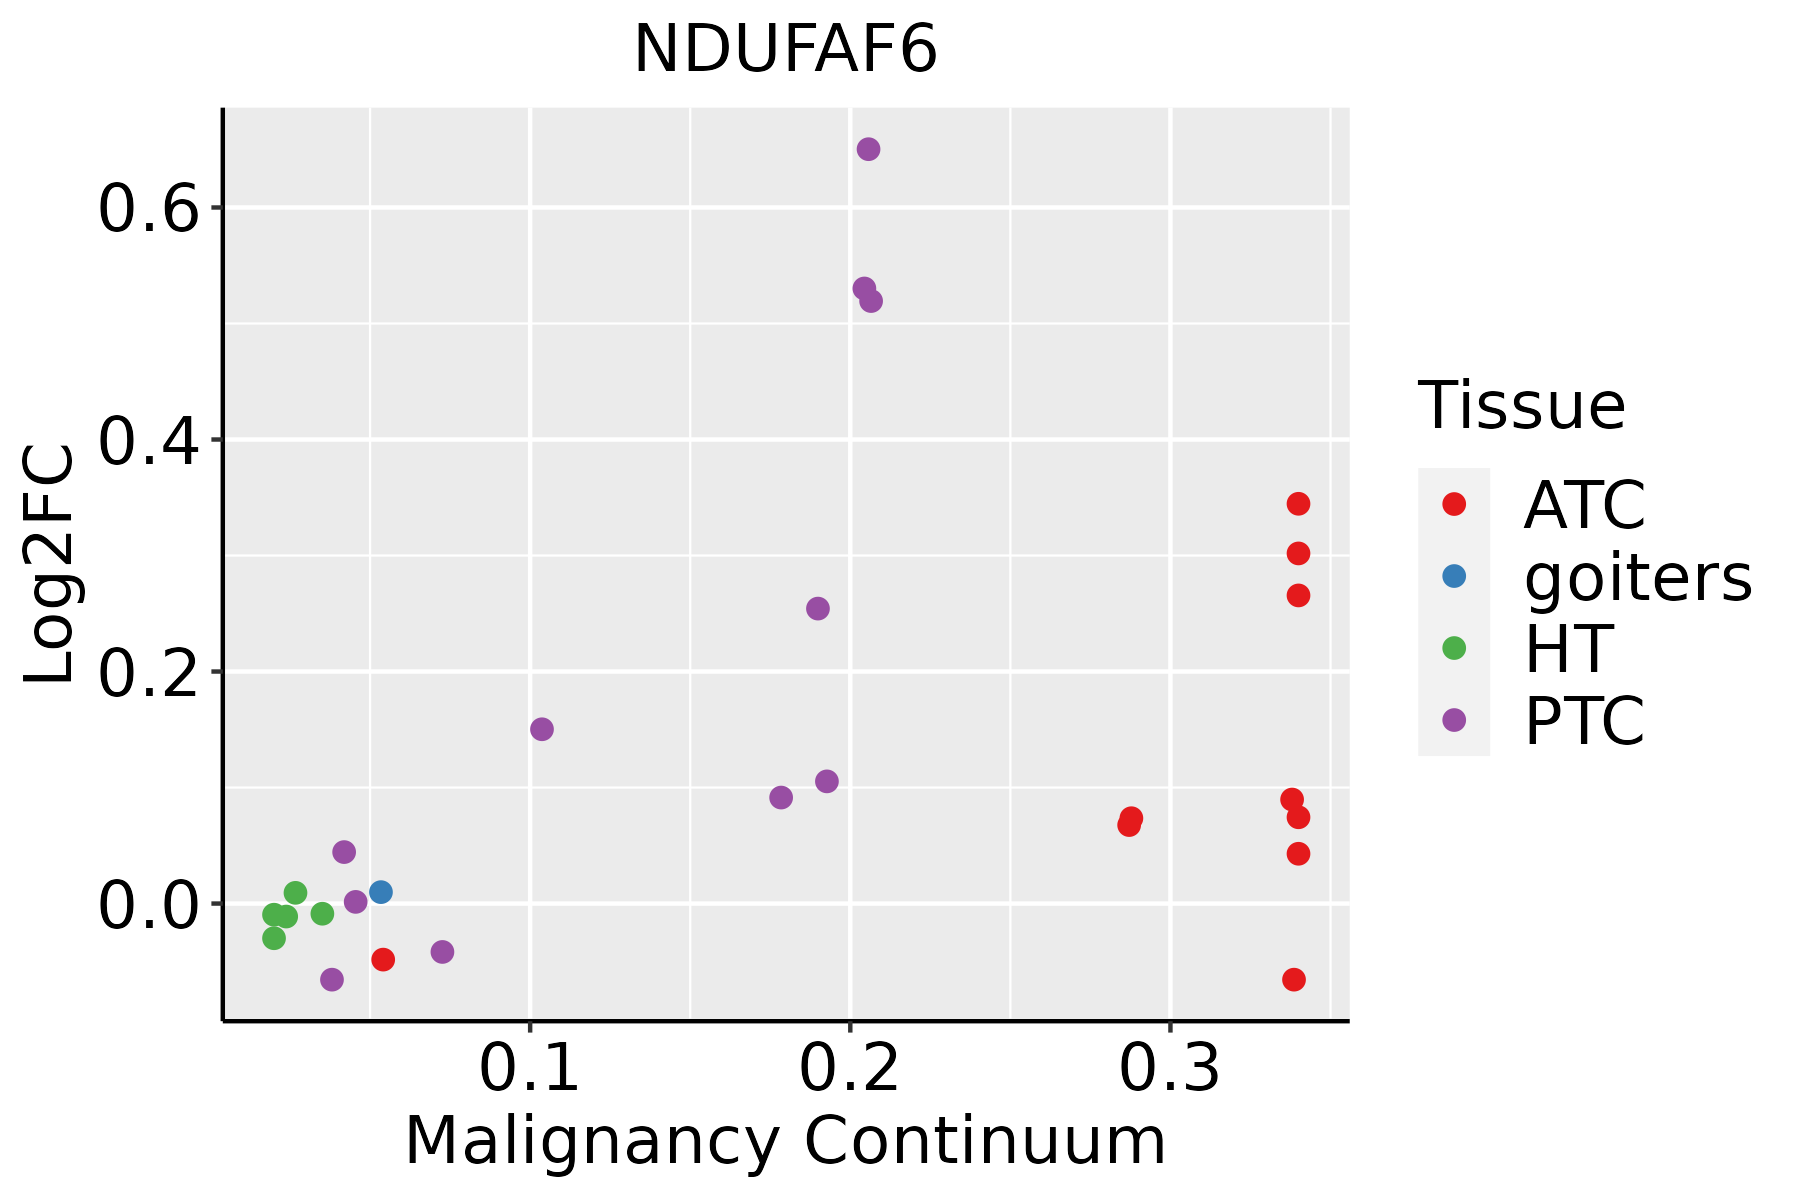 | ATC: Anaplastic thyroid cancer |
| HT: Hashimoto's thyroiditis | ||
| PTC: Papillary thyroid cancer |
| ∗log2FC in expression of this searched gene in stem-like cells from each diseased tissue sample relative to stem-like cells in normal samples in each tissue plotted against the malignancy continuum. Samples are colored based on if they are from different disease stage. |
Top |
Malignant transformation related pathway analysis |
| Find out the enriched GO biological processes and KEGG pathways involved in transition from healthy to precancer to cancer |
| Tissue | Disease Stage | Enriched GO biological Processes |
| Colorectum | AD |  |
| Colorectum | SER |  |
| Colorectum | MSS |  |
| Colorectum | MSI-H |  |
| Colorectum | FAP |  |
| ∗Top 15 enriched GO BP terms are showed in the bar plot of each disease state in each tissue. Each row represents a significant GO biological process which is colored according to the -log10(p.adjust). |
| Page: 1 2 3 4 5 6 7 8 9 |
| GO ID | Tissue | Disease Stage | Description | Gene Ratio | Bg Ratio | pvalue | p.adjust | Count |
| GO:001025713 | Breast | IDC | NADH dehydrogenase complex assembly | 22/1434 | 57/18723 | 6.20e-11 | 8.80e-09 | 22 |
| GO:003298113 | Breast | IDC | mitochondrial respiratory chain complex I assembly | 22/1434 | 57/18723 | 6.20e-11 | 8.80e-09 | 22 |
| GO:003310813 | Breast | IDC | mitochondrial respiratory chain complex assembly | 28/1434 | 93/18723 | 1.54e-10 | 1.83e-08 | 28 |
| GO:001025723 | Breast | DCIS | NADH dehydrogenase complex assembly | 22/1390 | 57/18723 | 3.38e-11 | 5.17e-09 | 22 |
| GO:003298123 | Breast | DCIS | mitochondrial respiratory chain complex I assembly | 22/1390 | 57/18723 | 3.38e-11 | 5.17e-09 | 22 |
| GO:003310823 | Breast | DCIS | mitochondrial respiratory chain complex assembly | 28/1390 | 93/18723 | 7.50e-11 | 9.43e-09 | 28 |
| GO:00102579 | Cervix | CC | NADH dehydrogenase complex assembly | 22/2311 | 57/18723 | 4.28e-07 | 1.67e-05 | 22 |
| GO:00329819 | Cervix | CC | mitochondrial respiratory chain complex I assembly | 22/2311 | 57/18723 | 4.28e-07 | 1.67e-05 | 22 |
| GO:00331089 | Cervix | CC | mitochondrial respiratory chain complex assembly | 26/2311 | 93/18723 | 3.97e-05 | 6.18e-04 | 26 |
| GO:0033108110 | Esophagus | ESCC | mitochondrial respiratory chain complex assembly | 83/8552 | 93/18723 | 9.56e-19 | 1.05e-16 | 83 |
| GO:0010257110 | Esophagus | ESCC | NADH dehydrogenase complex assembly | 50/8552 | 57/18723 | 3.78e-11 | 1.24e-09 | 50 |
| GO:0032981110 | Esophagus | ESCC | mitochondrial respiratory chain complex I assembly | 50/8552 | 57/18723 | 3.78e-11 | 1.24e-09 | 50 |
| GO:00331087 | Liver | Cirrhotic | mitochondrial respiratory chain complex assembly | 64/4634 | 93/18723 | 3.85e-19 | 7.79e-17 | 64 |
| GO:00102577 | Liver | Cirrhotic | NADH dehydrogenase complex assembly | 42/4634 | 57/18723 | 1.06e-14 | 1.06e-12 | 42 |
| GO:00329817 | Liver | Cirrhotic | mitochondrial respiratory chain complex I assembly | 42/4634 | 57/18723 | 1.06e-14 | 1.06e-12 | 42 |
| GO:003310812 | Liver | HCC | mitochondrial respiratory chain complex assembly | 80/7958 | 93/18723 | 3.47e-18 | 4.15e-16 | 80 |
| GO:001025712 | Liver | HCC | NADH dehydrogenase complex assembly | 50/7958 | 57/18723 | 1.50e-12 | 7.20e-11 | 50 |
| GO:003298112 | Liver | HCC | mitochondrial respiratory chain complex I assembly | 50/7958 | 57/18723 | 1.50e-12 | 7.20e-11 | 50 |
| GO:003310818 | Oral cavity | OSCC | mitochondrial respiratory chain complex assembly | 75/7305 | 93/18723 | 2.17e-16 | 1.68e-14 | 75 |
| GO:001025718 | Oral cavity | OSCC | NADH dehydrogenase complex assembly | 45/7305 | 57/18723 | 8.53e-10 | 2.13e-08 | 45 |
| Page: 1 2 |
| Pathway ID | Tissue | Disease Stage | Description | Gene Ratio | Bg Ratio | pvalue | p.adjust | qvalue | Count |
| hsa0471424 | Breast | IDC | Thermogenesis | 75/867 | 232/8465 | 8.41e-21 | 3.04e-19 | 2.27e-19 | 75 |
| hsa0471434 | Breast | IDC | Thermogenesis | 75/867 | 232/8465 | 8.41e-21 | 3.04e-19 | 2.27e-19 | 75 |
| hsa0471420 | Cervix | CC | Thermogenesis | 76/1267 | 232/8465 | 4.29e-12 | 1.16e-10 | 6.85e-11 | 76 |
| hsa04714110 | Cervix | CC | Thermogenesis | 76/1267 | 232/8465 | 4.29e-12 | 1.16e-10 | 6.85e-11 | 76 |
| hsa04714211 | Esophagus | ESCC | Thermogenesis | 163/4205 | 232/8465 | 9.22e-11 | 1.14e-09 | 5.86e-10 | 163 |
| hsa04714310 | Esophagus | ESCC | Thermogenesis | 163/4205 | 232/8465 | 9.22e-11 | 1.14e-09 | 5.86e-10 | 163 |
| hsa0471414 | Liver | Cirrhotic | Thermogenesis | 121/2530 | 232/8465 | 5.70e-13 | 1.36e-11 | 8.36e-12 | 121 |
| hsa0471415 | Liver | Cirrhotic | Thermogenesis | 121/2530 | 232/8465 | 5.70e-13 | 1.36e-11 | 8.36e-12 | 121 |
| hsa0471422 | Liver | HCC | Thermogenesis | 170/4020 | 232/8465 | 5.36e-16 | 2.25e-14 | 1.25e-14 | 170 |
| hsa0471432 | Liver | HCC | Thermogenesis | 170/4020 | 232/8465 | 5.36e-16 | 2.25e-14 | 1.25e-14 | 170 |
| hsa0471430 | Oral cavity | OSCC | Thermogenesis | 138/3704 | 232/8465 | 7.67e-07 | 4.35e-06 | 2.22e-06 | 138 |
| hsa04714113 | Oral cavity | OSCC | Thermogenesis | 138/3704 | 232/8465 | 7.67e-07 | 4.35e-06 | 2.22e-06 | 138 |
| hsa04714210 | Oral cavity | LP | Thermogenesis | 105/2418 | 232/8465 | 3.14e-08 | 4.98e-07 | 3.21e-07 | 105 |
| hsa0471438 | Oral cavity | LP | Thermogenesis | 105/2418 | 232/8465 | 3.14e-08 | 4.98e-07 | 3.21e-07 | 105 |
| Page: 1 |
Top |
Cell-cell communication analysis |
| Identification of potential cell-cell interactions between two cell types and their ligand-receptor pairs for different disease states |
| Ligand | Receptor | LRpair | Pathway | Tissue | Disease Stage |
| Page: 1 |
Top |
Single-cell gene regulatory network inference analysis |
| Find out the significant the regulons (TFs) and the target genes of each regulon across cell types for different disease states |
| TF | Cell Type | Tissue | Disease Stage | Target Gene | RSS | Regulon Activity |
| ∗The dot plots of a searched regulon are shown for all cell subpopulations in each disease state of each tissue based on the regulon specific score inferred using pySCENIC and by calculating the average expression. |
| Page: 1 |
Top |
Somatic mutation of malignant transformation related genes |
| Annotation of somatic variants for genes involved in malignant transformation |
| Hugo Symbol | Variant Class | Variant Classification | dbSNP RS | HGVSc | HGVSp | HGVSp Short | SWISSPROT | BIOTYPE | SIFT | PolyPhen | Tumor Sample Barcode | Tissue | Histology | Sex | Age | Stage | Therapy Types | Drugs | Outcome |
| NDUFAF6 | SNV | Missense_Mutation | c.644N>T | p.Thr215Ile | p.T215I | Q330K2 | protein_coding | deleterious(0) | possibly_damaging(0.566) | TCGA-D8-A1X9-01 | Breast | breast invasive carcinoma | Female | >=65 | I/II | Chemotherapy | adriamycin+cyclophosphamide | SD | |
| NDUFAF6 | SNV | Missense_Mutation | c.646N>G | p.Cys216Gly | p.C216G | Q330K2 | protein_coding | deleterious(0.01) | benign(0.112) | TCGA-D8-A1X9-01 | Breast | breast invasive carcinoma | Female | >=65 | I/II | Chemotherapy | adriamycin+cyclophosphamide | SD | |
| NDUFAF6 | SNV | Missense_Mutation | novel | c.932N>T | p.Pro311Leu | p.P311L | Q330K2 | protein_coding | deleterious(0.01) | possibly_damaging(0.619) | TCGA-EA-A3HS-01 | Cervix | cervical & endocervical cancer | Female | <65 | I/II | Unknown | Unknown | SD |
| NDUFAF6 | SNV | Missense_Mutation | novel | c.472N>A | p.Glu158Lys | p.E158K | Q330K2 | protein_coding | tolerated(0.15) | benign(0.149) | TCGA-VS-A953-01 | Cervix | cervical & endocervical cancer | Female | <65 | I/II | Unknown | Unknown | PD |
| NDUFAF6 | SNV | Missense_Mutation | novel | c.338N>A | p.Arg113Gln | p.R113Q | Q330K2 | protein_coding | deleterious(0) | possibly_damaging(0.903) | TCGA-AA-3984-01 | Colorectum | colon adenocarcinoma | Female | <65 | I/II | Unknown | Unknown | SD |
| NDUFAF6 | SNV | Missense_Mutation | c.937N>A | p.Leu313Ile | p.L313I | Q330K2 | protein_coding | deleterious(0.02) | possibly_damaging(0.781) | TCGA-CK-4951-01 | Colorectum | colon adenocarcinoma | Female | >=65 | I/II | Unknown | Unknown | PD | |
| NDUFAF6 | SNV | Missense_Mutation | novel | c.860C>T | p.Ala287Val | p.A287V | Q330K2 | protein_coding | tolerated(0.35) | benign(0.241) | TCGA-EI-6917-01 | Colorectum | rectum adenocarcinoma | Male | <65 | III/IV | Chemotherapy | 5fluorouracil+oxaciplatina+l-folinian | SD |
| NDUFAF6 | SNV | Missense_Mutation | novel | c.556N>A | p.Leu186Ile | p.L186I | Q330K2 | protein_coding | tolerated(0.11) | benign(0.445) | TCGA-F5-6814-01 | Colorectum | rectum adenocarcinoma | Male | <65 | I/II | Unknown | Unknown | SD |
| NDUFAF6 | SNV | Missense_Mutation | novel | c.705T>G | p.Ile235Met | p.I235M | Q330K2 | protein_coding | deleterious(0) | possibly_damaging(0.863) | TCGA-AJ-A5DW-01 | Endometrium | uterine corpus endometrioid carcinoma | Female | <65 | I/II | Unknown | Unknown | SD |
| NDUFAF6 | SNV | Missense_Mutation | c.970N>G | p.Leu324Val | p.L324V | Q330K2 | protein_coding | deleterious(0.01) | benign(0.033) | TCGA-AP-A056-01 | Endometrium | uterine corpus endometrioid carcinoma | Female | <65 | I/II | Unknown | Unknown | SD |
| Page: 1 2 3 4 |
Top |
Related drugs of malignant transformation related genes |
| Identification of chemicals and drugs interact with genes involved in malignant transfromation |
| (DGIdb 4.0) |
| Entrez ID | Symbol | Category | Interaction Types | Drug Claim Name | Drug Name | PMIDs |
| Page: 1 |

Copyright 2023-Present -The University of Texas Health Science Center at Houston |