
|
|||||
|
 | |
| |
| |
| |
| |
| |
|
Gene: NDUFAF5 |
Gene summary for NDUFAF5 |
| Gene information | Species | Human | Gene symbol | NDUFAF5 | Gene ID | 79133 |
| Gene name | NADH:ubiquinone oxidoreductase complex assembly factor 5 | |
| Gene Alias | C20orf7 | |
| Cytomap | 20p12.1 | |
| Gene Type | protein-coding | GO ID | GO:0006464 | UniProtAcc | Q5TEU4 |
Top |
Malignant transformation analysis |
| Identification of the aberrant gene expression in precancerous and cancerous lesions by comparing the gene expression of stem-like cells in diseased tissues with normal stem cells |
| Entrez ID | Symbol | Replicates | Species | Organ | Tissue | Adj P-value | Log2FC | Malignancy |
| 79133 | NDUFAF5 | LZE7T | Human | Esophagus | ESCC | 5.28e-05 | 2.39e-01 | 0.0667 |
| 79133 | NDUFAF5 | LZE24T | Human | Esophagus | ESCC | 1.71e-02 | 1.30e-01 | 0.0596 |
| 79133 | NDUFAF5 | LZE6T | Human | Esophagus | ESCC | 1.66e-02 | 1.93e-01 | 0.0845 |
| 79133 | NDUFAF5 | P1T-E | Human | Esophagus | ESCC | 2.71e-03 | 2.32e-01 | 0.0875 |
| 79133 | NDUFAF5 | P2T-E | Human | Esophagus | ESCC | 9.05e-14 | 2.26e-01 | 0.1177 |
| 79133 | NDUFAF5 | P4T-E | Human | Esophagus | ESCC | 1.51e-10 | 2.65e-01 | 0.1323 |
| 79133 | NDUFAF5 | P5T-E | Human | Esophagus | ESCC | 1.91e-06 | 2.04e-01 | 0.1327 |
| 79133 | NDUFAF5 | P8T-E | Human | Esophagus | ESCC | 8.21e-10 | 1.56e-01 | 0.0889 |
| 79133 | NDUFAF5 | P9T-E | Human | Esophagus | ESCC | 7.96e-09 | 2.07e-01 | 0.1131 |
| 79133 | NDUFAF5 | P10T-E | Human | Esophagus | ESCC | 8.69e-16 | 2.59e-01 | 0.116 |
| 79133 | NDUFAF5 | P11T-E | Human | Esophagus | ESCC | 6.14e-10 | 3.75e-01 | 0.1426 |
| 79133 | NDUFAF5 | P12T-E | Human | Esophagus | ESCC | 9.82e-22 | 3.66e-01 | 0.1122 |
| 79133 | NDUFAF5 | P15T-E | Human | Esophagus | ESCC | 3.97e-09 | 2.47e-01 | 0.1149 |
| 79133 | NDUFAF5 | P16T-E | Human | Esophagus | ESCC | 3.89e-16 | 2.33e-01 | 0.1153 |
| 79133 | NDUFAF5 | P17T-E | Human | Esophagus | ESCC | 4.37e-06 | 2.42e-01 | 0.1278 |
| 79133 | NDUFAF5 | P20T-E | Human | Esophagus | ESCC | 3.98e-13 | 3.09e-01 | 0.1124 |
| 79133 | NDUFAF5 | P21T-E | Human | Esophagus | ESCC | 4.58e-21 | 3.88e-01 | 0.1617 |
| 79133 | NDUFAF5 | P22T-E | Human | Esophagus | ESCC | 4.19e-11 | 1.95e-01 | 0.1236 |
| 79133 | NDUFAF5 | P23T-E | Human | Esophagus | ESCC | 1.22e-16 | 3.73e-01 | 0.108 |
| 79133 | NDUFAF5 | P24T-E | Human | Esophagus | ESCC | 1.34e-09 | 1.93e-01 | 0.1287 |
| Page: 1 2 3 4 |
| Tissue | Expression Dynamics | Abbreviation |
| Esophagus | 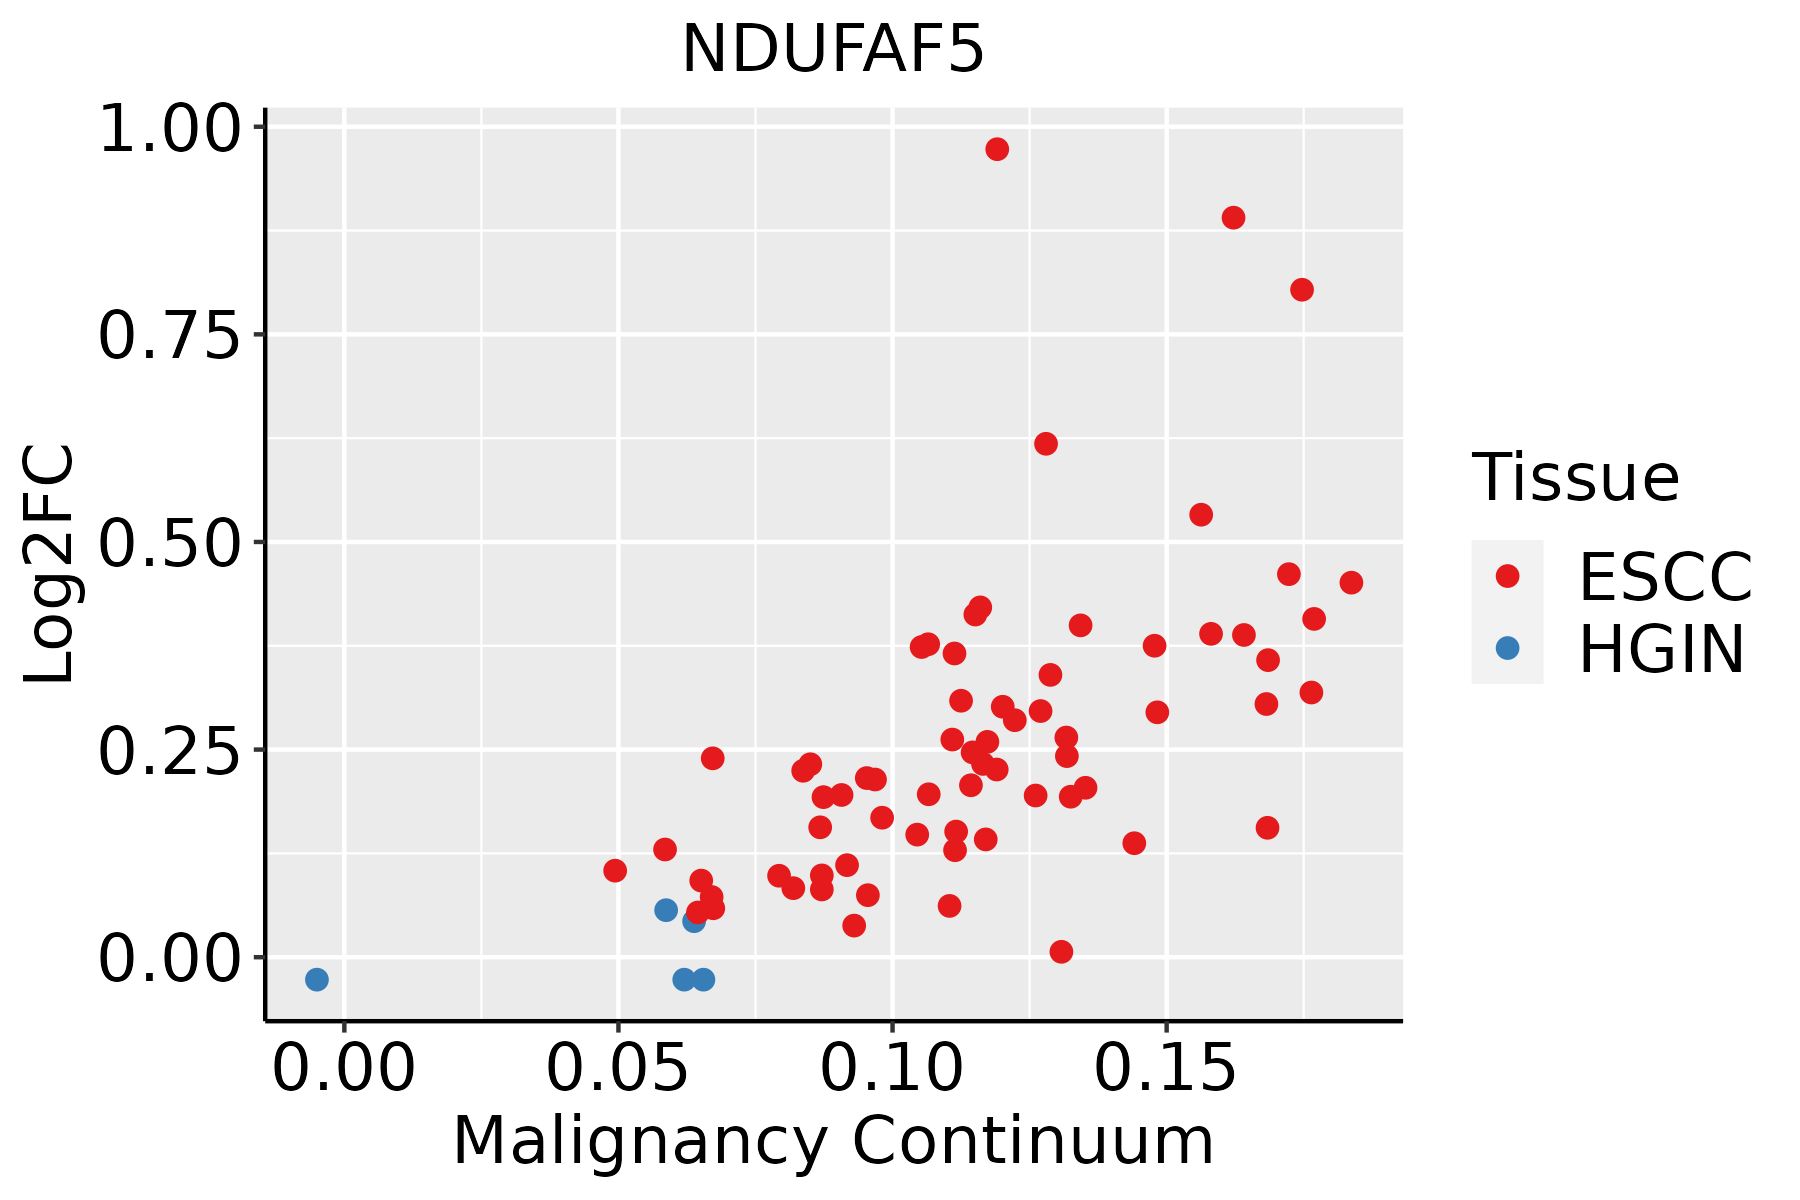 | ESCC: Esophageal squamous cell carcinoma |
| HGIN: High-grade intraepithelial neoplasias | ||
| LGIN: Low-grade intraepithelial neoplasias | ||
| Oral Cavity |  | EOLP: Erosive Oral lichen planus |
| LP: leukoplakia | ||
| NEOLP: Non-erosive oral lichen planus | ||
| OSCC: Oral squamous cell carcinoma |
| ∗log2FC in expression of this searched gene in stem-like cells from each diseased tissue sample relative to stem-like cells in normal samples in each tissue plotted against the malignancy continuum. Samples are colored based on if they are from different disease stage. |
Top |
Malignant transformation related pathway analysis |
| Find out the enriched GO biological processes and KEGG pathways involved in transition from healthy to precancer to cancer |
| Tissue | Disease Stage | Enriched GO biological Processes |
| Colorectum | AD |  |
| Colorectum | SER |  |
| Colorectum | MSS |  |
| Colorectum | MSI-H |  |
| Colorectum | FAP |  |
| ∗Top 15 enriched GO BP terms are showed in the bar plot of each disease state in each tissue. Each row represents a significant GO biological process which is colored according to the -log10(p.adjust). |
| Page: 1 2 3 4 5 6 7 8 9 |
| GO ID | Tissue | Disease Stage | Description | Gene Ratio | Bg Ratio | pvalue | p.adjust | Count |
| GO:0033108110 | Esophagus | ESCC | mitochondrial respiratory chain complex assembly | 83/8552 | 93/18723 | 9.56e-19 | 1.05e-16 | 83 |
| GO:0010257110 | Esophagus | ESCC | NADH dehydrogenase complex assembly | 50/8552 | 57/18723 | 3.78e-11 | 1.24e-09 | 50 |
| GO:0032981110 | Esophagus | ESCC | mitochondrial respiratory chain complex I assembly | 50/8552 | 57/18723 | 3.78e-11 | 1.24e-09 | 50 |
| GO:00322592 | Esophagus | ESCC | methylation | 222/8552 | 364/18723 | 2.26e-09 | 5.09e-08 | 222 |
| GO:003310818 | Oral cavity | OSCC | mitochondrial respiratory chain complex assembly | 75/7305 | 93/18723 | 2.17e-16 | 1.68e-14 | 75 |
| GO:001025718 | Oral cavity | OSCC | NADH dehydrogenase complex assembly | 45/7305 | 57/18723 | 8.53e-10 | 2.13e-08 | 45 |
| GO:003298118 | Oral cavity | OSCC | mitochondrial respiratory chain complex I assembly | 45/7305 | 57/18723 | 8.53e-10 | 2.13e-08 | 45 |
| GO:00322591 | Oral cavity | OSCC | methylation | 168/7305 | 364/18723 | 3.03e-03 | 1.31e-02 | 168 |
| Page: 1 |
| Pathway ID | Tissue | Disease Stage | Description | Gene Ratio | Bg Ratio | pvalue | p.adjust | qvalue | Count |
| hsa04714211 | Esophagus | ESCC | Thermogenesis | 163/4205 | 232/8465 | 9.22e-11 | 1.14e-09 | 5.86e-10 | 163 |
| hsa04714310 | Esophagus | ESCC | Thermogenesis | 163/4205 | 232/8465 | 9.22e-11 | 1.14e-09 | 5.86e-10 | 163 |
| hsa0471430 | Oral cavity | OSCC | Thermogenesis | 138/3704 | 232/8465 | 7.67e-07 | 4.35e-06 | 2.22e-06 | 138 |
| hsa04714113 | Oral cavity | OSCC | Thermogenesis | 138/3704 | 232/8465 | 7.67e-07 | 4.35e-06 | 2.22e-06 | 138 |
| Page: 1 |
Top |
Cell-cell communication analysis |
| Identification of potential cell-cell interactions between two cell types and their ligand-receptor pairs for different disease states |
| Ligand | Receptor | LRpair | Pathway | Tissue | Disease Stage |
| Page: 1 |
Top |
Single-cell gene regulatory network inference analysis |
| Find out the significant the regulons (TFs) and the target genes of each regulon across cell types for different disease states |
| TF | Cell Type | Tissue | Disease Stage | Target Gene | RSS | Regulon Activity |
| ∗The dot plots of a searched regulon are shown for all cell subpopulations in each disease state of each tissue based on the regulon specific score inferred using pySCENIC and by calculating the average expression. |
| Page: 1 |
Top |
Somatic mutation of malignant transformation related genes |
| Annotation of somatic variants for genes involved in malignant transformation |
| Hugo Symbol | Variant Class | Variant Classification | dbSNP RS | HGVSc | HGVSp | HGVSp Short | SWISSPROT | BIOTYPE | SIFT | PolyPhen | Tumor Sample Barcode | Tissue | Histology | Sex | Age | Stage | Therapy Types | Drugs | Outcome |
| NDUFAF5 | SNV | Missense_Mutation | c.268N>G | p.Phe90Val | p.F90V | Q5TEU4 | protein_coding | deleterious(0) | probably_damaging(0.978) | TCGA-A8-A06Y-01 | Breast | breast invasive carcinoma | Female | >=65 | I/II | Hormone Therapy | anastrozole | PD | |
| NDUFAF5 | SNV | Missense_Mutation | c.375G>C | p.Leu125Phe | p.L125F | Q5TEU4 | protein_coding | deleterious(0.01) | benign(0.333) | TCGA-A8-A08P-01 | Breast | breast invasive carcinoma | Female | >=65 | III/IV | Chemotherapy | 5-fluorouracil | CR | |
| NDUFAF5 | SNV | Missense_Mutation | c.918N>A | p.Met306Ile | p.M306I | Q5TEU4 | protein_coding | deleterious(0.01) | benign(0.342) | TCGA-A8-A095-01 | Breast | breast invasive carcinoma | Female | <65 | I/II | Chemotherapy | 5-fluorouracil | CR | |
| NDUFAF5 | insertion | In_Frame_Ins | novel | c.882_883insACCTGGCTTTTGCCCAGCGGGCTTACTTTAGACCATTGCTGGCAA | p.Asp294_Gly295insThrTrpLeuLeuProSerGlyLeuThrLeuAspHisCysTrpGln | p.D294_G295insTWLLPSGLTLDHCWQ | Q5TEU4 | protein_coding | TCGA-B6-A0IA-01 | Breast | breast invasive carcinoma | Female | <65 | I/II | Unknown | Unknown | SD | ||
| NDUFAF5 | SNV | Missense_Mutation | novel | c.146N>A | p.Arg49Gln | p.R49Q | Q5TEU4 | protein_coding | deleterious(0) | probably_damaging(0.981) | TCGA-2W-A8YY-01 | Cervix | cervical & endocervical cancer | Female | <65 | I/II | Chemotherapy | cisplatin | CR |
| NDUFAF5 | SNV | Missense_Mutation | c.841G>A | p.Ala281Thr | p.A281T | Q5TEU4 | protein_coding | deleterious(0) | probably_damaging(0.984) | TCGA-A6-6653-01 | Colorectum | colon adenocarcinoma | Male | >=65 | I/II | Unknown | Unknown | SD | |
| NDUFAF5 | SNV | Missense_Mutation | rs142611230 | c.970N>A | p.Ala324Thr | p.A324T | Q5TEU4 | protein_coding | deleterious(0.03) | possibly_damaging(0.581) | TCGA-AA-3672-01 | Colorectum | colon adenocarcinoma | Female | >=65 | III/IV | Unknown | Unknown | SD |
| NDUFAF5 | SNV | Missense_Mutation | novel | c.172T>C | p.Trp58Arg | p.W58R | Q5TEU4 | protein_coding | tolerated(1) | benign(0.006) | TCGA-AA-3947-01 | Colorectum | colon adenocarcinoma | Female | <65 | I/II | Unknown | Unknown | SD |
| NDUFAF5 | SNV | Missense_Mutation | c.98N>A | p.Val33Asp | p.V33D | Q5TEU4 | protein_coding | tolerated(0.25) | benign(0.039) | TCGA-AD-6964-01 | Colorectum | colon adenocarcinoma | Male | <65 | III/IV | Chemotherapy | folfox | PD | |
| NDUFAF5 | SNV | Missense_Mutation | c.662N>T | p.Ala221Val | p.A221V | Q5TEU4 | protein_coding | tolerated(0.06) | possibly_damaging(0.76) | TCGA-CM-6674-01 | Colorectum | colon adenocarcinoma | Male | <65 | I/II | Unknown | Unknown | SD |
| Page: 1 2 3 4 |
Top |
Related drugs of malignant transformation related genes |
| Identification of chemicals and drugs interact with genes involved in malignant transfromation |
| (DGIdb 4.0) |
| Entrez ID | Symbol | Category | Interaction Types | Drug Claim Name | Drug Name | PMIDs |
| Page: 1 |

Copyright 2023-Present -The University of Texas Health Science Center at Houston |