
|
|||||
|
 | |
| |
| |
| |
| |
| |
|
Gene: NDUFAF3 |
Gene summary for NDUFAF3 |
| Gene information | Species | Human | Gene symbol | NDUFAF3 | Gene ID | 25915 |
| Gene name | NADH:ubiquinone oxidoreductase complex assembly factor 3 | |
| Gene Alias | 2P1 | |
| Cytomap | 3p21.31 | |
| Gene Type | protein-coding | GO ID | GO:0006996 | UniProtAcc | Q9BU61 |
Top |
Malignant transformation analysis |
| Identification of the aberrant gene expression in precancerous and cancerous lesions by comparing the gene expression of stem-like cells in diseased tissues with normal stem cells |
| Entrez ID | Symbol | Replicates | Species | Organ | Tissue | Adj P-value | Log2FC | Malignancy |
| 25915 | NDUFAF3 | GSM4909281 | Human | Breast | IDC | 4.43e-19 | 6.00e-01 | 0.21 |
| 25915 | NDUFAF3 | GSM4909291 | Human | Breast | IDC | 4.49e-03 | 4.44e-01 | 0.1753 |
| 25915 | NDUFAF3 | GSM4909296 | Human | Breast | IDC | 2.64e-05 | 3.64e-02 | 0.1524 |
| 25915 | NDUFAF3 | GSM4909297 | Human | Breast | IDC | 2.65e-10 | -2.61e-03 | 0.1517 |
| 25915 | NDUFAF3 | GSM4909301 | Human | Breast | IDC | 1.61e-15 | 4.98e-01 | 0.1577 |
| 25915 | NDUFAF3 | GSM4909304 | Human | Breast | IDC | 5.15e-04 | 3.45e-01 | 0.1636 |
| 25915 | NDUFAF3 | GSM4909307 | Human | Breast | IDC | 2.62e-02 | 2.91e-01 | 0.1569 |
| 25915 | NDUFAF3 | GSM4909308 | Human | Breast | IDC | 7.95e-08 | 4.36e-01 | 0.158 |
| 25915 | NDUFAF3 | GSM4909309 | Human | Breast | IDC | 4.03e-04 | 2.78e-01 | 0.0483 |
| 25915 | NDUFAF3 | GSM4909311 | Human | Breast | IDC | 1.84e-27 | -4.34e-02 | 0.1534 |
| 25915 | NDUFAF3 | GSM4909312 | Human | Breast | IDC | 2.62e-09 | -4.03e-02 | 0.1552 |
| 25915 | NDUFAF3 | GSM4909316 | Human | Breast | IDC | 2.60e-02 | 3.15e-02 | 0.21 |
| 25915 | NDUFAF3 | GSM4909319 | Human | Breast | IDC | 2.21e-32 | -7.87e-02 | 0.1563 |
| 25915 | NDUFAF3 | GSM4909320 | Human | Breast | IDC | 2.18e-10 | 4.15e-01 | 0.1575 |
| 25915 | NDUFAF3 | GSM4909321 | Human | Breast | IDC | 8.20e-22 | 4.00e-01 | 0.1559 |
| 25915 | NDUFAF3 | brca2 | Human | Breast | Precancer | 5.32e-08 | 3.57e-01 | -0.024 |
| 25915 | NDUFAF3 | NCCBC14 | Human | Breast | DCIS | 4.59e-07 | 5.10e-02 | 0.2021 |
| 25915 | NDUFAF3 | NCCBC5 | Human | Breast | DCIS | 2.04e-09 | -1.38e-04 | 0.2046 |
| 25915 | NDUFAF3 | P1 | Human | Breast | IDC | 8.60e-18 | -2.75e-01 | 0.1527 |
| 25915 | NDUFAF3 | DCIS2 | Human | Breast | DCIS | 1.01e-55 | 1.85e-01 | 0.0085 |
| Page: 1 2 3 4 5 6 7 8 9 10 11 |
| Tissue | Expression Dynamics | Abbreviation |
| Breast | 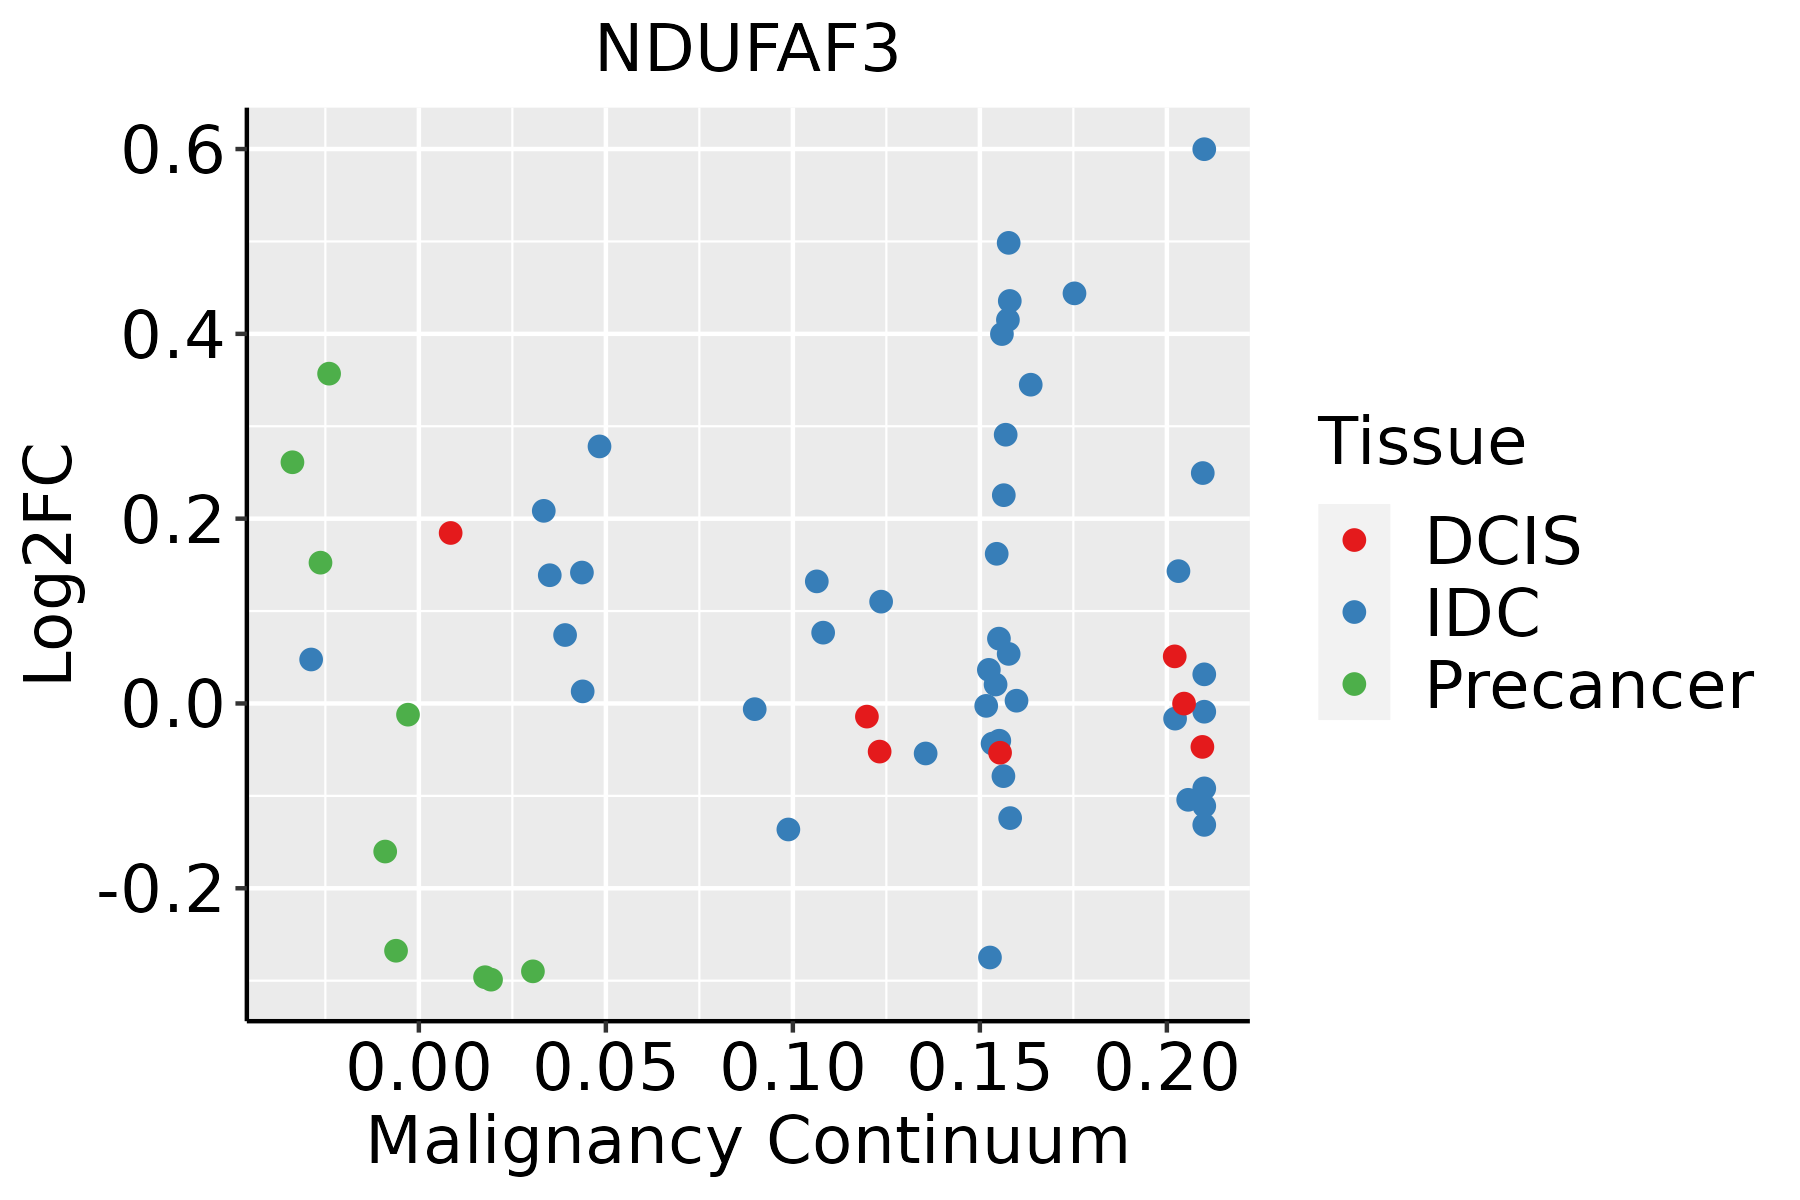 | IDC: Invasive ductal carcinoma |
| DCIS: Ductal carcinoma in situ | ||
| Precancer(BRCA1-mut): Precancerous lesion from BRCA1 mutation carriers | ||
| Colorectum (GSE201348) |  | FAP: Familial adenomatous polyposis |
| CRC: Colorectal cancer | ||
| Colorectum (HTA11) |  | AD: Adenomas |
| SER: Sessile serrated lesions | ||
| MSI-H: Microsatellite-high colorectal cancer | ||
| MSS: Microsatellite stable colorectal cancer | ||
| Endometrium | 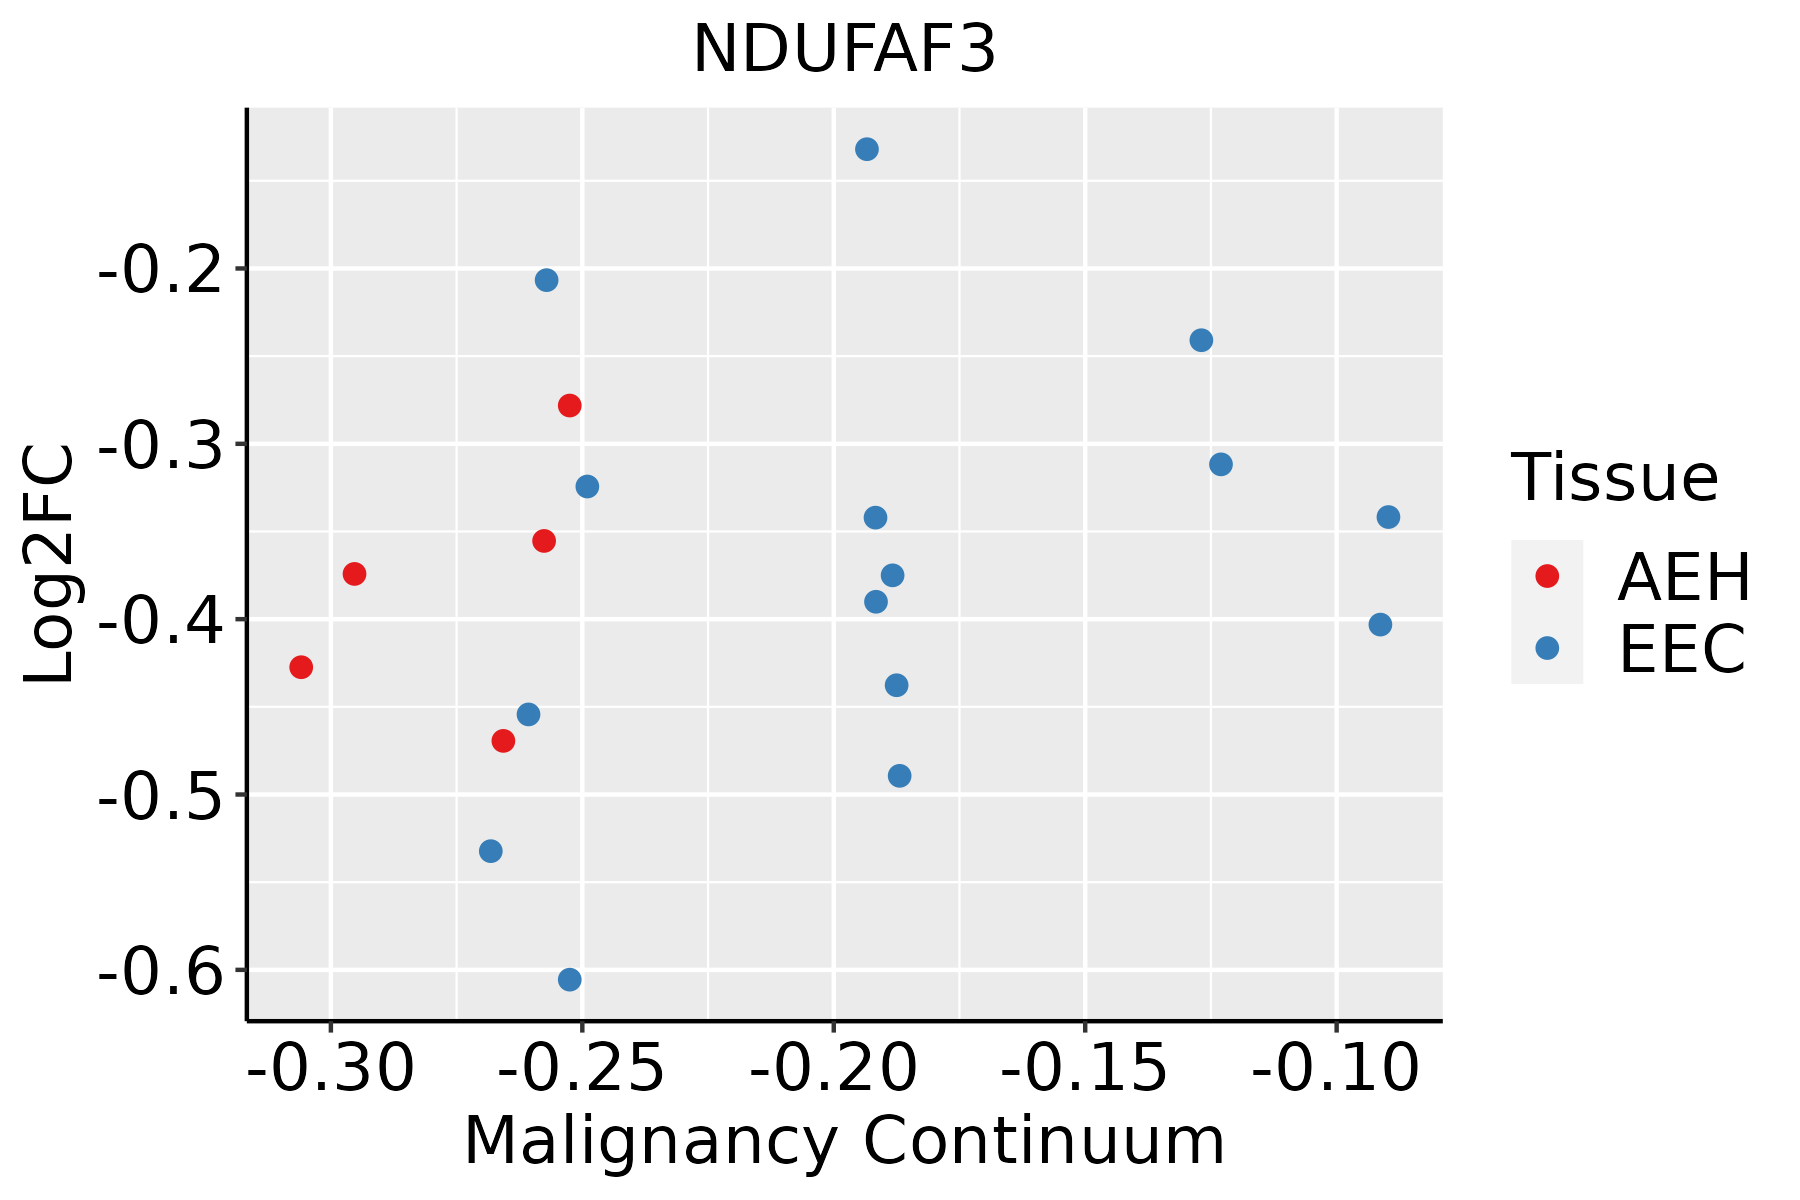 | AEH: Atypical endometrial hyperplasia |
| EEC: Endometrioid Cancer | ||
| Esophagus | 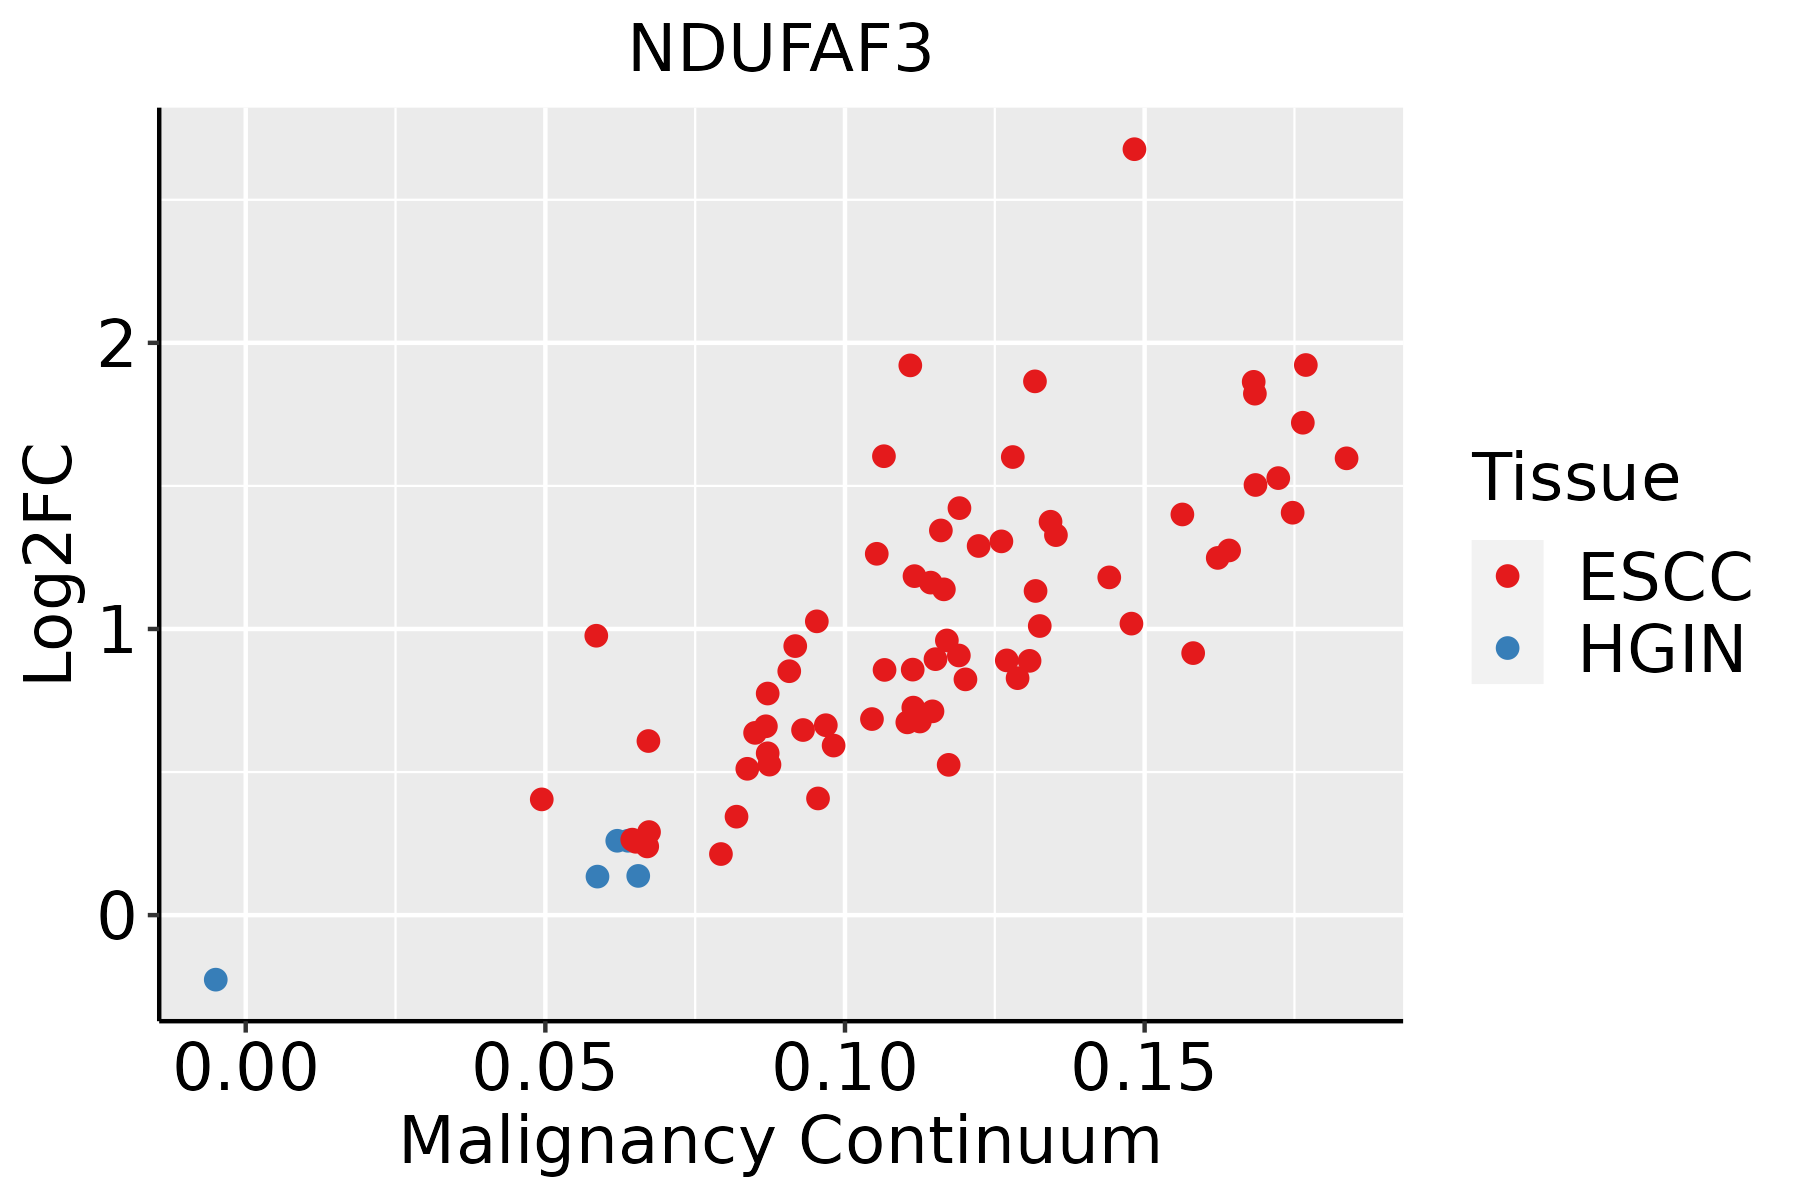 | ESCC: Esophageal squamous cell carcinoma |
| HGIN: High-grade intraepithelial neoplasias | ||
| LGIN: Low-grade intraepithelial neoplasias | ||
| Liver | 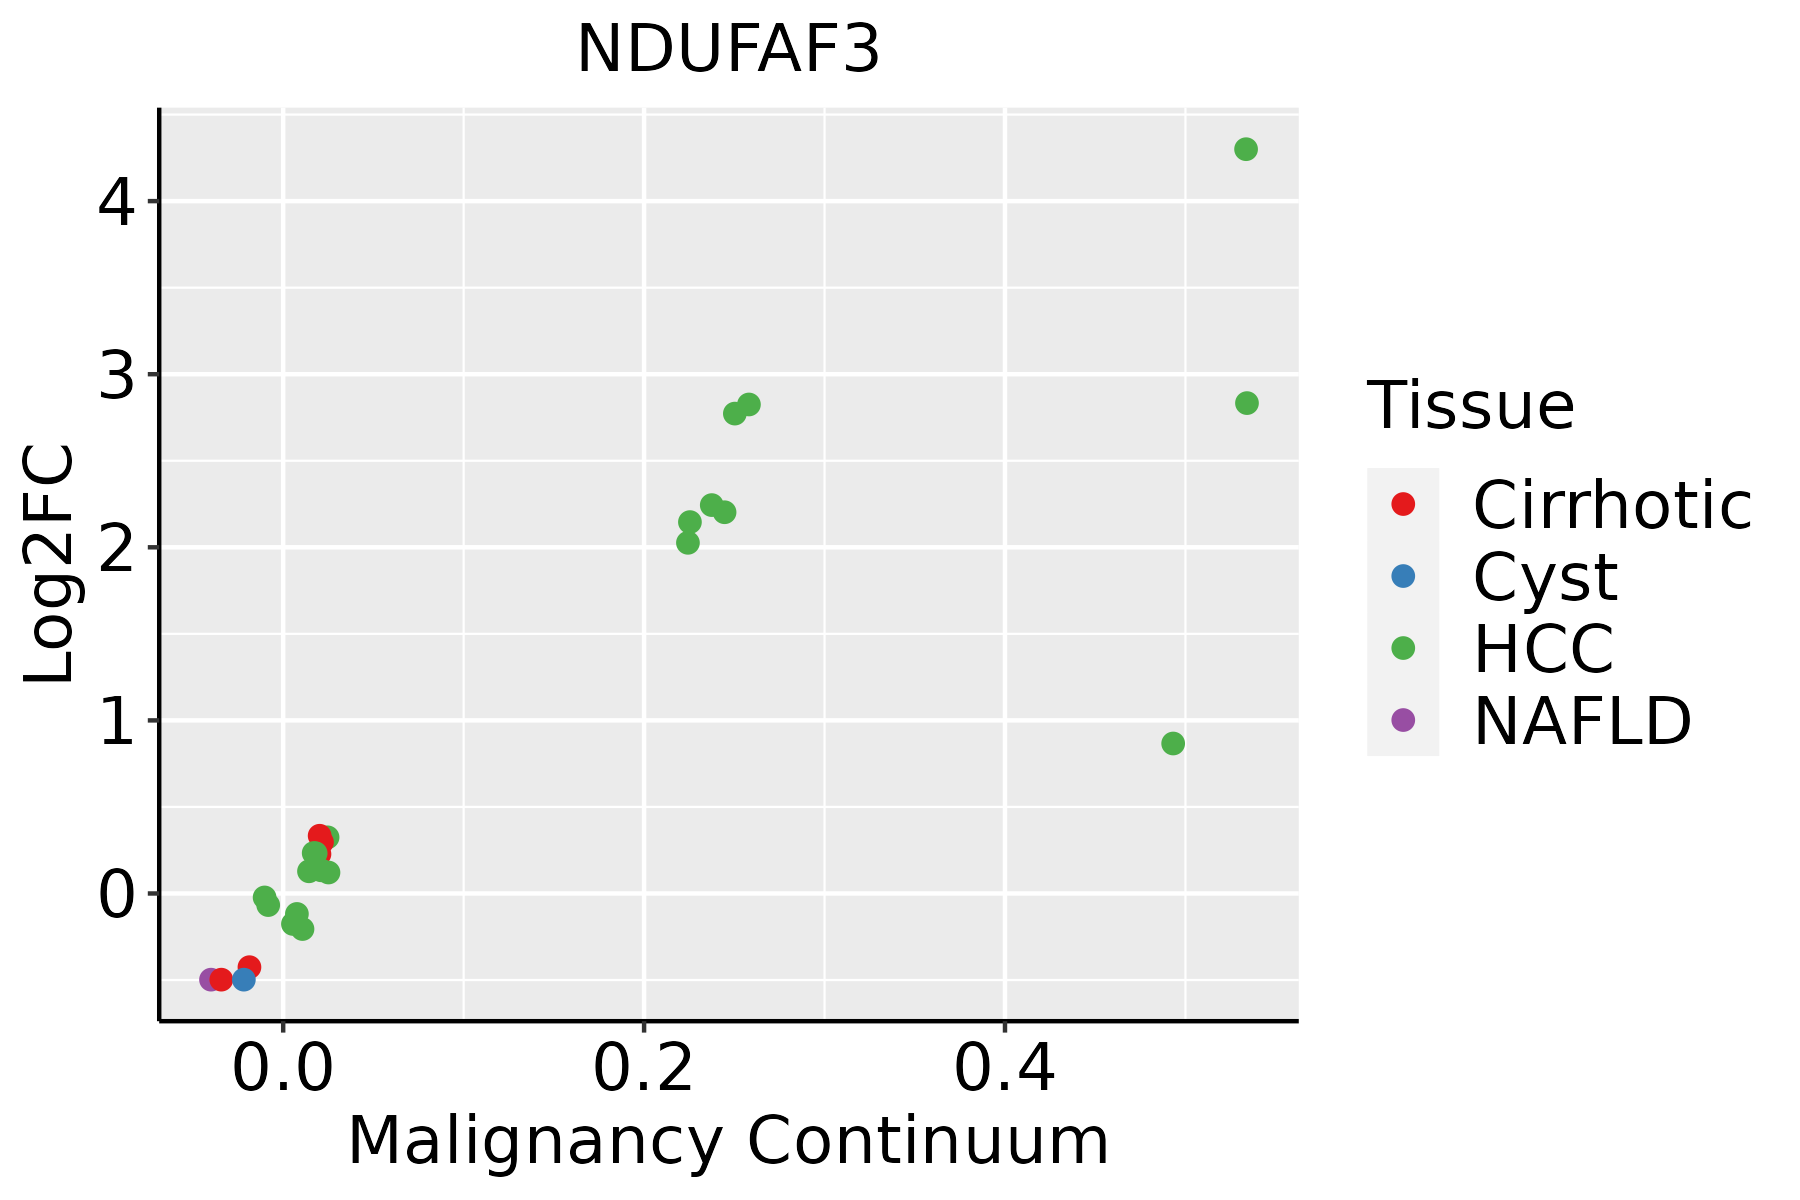 | HCC: Hepatocellular carcinoma |
| NAFLD: Non-alcoholic fatty liver disease | ||
| Oral Cavity |  | EOLP: Erosive Oral lichen planus |
| LP: leukoplakia | ||
| NEOLP: Non-erosive oral lichen planus | ||
| OSCC: Oral squamous cell carcinoma | ||
| Prostate | 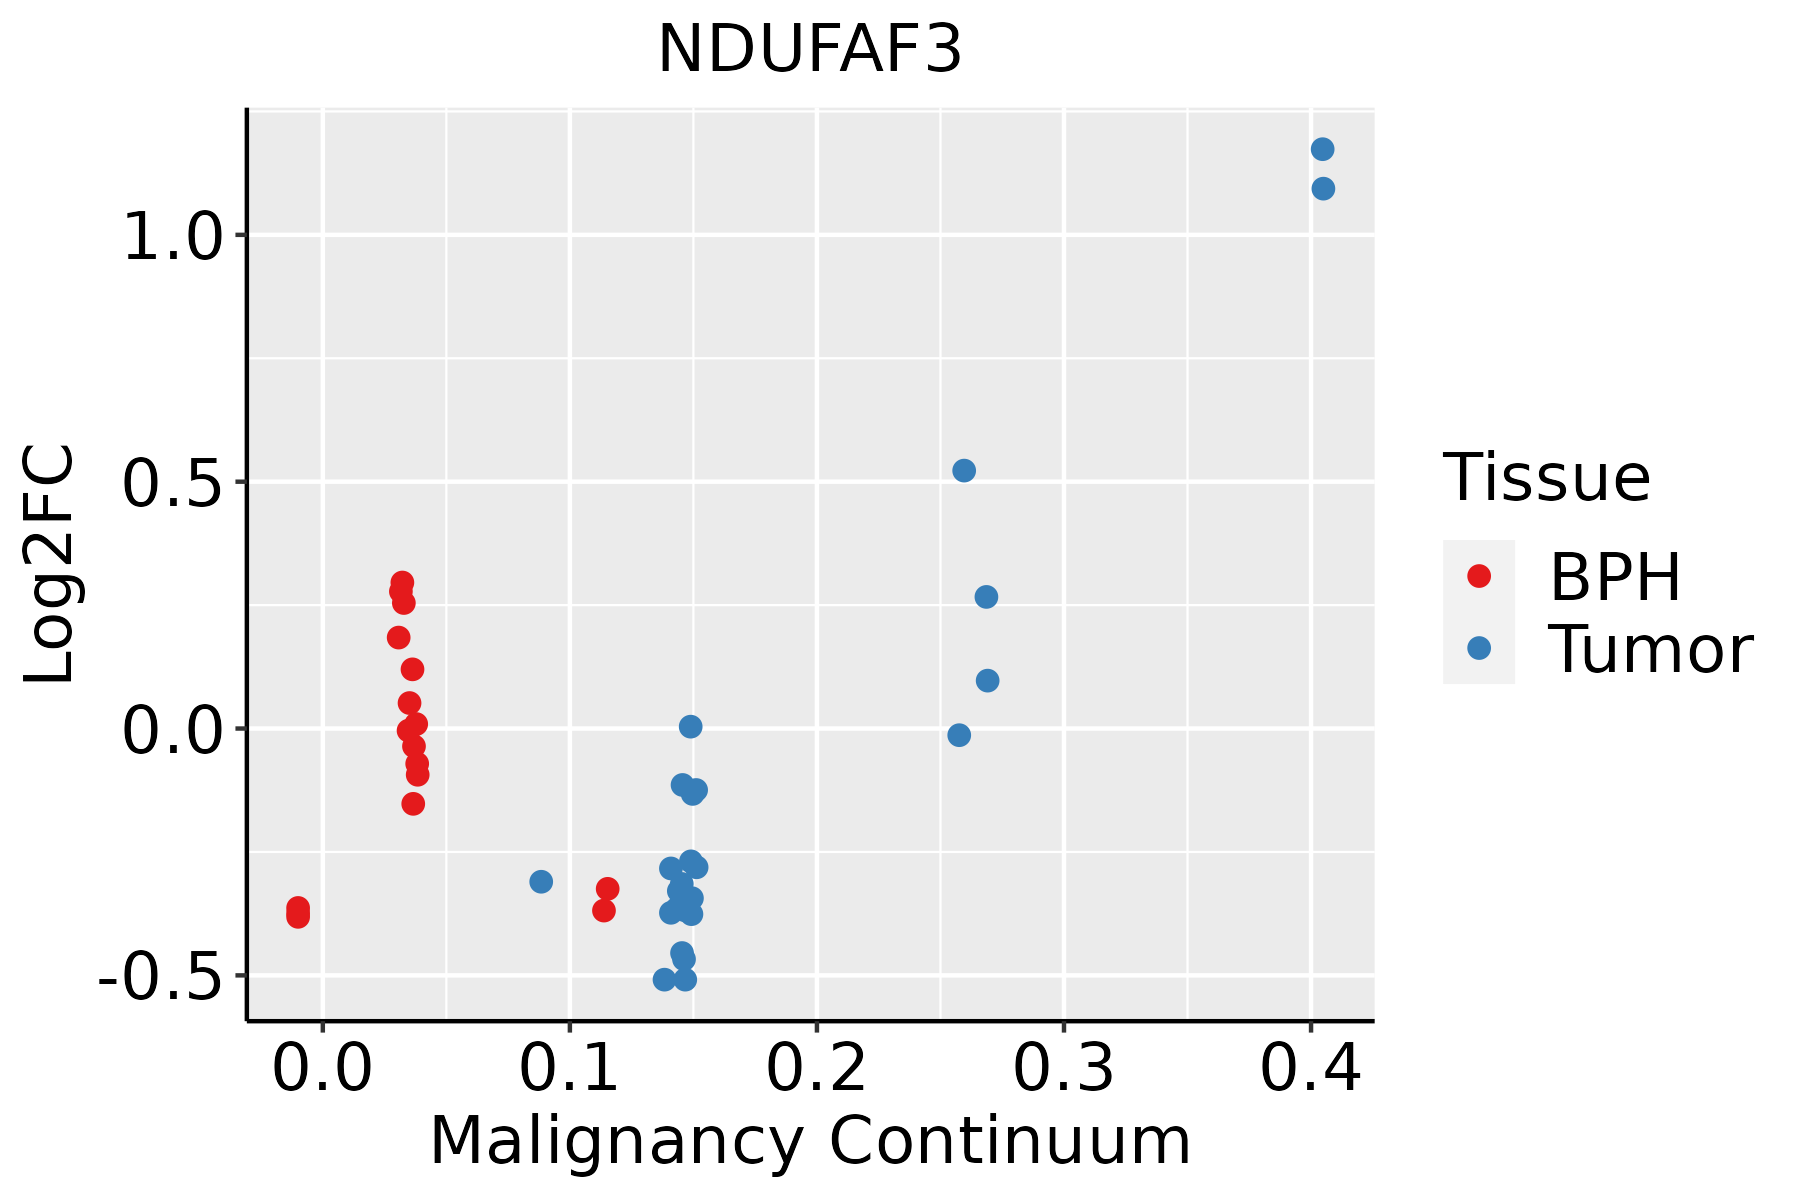 | BPH: Benign Prostatic Hyperplasia |
| Skin | 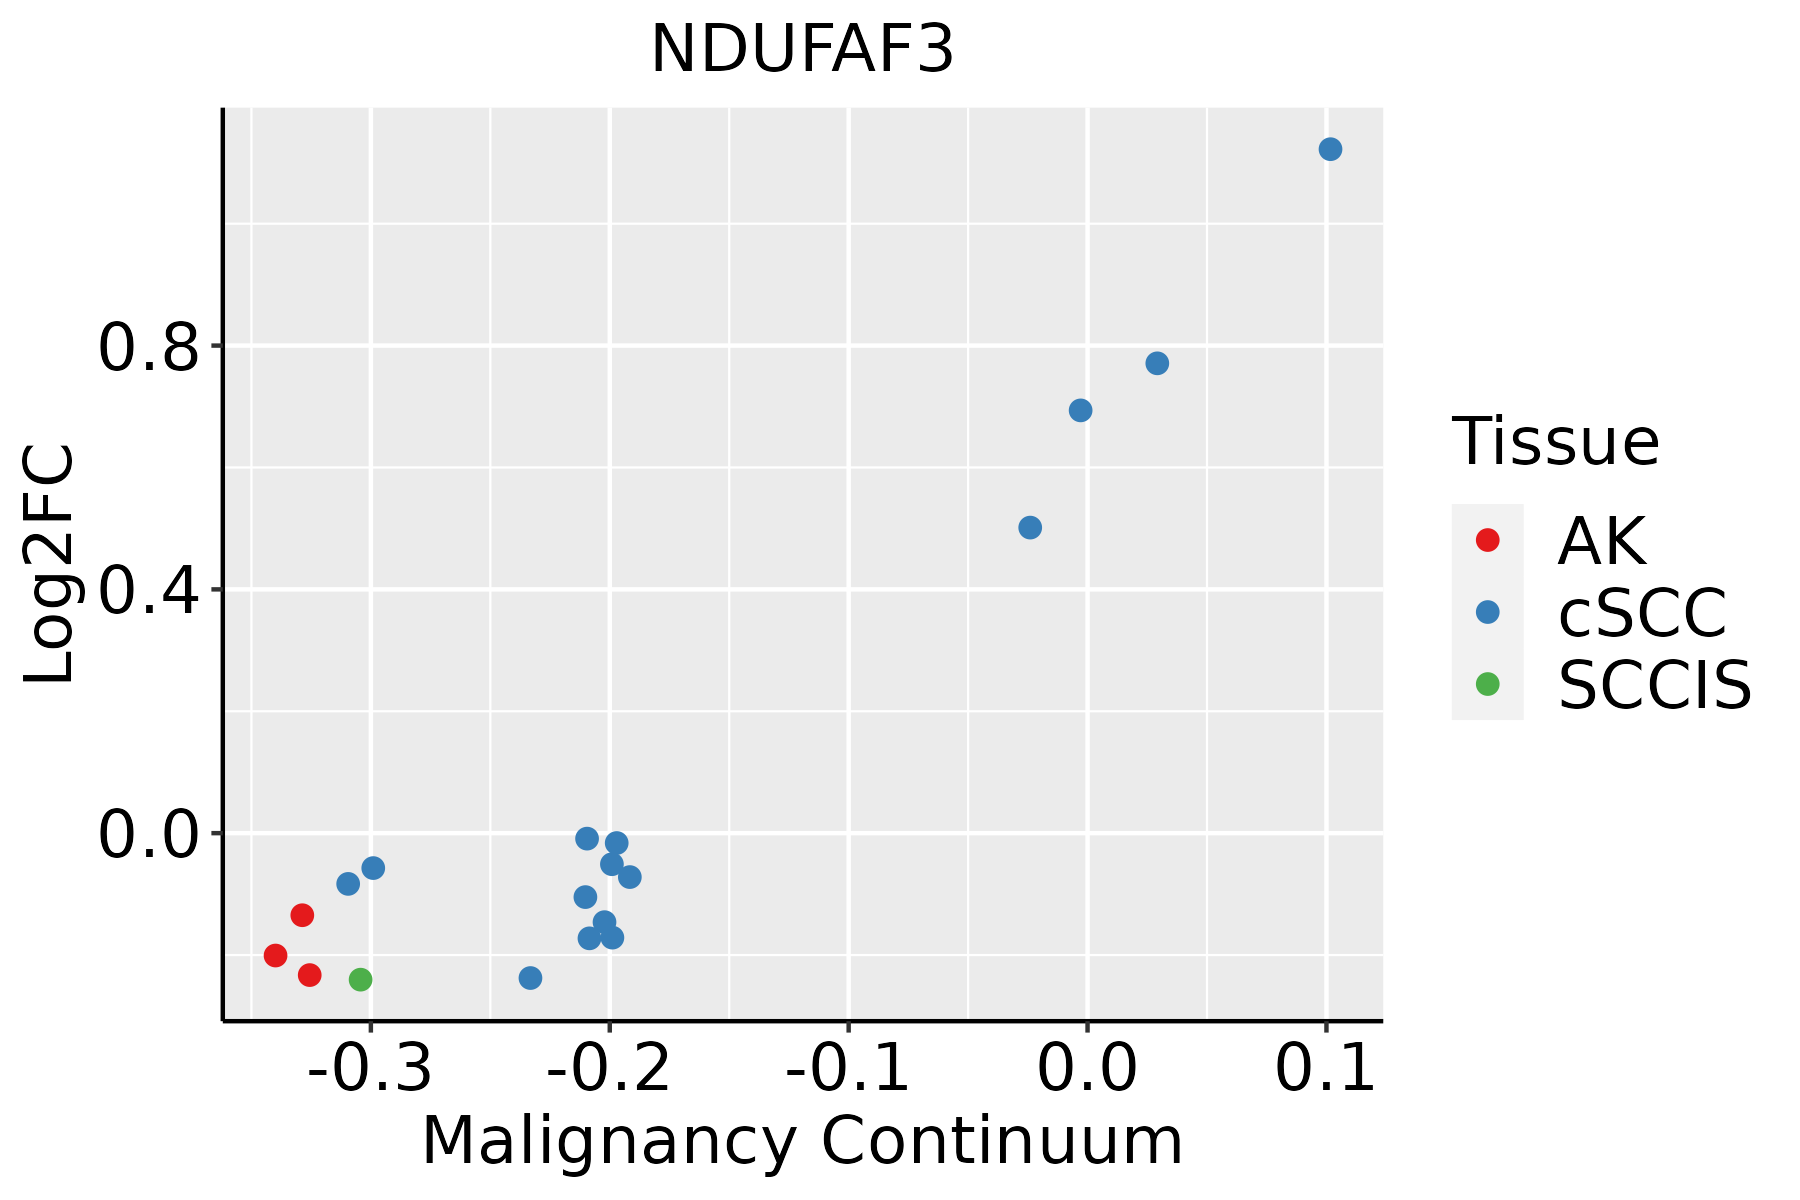 | AK: Actinic keratosis |
| cSCC: Cutaneous squamous cell carcinoma | ||
| SCCIS:squamous cell carcinoma in situ | ||
| Thyroid | 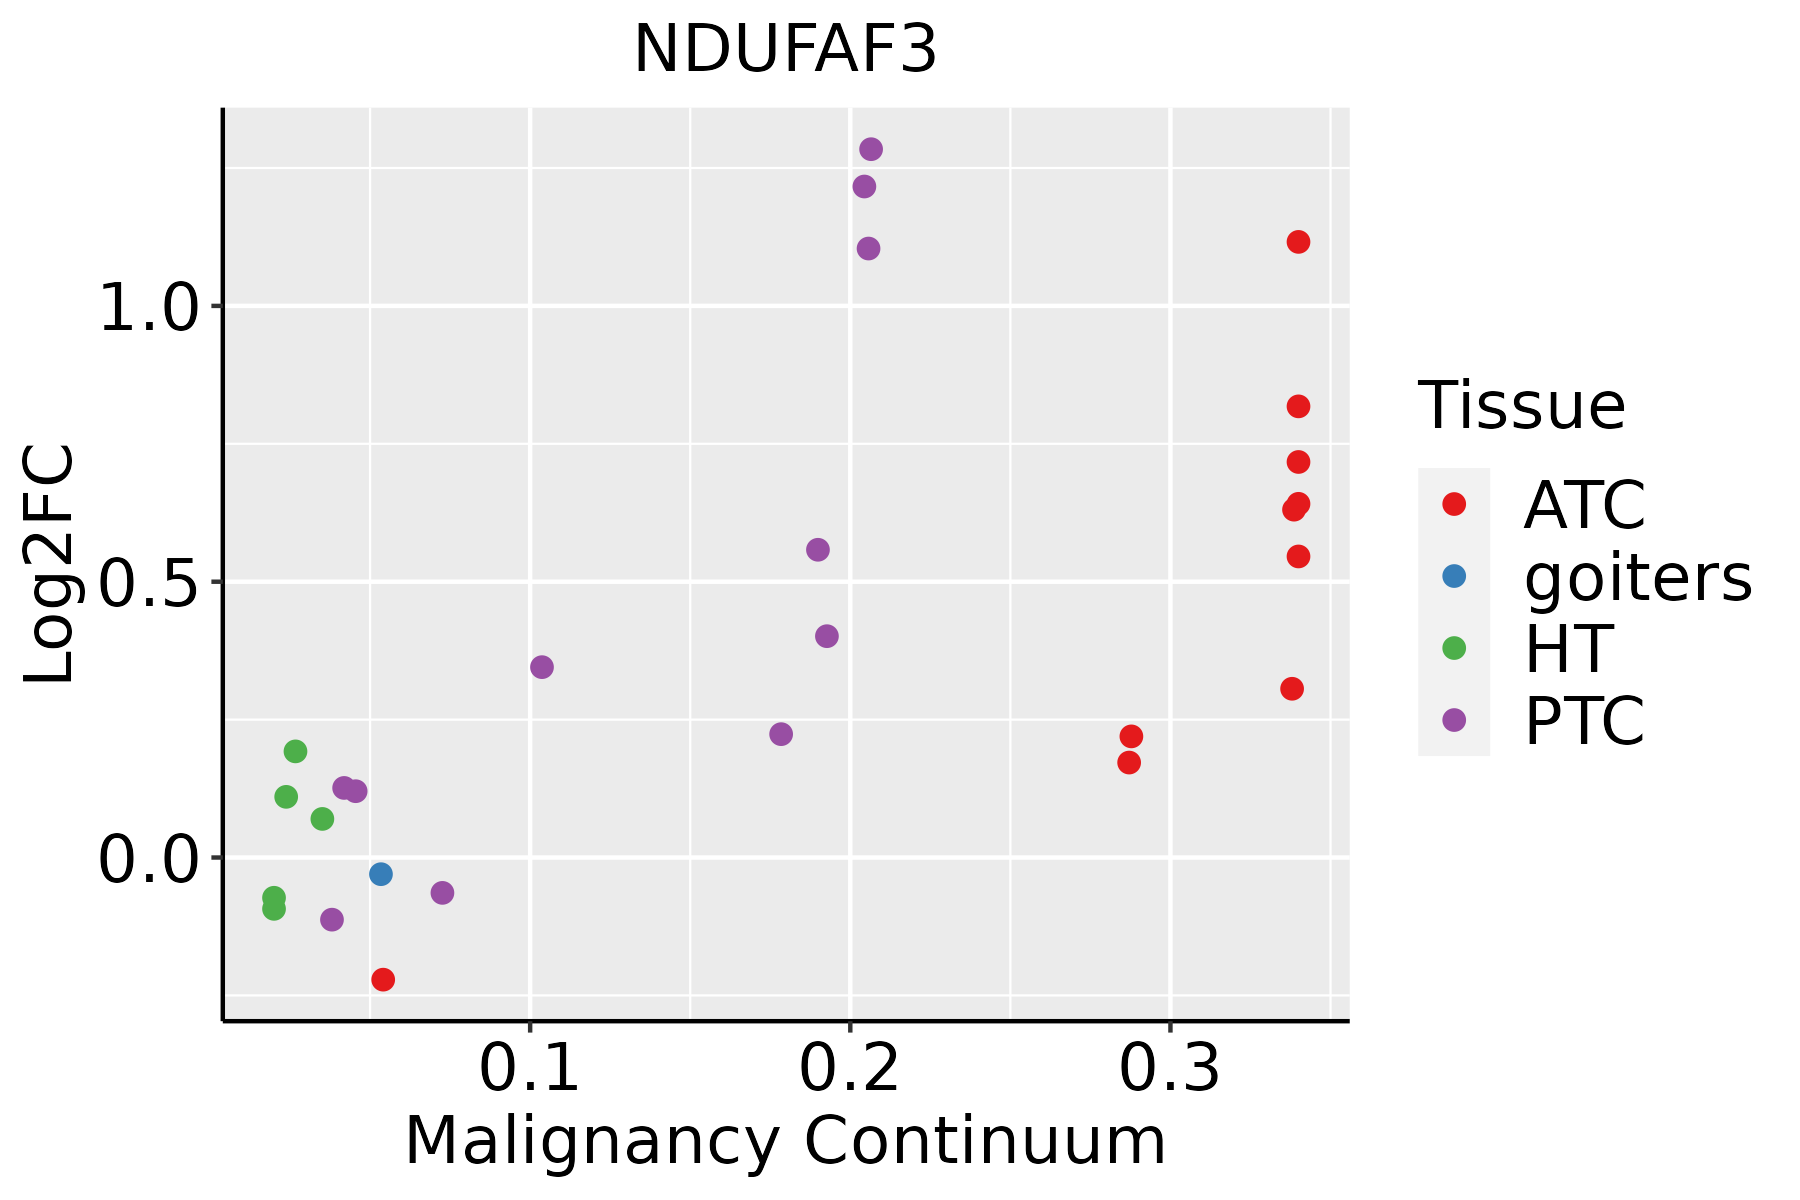 | ATC: Anaplastic thyroid cancer |
| HT: Hashimoto's thyroiditis | ||
| PTC: Papillary thyroid cancer |
| ∗log2FC in expression of this searched gene in stem-like cells from each diseased tissue sample relative to stem-like cells in normal samples in each tissue plotted against the malignancy continuum. Samples are colored based on if they are from different disease stage. |
Top |
Malignant transformation related pathway analysis |
| Find out the enriched GO biological processes and KEGG pathways involved in transition from healthy to precancer to cancer |
| Tissue | Disease Stage | Enriched GO biological Processes |
| Colorectum | AD |  |
| Colorectum | SER |  |
| Colorectum | MSS |  |
| Colorectum | MSI-H |  |
| Colorectum | FAP |  |
| ∗Top 15 enriched GO BP terms are showed in the bar plot of each disease state in each tissue. Each row represents a significant GO biological process which is colored according to the -log10(p.adjust). |
| Page: 1 2 3 4 5 6 7 8 9 |
| GO ID | Tissue | Disease Stage | Description | Gene Ratio | Bg Ratio | pvalue | p.adjust | Count |
| GO:00102578 | Breast | Precancer | NADH dehydrogenase complex assembly | 19/1080 | 57/18723 | 1.93e-10 | 1.92e-08 | 19 |
| GO:00329818 | Breast | Precancer | mitochondrial respiratory chain complex I assembly | 19/1080 | 57/18723 | 1.93e-10 | 1.92e-08 | 19 |
| GO:00331088 | Breast | Precancer | mitochondrial respiratory chain complex assembly | 24/1080 | 93/18723 | 3.39e-10 | 3.16e-08 | 24 |
| GO:001025713 | Breast | IDC | NADH dehydrogenase complex assembly | 22/1434 | 57/18723 | 6.20e-11 | 8.80e-09 | 22 |
| GO:003298113 | Breast | IDC | mitochondrial respiratory chain complex I assembly | 22/1434 | 57/18723 | 6.20e-11 | 8.80e-09 | 22 |
| GO:003310813 | Breast | IDC | mitochondrial respiratory chain complex assembly | 28/1434 | 93/18723 | 1.54e-10 | 1.83e-08 | 28 |
| GO:001025723 | Breast | DCIS | NADH dehydrogenase complex assembly | 22/1390 | 57/18723 | 3.38e-11 | 5.17e-09 | 22 |
| GO:003298123 | Breast | DCIS | mitochondrial respiratory chain complex I assembly | 22/1390 | 57/18723 | 3.38e-11 | 5.17e-09 | 22 |
| GO:003310823 | Breast | DCIS | mitochondrial respiratory chain complex assembly | 28/1390 | 93/18723 | 7.50e-11 | 9.43e-09 | 28 |
| GO:0010257 | Colorectum | AD | NADH dehydrogenase complex assembly | 34/3918 | 57/18723 | 2.15e-10 | 1.89e-08 | 34 |
| GO:0032981 | Colorectum | AD | mitochondrial respiratory chain complex I assembly | 34/3918 | 57/18723 | 2.15e-10 | 1.89e-08 | 34 |
| GO:0033108 | Colorectum | AD | mitochondrial respiratory chain complex assembly | 46/3918 | 93/18723 | 8.95e-10 | 6.91e-08 | 46 |
| GO:00102571 | Colorectum | SER | NADH dehydrogenase complex assembly | 30/2897 | 57/18723 | 7.92e-11 | 1.19e-08 | 30 |
| GO:00329811 | Colorectum | SER | mitochondrial respiratory chain complex I assembly | 30/2897 | 57/18723 | 7.92e-11 | 1.19e-08 | 30 |
| GO:00331081 | Colorectum | SER | mitochondrial respiratory chain complex assembly | 39/2897 | 93/18723 | 8.13e-10 | 8.74e-08 | 39 |
| GO:00102572 | Colorectum | MSS | NADH dehydrogenase complex assembly | 33/3467 | 57/18723 | 4.07e-11 | 4.86e-09 | 33 |
| GO:00329812 | Colorectum | MSS | mitochondrial respiratory chain complex I assembly | 33/3467 | 57/18723 | 4.07e-11 | 4.86e-09 | 33 |
| GO:00331082 | Colorectum | MSS | mitochondrial respiratory chain complex assembly | 44/3467 | 93/18723 | 2.17e-10 | 2.09e-08 | 44 |
| GO:00102573 | Colorectum | MSI-H | NADH dehydrogenase complex assembly | 25/1319 | 57/18723 | 1.40e-14 | 3.53e-12 | 25 |
| GO:00329813 | Colorectum | MSI-H | mitochondrial respiratory chain complex I assembly | 25/1319 | 57/18723 | 1.40e-14 | 3.53e-12 | 25 |
| Page: 1 2 3 4 |
| Pathway ID | Tissue | Disease Stage | Description | Gene Ratio | Bg Ratio | pvalue | p.adjust | qvalue | Count |
| hsa0471418 | Breast | Precancer | Thermogenesis | 68/684 | 232/8465 | 4.40e-22 | 1.26e-20 | 9.69e-21 | 68 |
| hsa0471419 | Breast | Precancer | Thermogenesis | 68/684 | 232/8465 | 4.40e-22 | 1.26e-20 | 9.69e-21 | 68 |
| hsa0471424 | Breast | IDC | Thermogenesis | 75/867 | 232/8465 | 8.41e-21 | 3.04e-19 | 2.27e-19 | 75 |
| hsa0471434 | Breast | IDC | Thermogenesis | 75/867 | 232/8465 | 8.41e-21 | 3.04e-19 | 2.27e-19 | 75 |
| hsa0471443 | Breast | DCIS | Thermogenesis | 74/846 | 232/8465 | 8.72e-21 | 3.13e-19 | 2.30e-19 | 74 |
| hsa0471453 | Breast | DCIS | Thermogenesis | 74/846 | 232/8465 | 8.72e-21 | 3.13e-19 | 2.30e-19 | 74 |
| hsa04714 | Colorectum | AD | Thermogenesis | 120/2092 | 232/8465 | 2.76e-19 | 1.16e-17 | 7.37e-18 | 120 |
| hsa047141 | Colorectum | AD | Thermogenesis | 120/2092 | 232/8465 | 2.76e-19 | 1.16e-17 | 7.37e-18 | 120 |
| hsa047142 | Colorectum | SER | Thermogenesis | 106/1580 | 232/8465 | 1.15e-21 | 6.34e-20 | 4.61e-20 | 106 |
| hsa047143 | Colorectum | SER | Thermogenesis | 106/1580 | 232/8465 | 1.15e-21 | 6.34e-20 | 4.61e-20 | 106 |
| hsa047144 | Colorectum | MSS | Thermogenesis | 113/1875 | 232/8465 | 1.52e-19 | 4.62e-18 | 2.83e-18 | 113 |
| hsa047145 | Colorectum | MSS | Thermogenesis | 113/1875 | 232/8465 | 1.52e-19 | 4.62e-18 | 2.83e-18 | 113 |
| hsa047146 | Colorectum | MSI-H | Thermogenesis | 56/797 | 232/8465 | 1.79e-11 | 4.14e-10 | 3.47e-10 | 56 |
| hsa047147 | Colorectum | MSI-H | Thermogenesis | 56/797 | 232/8465 | 1.79e-11 | 4.14e-10 | 3.47e-10 | 56 |
| hsa0471426 | Endometrium | AEH | Thermogenesis | 85/1197 | 232/8465 | 3.44e-18 | 9.33e-17 | 6.83e-17 | 85 |
| hsa04714111 | Endometrium | AEH | Thermogenesis | 85/1197 | 232/8465 | 3.44e-18 | 9.33e-17 | 6.83e-17 | 85 |
| hsa0471427 | Endometrium | EEC | Thermogenesis | 85/1237 | 232/8465 | 2.79e-17 | 7.05e-16 | 5.26e-16 | 85 |
| hsa0471436 | Endometrium | EEC | Thermogenesis | 85/1237 | 232/8465 | 2.79e-17 | 7.05e-16 | 5.26e-16 | 85 |
| hsa0471439 | Esophagus | HGIN | Thermogenesis | 91/1383 | 232/8465 | 1.97e-17 | 5.36e-16 | 4.25e-16 | 91 |
| hsa04714114 | Esophagus | HGIN | Thermogenesis | 91/1383 | 232/8465 | 1.97e-17 | 5.36e-16 | 4.25e-16 | 91 |
| Page: 1 2 |
Top |
Cell-cell communication analysis |
| Identification of potential cell-cell interactions between two cell types and their ligand-receptor pairs for different disease states |
| Ligand | Receptor | LRpair | Pathway | Tissue | Disease Stage |
| Page: 1 |
Top |
Single-cell gene regulatory network inference analysis |
| Find out the significant the regulons (TFs) and the target genes of each regulon across cell types for different disease states |
| TF | Cell Type | Tissue | Disease Stage | Target Gene | RSS | Regulon Activity |
| ∗The dot plots of a searched regulon are shown for all cell subpopulations in each disease state of each tissue based on the regulon specific score inferred using pySCENIC and by calculating the average expression. |
| Page: 1 |
Top |
Somatic mutation of malignant transformation related genes |
| Annotation of somatic variants for genes involved in malignant transformation |
| Hugo Symbol | Variant Class | Variant Classification | dbSNP RS | HGVSc | HGVSp | HGVSp Short | SWISSPROT | BIOTYPE | SIFT | PolyPhen | Tumor Sample Barcode | Tissue | Histology | Sex | Age | Stage | Therapy Types | Drugs | Outcome |
| NDUFAF3 | SNV | Missense_Mutation | novel | c.16G>T | p.Ala6Ser | p.A6S | Q9BU61 | protein_coding | tolerated(0.23) | benign(0.049) | TCGA-5T-A9QA-01 | Breast | breast invasive carcinoma | Female | <65 | I/II | Chemotherapy | taxol | SD |
| NDUFAF3 | SNV | Missense_Mutation | c.262N>G | p.Gln88Glu | p.Q88E | Q9BU61 | protein_coding | deleterious(0.01) | possibly_damaging(0.796) | TCGA-A7-A6VX-01 | Breast | breast invasive carcinoma | Female | >=65 | I/II | Chemotherapy | docetaxel | CR | |
| NDUFAF3 | SNV | Missense_Mutation | c.58N>T | p.Pro20Ser | p.P20S | Q9BU61 | protein_coding | tolerated(0.48) | benign(0) | TCGA-LP-A4AU-01 | Cervix | cervical & endocervical cancer | Female | <65 | III/IV | Chemotherapy | cisplatin | CR | |
| NDUFAF3 | SNV | Missense_Mutation | novel | c.467N>A | p.Leu156Gln | p.L156Q | Q9BU61 | protein_coding | deleterious(0) | probably_damaging(0.999) | TCGA-AA-3947-01 | Colorectum | colon adenocarcinoma | Female | <65 | I/II | Unknown | Unknown | SD |
| NDUFAF3 | SNV | Missense_Mutation | novel | c.295N>A | p.Glu99Lys | p.E99K | Q9BU61 | protein_coding | deleterious(0.03) | probably_damaging(0.946) | TCGA-B5-A1MR-01 | Endometrium | uterine corpus endometrioid carcinoma | Female | >=65 | III/IV | Unknown | Unknown | SD |
| NDUFAF3 | SNV | Missense_Mutation | novel | c.381G>T | p.Gln127His | p.Q127H | Q9BU61 | protein_coding | tolerated(0.41) | benign(0.003) | TCGA-B5-A3FC-01 | Endometrium | uterine corpus endometrioid carcinoma | Female | <65 | I/II | Unknown | Unknown | SD |
| NDUFAF3 | SNV | Missense_Mutation | novel | c.505C>A | p.Pro169Thr | p.P169T | Q9BU61 | protein_coding | deleterious(0) | probably_damaging(1) | TCGA-05-4396-01 | Lung | lung adenocarcinoma | Male | >=65 | III/IV | Unknown | Unknown | SD |
| NDUFAF3 | SNV | Missense_Mutation | c.292A>G | p.Thr98Ala | p.T98A | Q9BU61 | protein_coding | deleterious(0.01) | possibly_damaging(0.595) | TCGA-44-2665-01 | Lung | lung adenocarcinoma | Female | <65 | I/II | Targeted Molecular therapy | bevacizumab | SD | |
| NDUFAF3 | SNV | Missense_Mutation | novel | c.37N>T | p.Ala13Ser | p.A13S | Q9BU61 | protein_coding | tolerated(0.25) | benign(0.01) | TCGA-85-7843-01 | Lung | lung squamous cell carcinoma | Male | <65 | I/II | Unknown | Unknown | SD |
| NDUFAF3 | SNV | Missense_Mutation | novel | c.230N>T | p.Gly77Val | p.G77V | Q9BU61 | protein_coding | deleterious(0) | probably_damaging(1) | TCGA-CN-A49A-01 | Oral cavity | head & neck squamous cell carcinoma | Male | <65 | I/II | Chemotherapy | carboplatin | PD |
| Page: 1 2 |
Top |
Related drugs of malignant transformation related genes |
| Identification of chemicals and drugs interact with genes involved in malignant transfromation |
| (DGIdb 4.0) |
| Entrez ID | Symbol | Category | Interaction Types | Drug Claim Name | Drug Name | PMIDs |
| 25915 | NDUFAF3 | NA | inhibitor | CHEMBL3545320 | ME-344 | |
| 25915 | NDUFAF3 | NA | inhibitor | CHEMBL3545135 | NV-128 | |
| 25915 | NDUFAF3 | NA | inhibitor | CHEMBL1703 | METFORMIN HYDROCHLORIDE |
| Page: 1 |

Copyright 2023-Present -The University of Texas Health Science Center at Houston |