
|
|||||
|
 | |
| |
| |
| |
| |
| |
|
Gene: NDUFAF1 |
Gene summary for NDUFAF1 |
| Gene information | Species | Human | Gene symbol | NDUFAF1 | Gene ID | 51103 |
| Gene name | NADH:ubiquinone oxidoreductase complex assembly factor 1 | |
| Gene Alias | CGI-65 | |
| Cytomap | 15q15.1 | |
| Gene Type | protein-coding | GO ID | GO:0006091 | UniProtAcc | A0A024R9L0 |
Top |
Malignant transformation analysis |
| Identification of the aberrant gene expression in precancerous and cancerous lesions by comparing the gene expression of stem-like cells in diseased tissues with normal stem cells |
| Entrez ID | Symbol | Replicates | Species | Organ | Tissue | Adj P-value | Log2FC | Malignancy |
| 51103 | NDUFAF1 | LZE4T | Human | Esophagus | ESCC | 3.74e-03 | 1.22e-01 | 0.0811 |
| 51103 | NDUFAF1 | LZE7T | Human | Esophagus | ESCC | 1.51e-02 | 2.30e-01 | 0.0667 |
| 51103 | NDUFAF1 | LZE20T | Human | Esophagus | ESCC | 2.32e-04 | 1.23e-01 | 0.0662 |
| 51103 | NDUFAF1 | LZE24T | Human | Esophagus | ESCC | 5.01e-03 | 8.70e-02 | 0.0596 |
| 51103 | NDUFAF1 | P1T-E | Human | Esophagus | ESCC | 6.06e-04 | 1.65e-01 | 0.0875 |
| 51103 | NDUFAF1 | P2T-E | Human | Esophagus | ESCC | 2.01e-04 | 1.39e-01 | 0.1177 |
| 51103 | NDUFAF1 | P4T-E | Human | Esophagus | ESCC | 4.06e-21 | 4.94e-01 | 0.1323 |
| 51103 | NDUFAF1 | P5T-E | Human | Esophagus | ESCC | 2.39e-16 | 3.29e-01 | 0.1327 |
| 51103 | NDUFAF1 | P8T-E | Human | Esophagus | ESCC | 1.11e-16 | 2.33e-01 | 0.0889 |
| 51103 | NDUFAF1 | P9T-E | Human | Esophagus | ESCC | 1.95e-11 | 1.96e-01 | 0.1131 |
| 51103 | NDUFAF1 | P10T-E | Human | Esophagus | ESCC | 2.53e-12 | 2.20e-01 | 0.116 |
| 51103 | NDUFAF1 | P11T-E | Human | Esophagus | ESCC | 4.43e-04 | 1.73e-01 | 0.1426 |
| 51103 | NDUFAF1 | P12T-E | Human | Esophagus | ESCC | 6.06e-15 | 2.26e-01 | 0.1122 |
| 51103 | NDUFAF1 | P15T-E | Human | Esophagus | ESCC | 1.44e-02 | 9.76e-02 | 0.1149 |
| 51103 | NDUFAF1 | P16T-E | Human | Esophagus | ESCC | 7.80e-05 | 1.64e-01 | 0.1153 |
| 51103 | NDUFAF1 | P17T-E | Human | Esophagus | ESCC | 1.62e-02 | 1.55e-01 | 0.1278 |
| 51103 | NDUFAF1 | P19T-E | Human | Esophagus | ESCC | 8.31e-05 | 2.63e-01 | 0.1662 |
| 51103 | NDUFAF1 | P20T-E | Human | Esophagus | ESCC | 2.77e-03 | 1.33e-01 | 0.1124 |
| 51103 | NDUFAF1 | P21T-E | Human | Esophagus | ESCC | 2.78e-11 | 1.49e-01 | 0.1617 |
| 51103 | NDUFAF1 | P22T-E | Human | Esophagus | ESCC | 8.70e-18 | 2.60e-01 | 0.1236 |
| Page: 1 2 3 4 5 |
| Tissue | Expression Dynamics | Abbreviation |
| Esophagus |  | ESCC: Esophageal squamous cell carcinoma |
| HGIN: High-grade intraepithelial neoplasias | ||
| LGIN: Low-grade intraepithelial neoplasias | ||
| Liver | 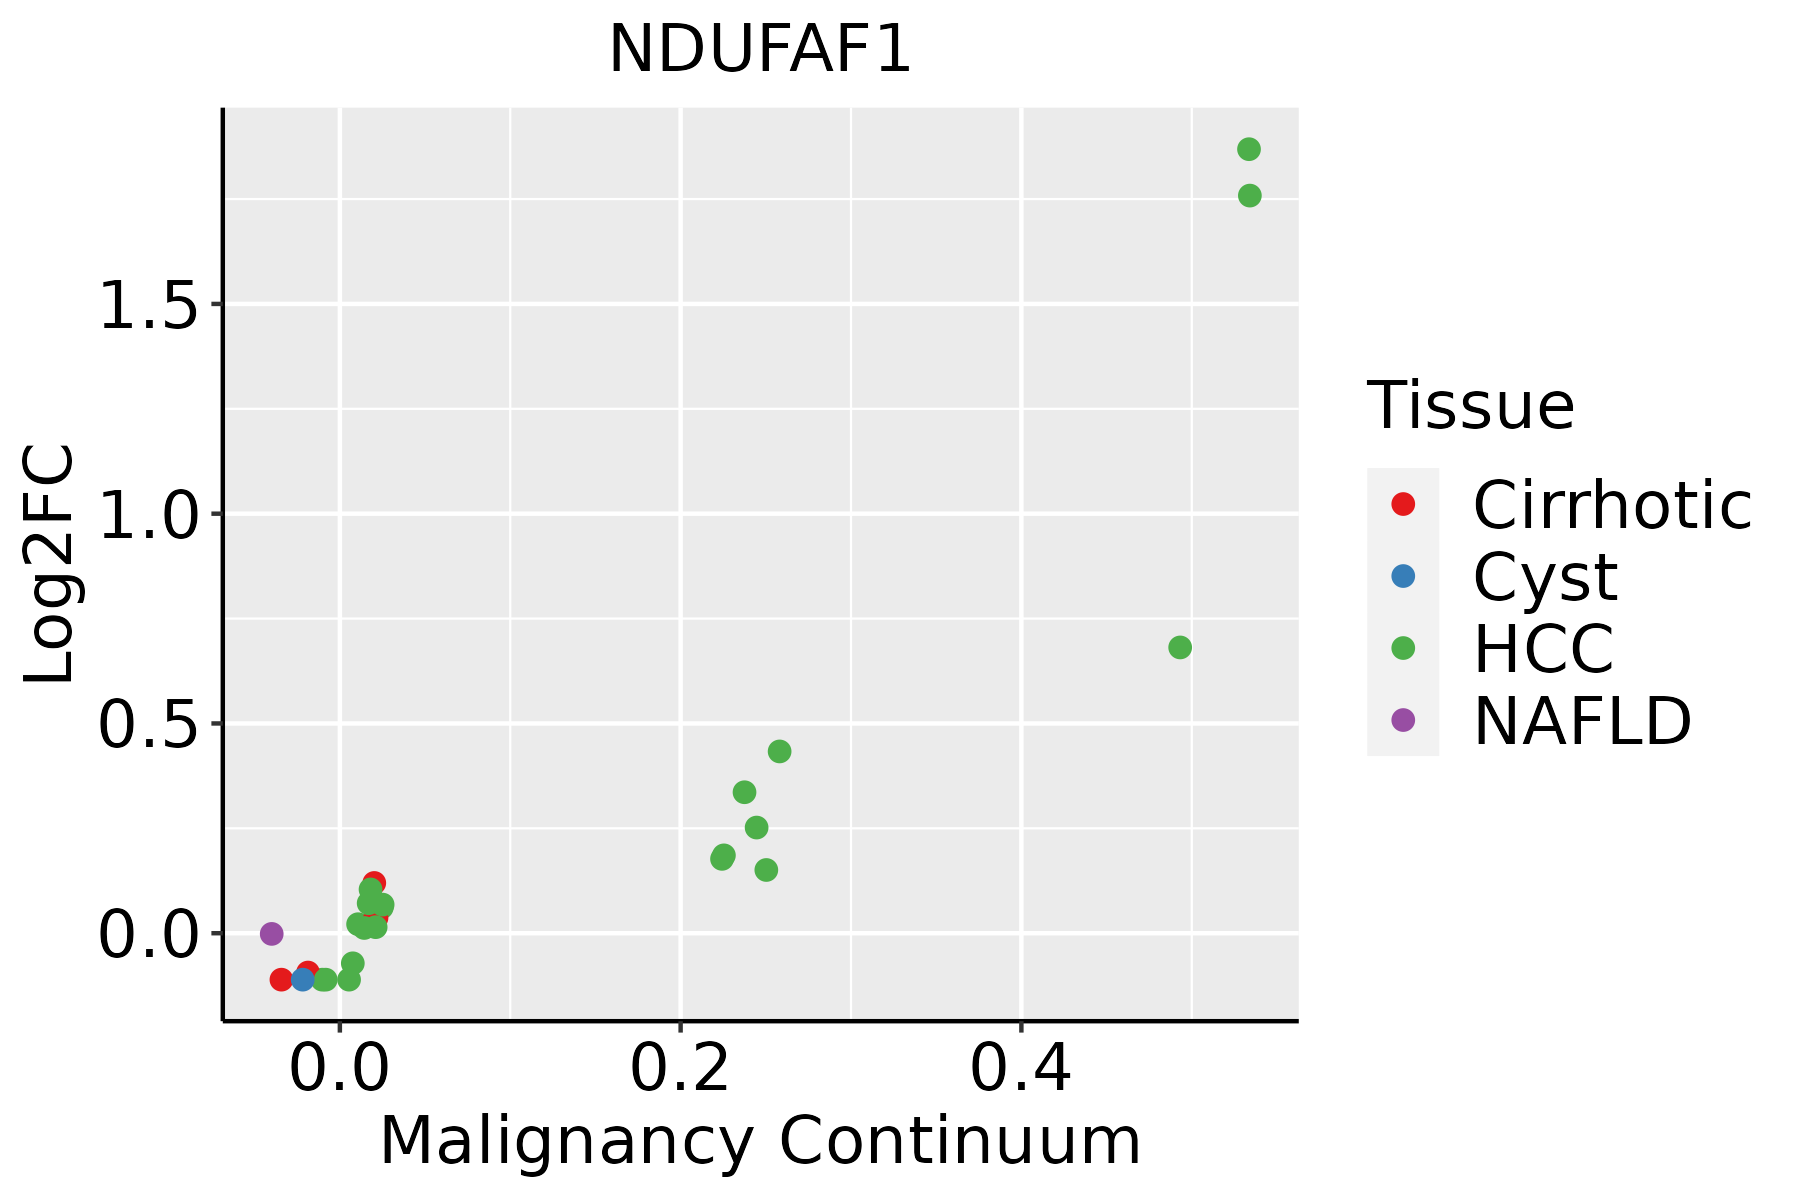 | HCC: Hepatocellular carcinoma |
| NAFLD: Non-alcoholic fatty liver disease | ||
| Oral Cavity | 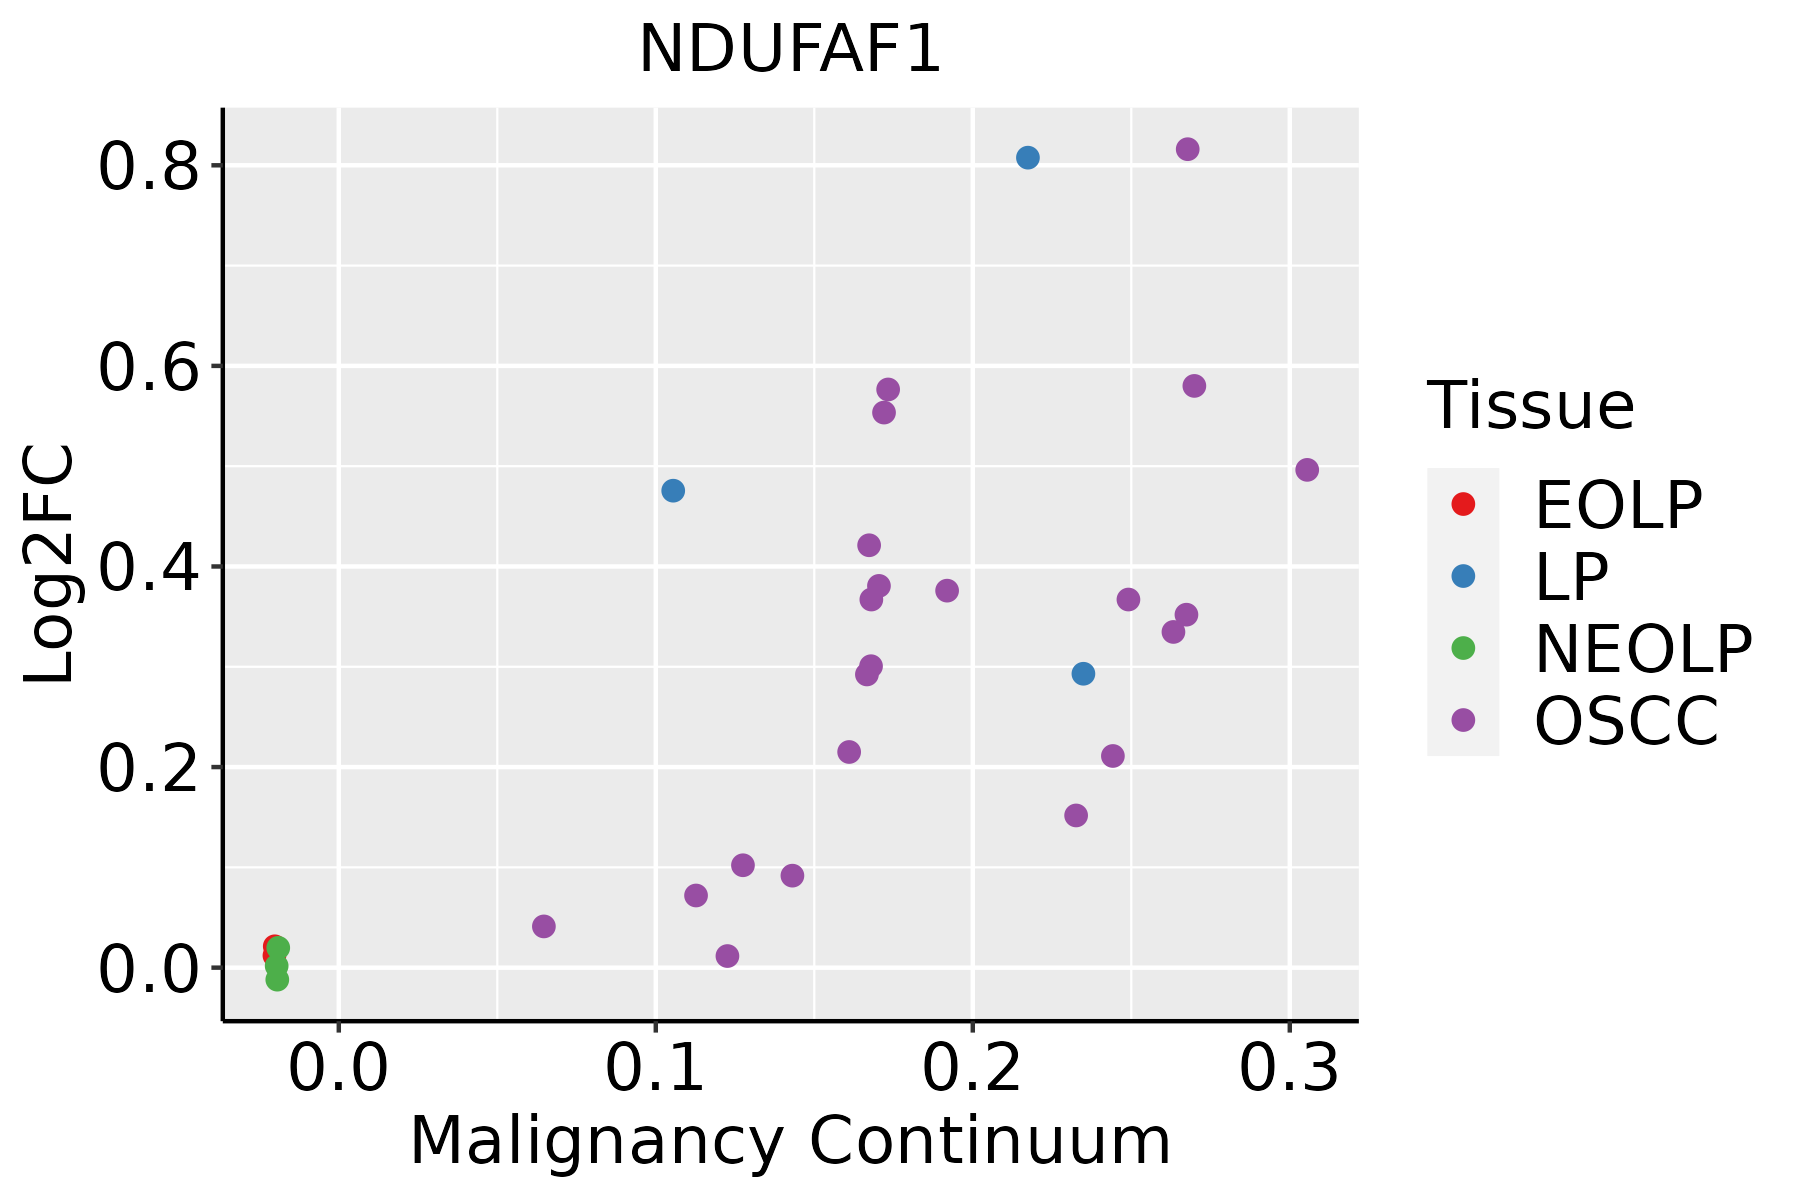 | EOLP: Erosive Oral lichen planus |
| LP: leukoplakia | ||
| NEOLP: Non-erosive oral lichen planus | ||
| OSCC: Oral squamous cell carcinoma | ||
| Skin | 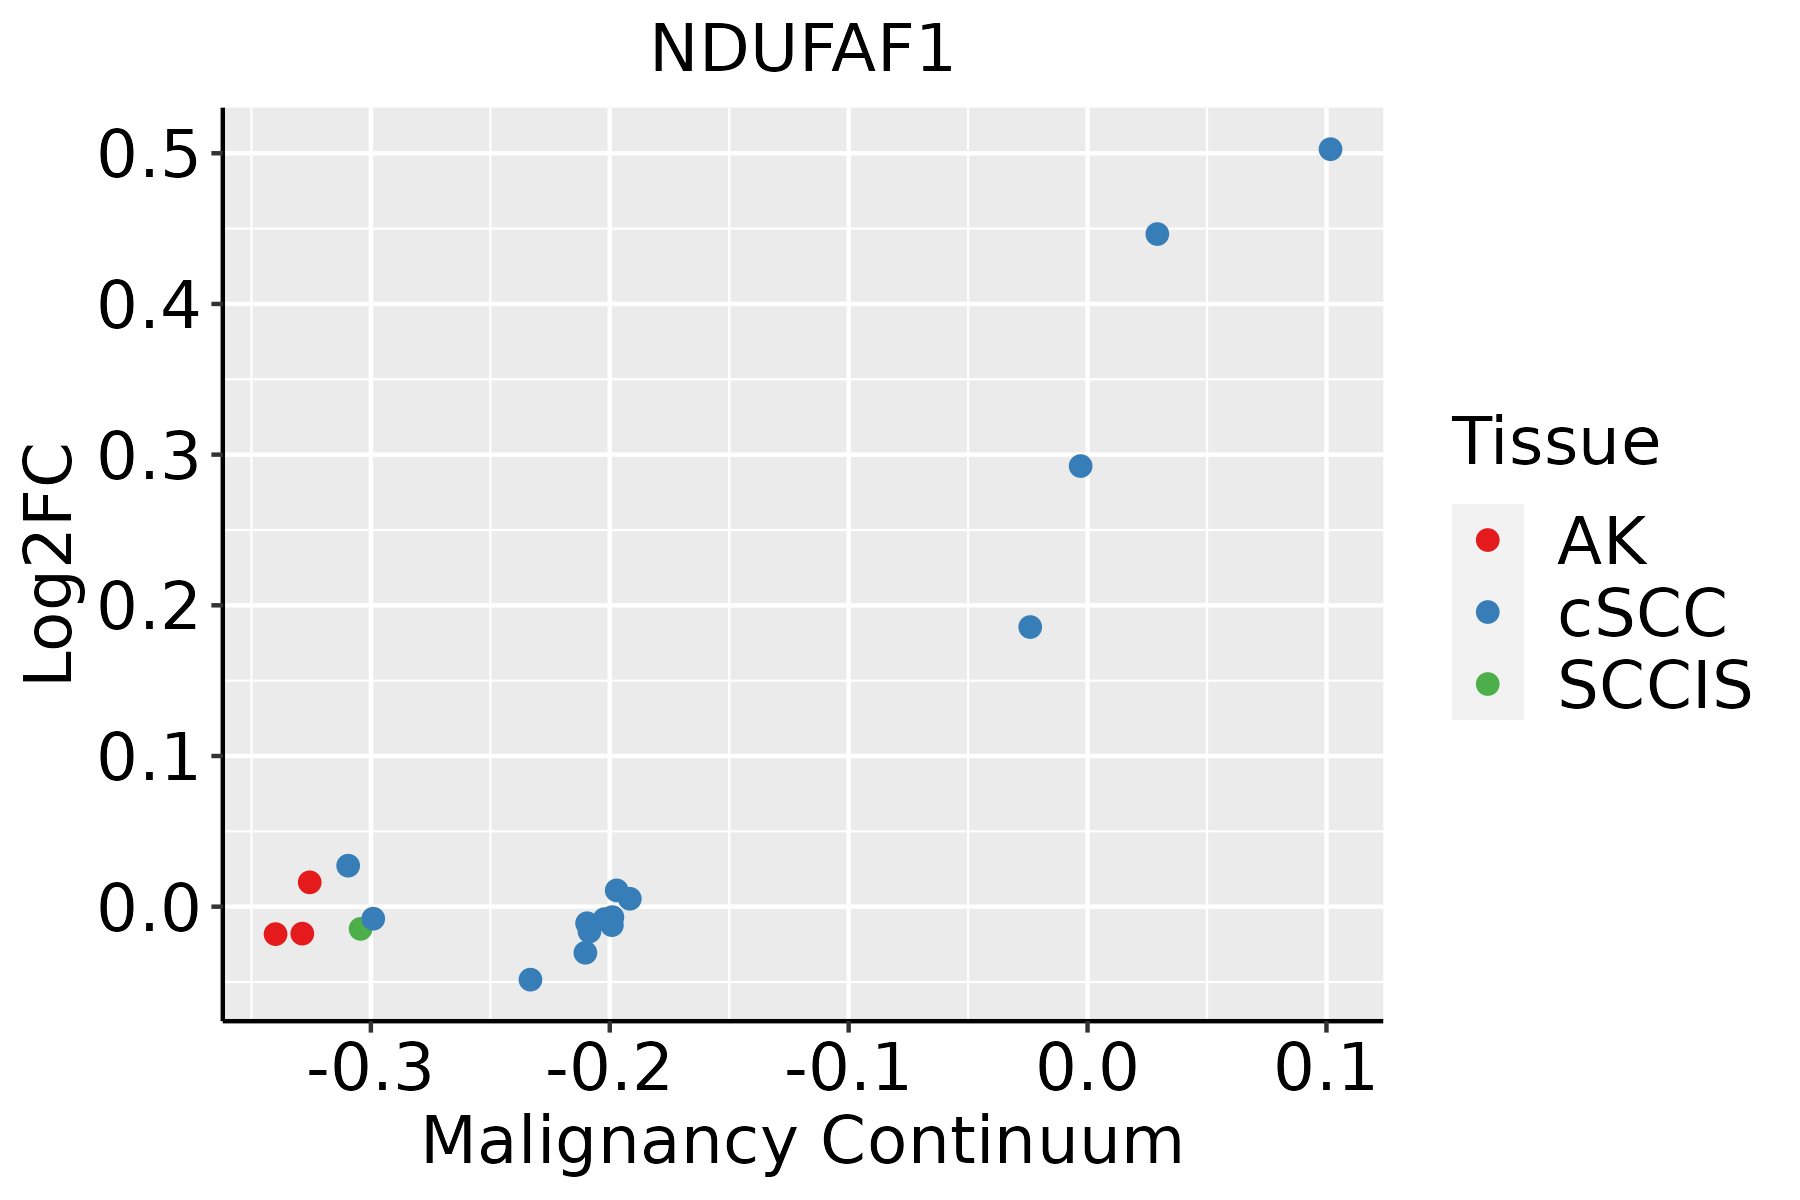 | AK: Actinic keratosis |
| cSCC: Cutaneous squamous cell carcinoma | ||
| SCCIS:squamous cell carcinoma in situ |
| ∗log2FC in expression of this searched gene in stem-like cells from each diseased tissue sample relative to stem-like cells in normal samples in each tissue plotted against the malignancy continuum. Samples are colored based on if they are from different disease stage. |
Top |
Malignant transformation related pathway analysis |
| Find out the enriched GO biological processes and KEGG pathways involved in transition from healthy to precancer to cancer |
| Tissue | Disease Stage | Enriched GO biological Processes |
| Colorectum | AD |  |
| Colorectum | SER |  |
| Colorectum | MSS |  |
| Colorectum | MSI-H |  |
| Colorectum | FAP |  |
| ∗Top 15 enriched GO BP terms are showed in the bar plot of each disease state in each tissue. Each row represents a significant GO biological process which is colored according to the -log10(p.adjust). |
| Page: 1 2 3 4 5 6 7 8 9 |
| GO ID | Tissue | Disease Stage | Description | Gene Ratio | Bg Ratio | pvalue | p.adjust | Count |
| GO:0006091110 | Esophagus | ESCC | generation of precursor metabolites and energy | 331/8552 | 490/18723 | 3.86e-23 | 8.45e-21 | 331 |
| GO:0045333110 | Esophagus | ESCC | cellular respiration | 173/8552 | 230/18723 | 4.53e-20 | 5.99e-18 | 173 |
| GO:0033108110 | Esophagus | ESCC | mitochondrial respiratory chain complex assembly | 83/8552 | 93/18723 | 9.56e-19 | 1.05e-16 | 83 |
| GO:0009060110 | Esophagus | ESCC | aerobic respiration | 145/8552 | 189/18723 | 2.16e-18 | 2.21e-16 | 145 |
| GO:0015980110 | Esophagus | ESCC | energy derivation by oxidation of organic compounds | 220/8552 | 318/18723 | 1.20e-17 | 1.09e-15 | 220 |
| GO:0022900110 | Esophagus | ESCC | electron transport chain | 133/8552 | 175/18723 | 2.18e-16 | 1.67e-14 | 133 |
| GO:0046034111 | Esophagus | ESCC | ATP metabolic process | 189/8552 | 277/18723 | 1.99e-14 | 1.04e-12 | 189 |
| GO:0006119111 | Esophagus | ESCC | oxidative phosphorylation | 106/8552 | 141/18723 | 8.19e-13 | 3.63e-11 | 106 |
| GO:0022904110 | Esophagus | ESCC | respiratory electron transport chain | 89/8552 | 114/18723 | 1.36e-12 | 5.80e-11 | 89 |
| GO:0010257110 | Esophagus | ESCC | NADH dehydrogenase complex assembly | 50/8552 | 57/18723 | 3.78e-11 | 1.24e-09 | 50 |
| GO:0032981110 | Esophagus | ESCC | mitochondrial respiratory chain complex I assembly | 50/8552 | 57/18723 | 3.78e-11 | 1.24e-09 | 50 |
| GO:0042773110 | Esophagus | ESCC | ATP synthesis coupled electron transport | 74/8552 | 95/18723 | 1.28e-10 | 3.77e-09 | 74 |
| GO:0042775110 | Esophagus | ESCC | mitochondrial ATP synthesis coupled electron transport | 74/8552 | 95/18723 | 1.28e-10 | 3.77e-09 | 74 |
| GO:0019646110 | Esophagus | ESCC | aerobic electron transport chain | 67/8552 | 87/18723 | 2.30e-09 | 5.14e-08 | 67 |
| GO:0006120110 | Esophagus | ESCC | mitochondrial electron transport, NADH to ubiquinone | 42/8552 | 51/18723 | 7.43e-08 | 1.29e-06 | 42 |
| GO:005113119 | Esophagus | ESCC | chaperone-mediated protein complex assembly | 17/8552 | 23/18723 | 5.73e-03 | 2.13e-02 | 17 |
| GO:000609112 | Liver | Cirrhotic | generation of precursor metabolites and energy | 238/4634 | 490/18723 | 6.85e-31 | 1.07e-27 | 238 |
| GO:002290012 | Liver | Cirrhotic | electron transport chain | 111/4634 | 175/18723 | 1.94e-27 | 1.52e-24 | 111 |
| GO:004603412 | Liver | Cirrhotic | ATP metabolic process | 144/4634 | 277/18723 | 1.04e-22 | 5.02e-20 | 144 |
| GO:00427737 | Liver | Cirrhotic | ATP synthesis coupled electron transport | 69/4634 | 95/18723 | 1.12e-22 | 5.02e-20 | 69 |
| Page: 1 2 3 4 5 |
| Pathway ID | Tissue | Disease Stage | Description | Gene Ratio | Bg Ratio | pvalue | p.adjust | qvalue | Count |
| hsa04714211 | Esophagus | ESCC | Thermogenesis | 163/4205 | 232/8465 | 9.22e-11 | 1.14e-09 | 5.86e-10 | 163 |
| hsa04714310 | Esophagus | ESCC | Thermogenesis | 163/4205 | 232/8465 | 9.22e-11 | 1.14e-09 | 5.86e-10 | 163 |
| hsa0471414 | Liver | Cirrhotic | Thermogenesis | 121/2530 | 232/8465 | 5.70e-13 | 1.36e-11 | 8.36e-12 | 121 |
| hsa0471415 | Liver | Cirrhotic | Thermogenesis | 121/2530 | 232/8465 | 5.70e-13 | 1.36e-11 | 8.36e-12 | 121 |
| hsa0471422 | Liver | HCC | Thermogenesis | 170/4020 | 232/8465 | 5.36e-16 | 2.25e-14 | 1.25e-14 | 170 |
| hsa0471432 | Liver | HCC | Thermogenesis | 170/4020 | 232/8465 | 5.36e-16 | 2.25e-14 | 1.25e-14 | 170 |
| hsa0471430 | Oral cavity | OSCC | Thermogenesis | 138/3704 | 232/8465 | 7.67e-07 | 4.35e-06 | 2.22e-06 | 138 |
| hsa04714113 | Oral cavity | OSCC | Thermogenesis | 138/3704 | 232/8465 | 7.67e-07 | 4.35e-06 | 2.22e-06 | 138 |
| hsa04714210 | Oral cavity | LP | Thermogenesis | 105/2418 | 232/8465 | 3.14e-08 | 4.98e-07 | 3.21e-07 | 105 |
| hsa0471438 | Oral cavity | LP | Thermogenesis | 105/2418 | 232/8465 | 3.14e-08 | 4.98e-07 | 3.21e-07 | 105 |
| Page: 1 |
Top |
Cell-cell communication analysis |
| Identification of potential cell-cell interactions between two cell types and their ligand-receptor pairs for different disease states |
| Ligand | Receptor | LRpair | Pathway | Tissue | Disease Stage |
| Page: 1 |
Top |
Single-cell gene regulatory network inference analysis |
| Find out the significant the regulons (TFs) and the target genes of each regulon across cell types for different disease states |
| TF | Cell Type | Tissue | Disease Stage | Target Gene | RSS | Regulon Activity |
| ∗The dot plots of a searched regulon are shown for all cell subpopulations in each disease state of each tissue based on the regulon specific score inferred using pySCENIC and by calculating the average expression. |
| Page: 1 |
Top |
Somatic mutation of malignant transformation related genes |
| Annotation of somatic variants for genes involved in malignant transformation |
| Hugo Symbol | Variant Class | Variant Classification | dbSNP RS | HGVSc | HGVSp | HGVSp Short | SWISSPROT | BIOTYPE | SIFT | PolyPhen | Tumor Sample Barcode | Tissue | Histology | Sex | Age | Stage | Therapy Types | Drugs | Outcome |
| NDUFAF1 | SNV | Missense_Mutation | c.320G>C | p.Gly107Ala | p.G107A | Q9Y375 | protein_coding | deleterious(0) | probably_damaging(0.984) | TCGA-AC-A23H-01 | Breast | breast invasive carcinoma | Female | >=65 | I/II | Unknown | Unknown | PD | |
| NDUFAF1 | SNV | Missense_Mutation | c.737N>A | p.Gly246Glu | p.G246E | Q9Y375 | protein_coding | deleterious(0) | probably_damaging(1) | TCGA-AR-A255-01 | Breast | breast invasive carcinoma | Female | <65 | I/II | Targeted Molecular therapy | trastuzumab | SD | |
| NDUFAF1 | SNV | Missense_Mutation | rs148982578 | c.61N>G | p.Thr21Ala | p.T21A | Q9Y375 | protein_coding | tolerated(0.76) | benign(0) | TCGA-S3-AA0Z-01 | Breast | breast invasive carcinoma | Female | <65 | I/II | Ancillary | neulasta | CR |
| NDUFAF1 | deletion | Frame_Shift_Del | c.597_598delNN | p.Tyr200ArgfsTer38 | p.Y200Rfs*38 | Q9Y375 | protein_coding | TCGA-BH-A18H-01 | Breast | breast invasive carcinoma | Female | <65 | I/II | Chemotherapy | adriamycin | CR | |||
| NDUFAF1 | SNV | Missense_Mutation | rs751866388 | c.649C>T | p.Arg217Trp | p.R217W | Q9Y375 | protein_coding | deleterious(0.03) | probably_damaging(1) | TCGA-5M-AAT6-01 | Colorectum | colon adenocarcinoma | Female | <65 | III/IV | Unknown | Unknown | PD |
| NDUFAF1 | SNV | Missense_Mutation | c.709N>C | p.Tyr237His | p.Y237H | Q9Y375 | protein_coding | deleterious(0.02) | benign(0.405) | TCGA-AA-3811-01 | Colorectum | colon adenocarcinoma | Female | >=65 | III/IV | Unknown | Unknown | PD | |
| NDUFAF1 | SNV | Missense_Mutation | rs770333609 | c.632G>A | p.Arg211His | p.R211H | Q9Y375 | protein_coding | deleterious(0) | probably_damaging(1) | TCGA-DM-A28H-01 | Colorectum | colon adenocarcinoma | Male | <65 | III/IV | Unknown | Unknown | PD |
| NDUFAF1 | SNV | Missense_Mutation | rs576430165 | c.536N>A | p.Arg179Gln | p.R179Q | Q9Y375 | protein_coding | tolerated(0.42) | benign(0.003) | TCGA-F5-6814-01 | Colorectum | rectum adenocarcinoma | Male | <65 | I/II | Unknown | Unknown | SD |
| NDUFAF1 | insertion | Frame_Shift_Ins | novel | c.779_780insT | p.Phe261LeufsTer3 | p.F261Lfs*3 | Q9Y375 | protein_coding | TCGA-A6-6781-01 | Colorectum | colon adenocarcinoma | Male | <65 | III/IV | Chemotherapy | oxaliplatin | SD | ||
| NDUFAF1 | SNV | Missense_Mutation | rs766081384 | c.293A>C | p.Lys98Thr | p.K98T | Q9Y375 | protein_coding | deleterious(0.01) | possibly_damaging(0.451) | TCGA-A5-A0G9-01 | Endometrium | uterine corpus endometrioid carcinoma | Female | >=65 | I/II | Unknown | Unknown | SD |
| Page: 1 2 3 4 |
Top |
Related drugs of malignant transformation related genes |
| Identification of chemicals and drugs interact with genes involved in malignant transfromation |
| (DGIdb 4.0) |
| Entrez ID | Symbol | Category | Interaction Types | Drug Claim Name | Drug Name | PMIDs |
| 51103 | NDUFAF1 | NA | inhibitor | CHEMBL3545135 | NV-128 | |
| 51103 | NDUFAF1 | NA | inhibitor | CHEMBL1703 | METFORMIN HYDROCHLORIDE | |
| 51103 | NDUFAF1 | NA | inhibitor | CHEMBL3545320 | ME-344 |
| Page: 1 |

Copyright 2023-Present -The University of Texas Health Science Center at Houston |