
|
|||||
|
 | |
| |
| |
| |
| |
| |
|
Gene: NDUFA7 |
Gene summary for NDUFA7 |
| Gene information | Species | Human | Gene symbol | NDUFA7 | Gene ID | 4701 |
| Gene name | NADH:ubiquinone oxidoreductase subunit A7 | |
| Gene Alias | B14.5a | |
| Cytomap | 19p13.2 | |
| Gene Type | protein-coding | GO ID | GO:0006091 | UniProtAcc | O95182 |
Top |
Malignant transformation analysis |
| Identification of the aberrant gene expression in precancerous and cancerous lesions by comparing the gene expression of stem-like cells in diseased tissues with normal stem cells |
| Entrez ID | Symbol | Replicates | Species | Organ | Tissue | Adj P-value | Log2FC | Malignancy |
| 4701 | NDUFA7 | LZE2T | Human | Esophagus | ESCC | 6.27e-09 | 7.87e-01 | 0.082 |
| 4701 | NDUFA7 | LZE3D | Human | Esophagus | HGIN | 1.08e-02 | 8.95e-01 | 0.0668 |
| 4701 | NDUFA7 | LZE4T | Human | Esophagus | ESCC | 7.41e-20 | 7.00e-01 | 0.0811 |
| 4701 | NDUFA7 | LZE5T | Human | Esophagus | ESCC | 7.80e-12 | 1.24e+00 | 0.0514 |
| 4701 | NDUFA7 | LZE7T | Human | Esophagus | ESCC | 2.75e-34 | 2.31e+00 | 0.0667 |
| 4701 | NDUFA7 | LZE8T | Human | Esophagus | ESCC | 1.01e-29 | 9.11e-01 | 0.067 |
| 4701 | NDUFA7 | LZE20T | Human | Esophagus | ESCC | 7.47e-31 | 8.99e-01 | 0.0662 |
| 4701 | NDUFA7 | LZE22D1 | Human | Esophagus | HGIN | 6.17e-18 | 6.72e-01 | 0.0595 |
| 4701 | NDUFA7 | LZE22T | Human | Esophagus | ESCC | 1.29e-08 | 8.06e-01 | 0.068 |
| 4701 | NDUFA7 | LZE24D1 | Human | Esophagus | HGIN | 1.15e-02 | 8.95e-01 | 0.054 |
| 4701 | NDUFA7 | LZE24T | Human | Esophagus | ESCC | 1.65e-46 | 1.22e+00 | 0.0596 |
| 4701 | NDUFA7 | LZE21T | Human | Esophagus | ESCC | 3.30e-21 | 1.31e+00 | 0.0655 |
| 4701 | NDUFA7 | LZE6T | Human | Esophagus | ESCC | 4.09e-21 | 9.23e-01 | 0.0845 |
| 4701 | NDUFA7 | P1T-E | Human | Esophagus | ESCC | 1.77e-18 | 6.53e-01 | 0.0875 |
| 4701 | NDUFA7 | P2T-E | Human | Esophagus | ESCC | 2.04e-18 | 3.28e-01 | 0.1177 |
| 4701 | NDUFA7 | P4T-E | Human | Esophagus | ESCC | 8.63e-26 | 5.19e-01 | 0.1323 |
| 4701 | NDUFA7 | P5T-E | Human | Esophagus | ESCC | 2.72e-36 | 7.03e-01 | 0.1327 |
| 4701 | NDUFA7 | P8T-E | Human | Esophagus | ESCC | 1.39e-25 | 4.74e-01 | 0.0889 |
| 4701 | NDUFA7 | P9T-E | Human | Esophagus | ESCC | 1.46e-34 | 6.76e-01 | 0.1131 |
| 4701 | NDUFA7 | P10T-E | Human | Esophagus | ESCC | 5.43e-43 | 6.29e-01 | 0.116 |
| Page: 1 2 3 4 5 6 7 8 |
| Tissue | Expression Dynamics | Abbreviation |
| Esophagus | 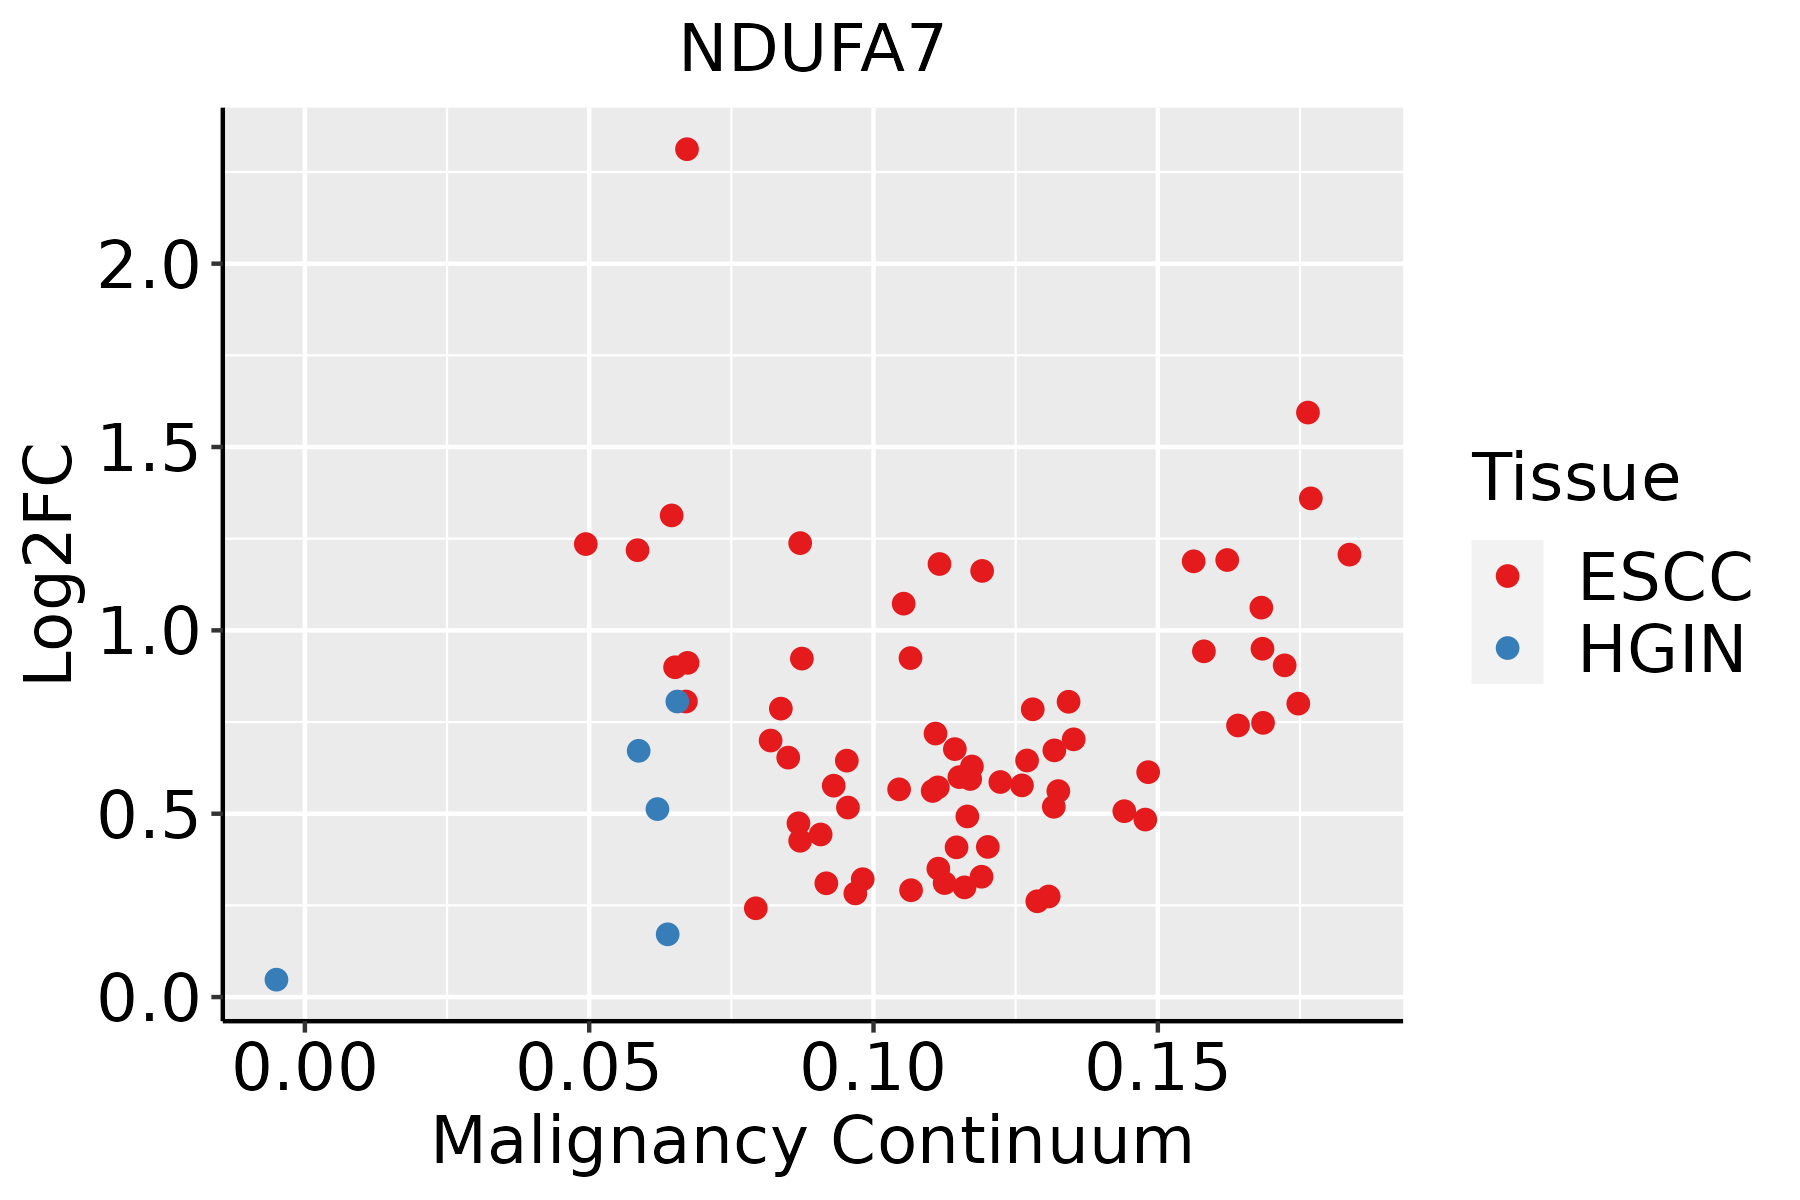 | ESCC: Esophageal squamous cell carcinoma |
| HGIN: High-grade intraepithelial neoplasias | ||
| LGIN: Low-grade intraepithelial neoplasias | ||
| GC | 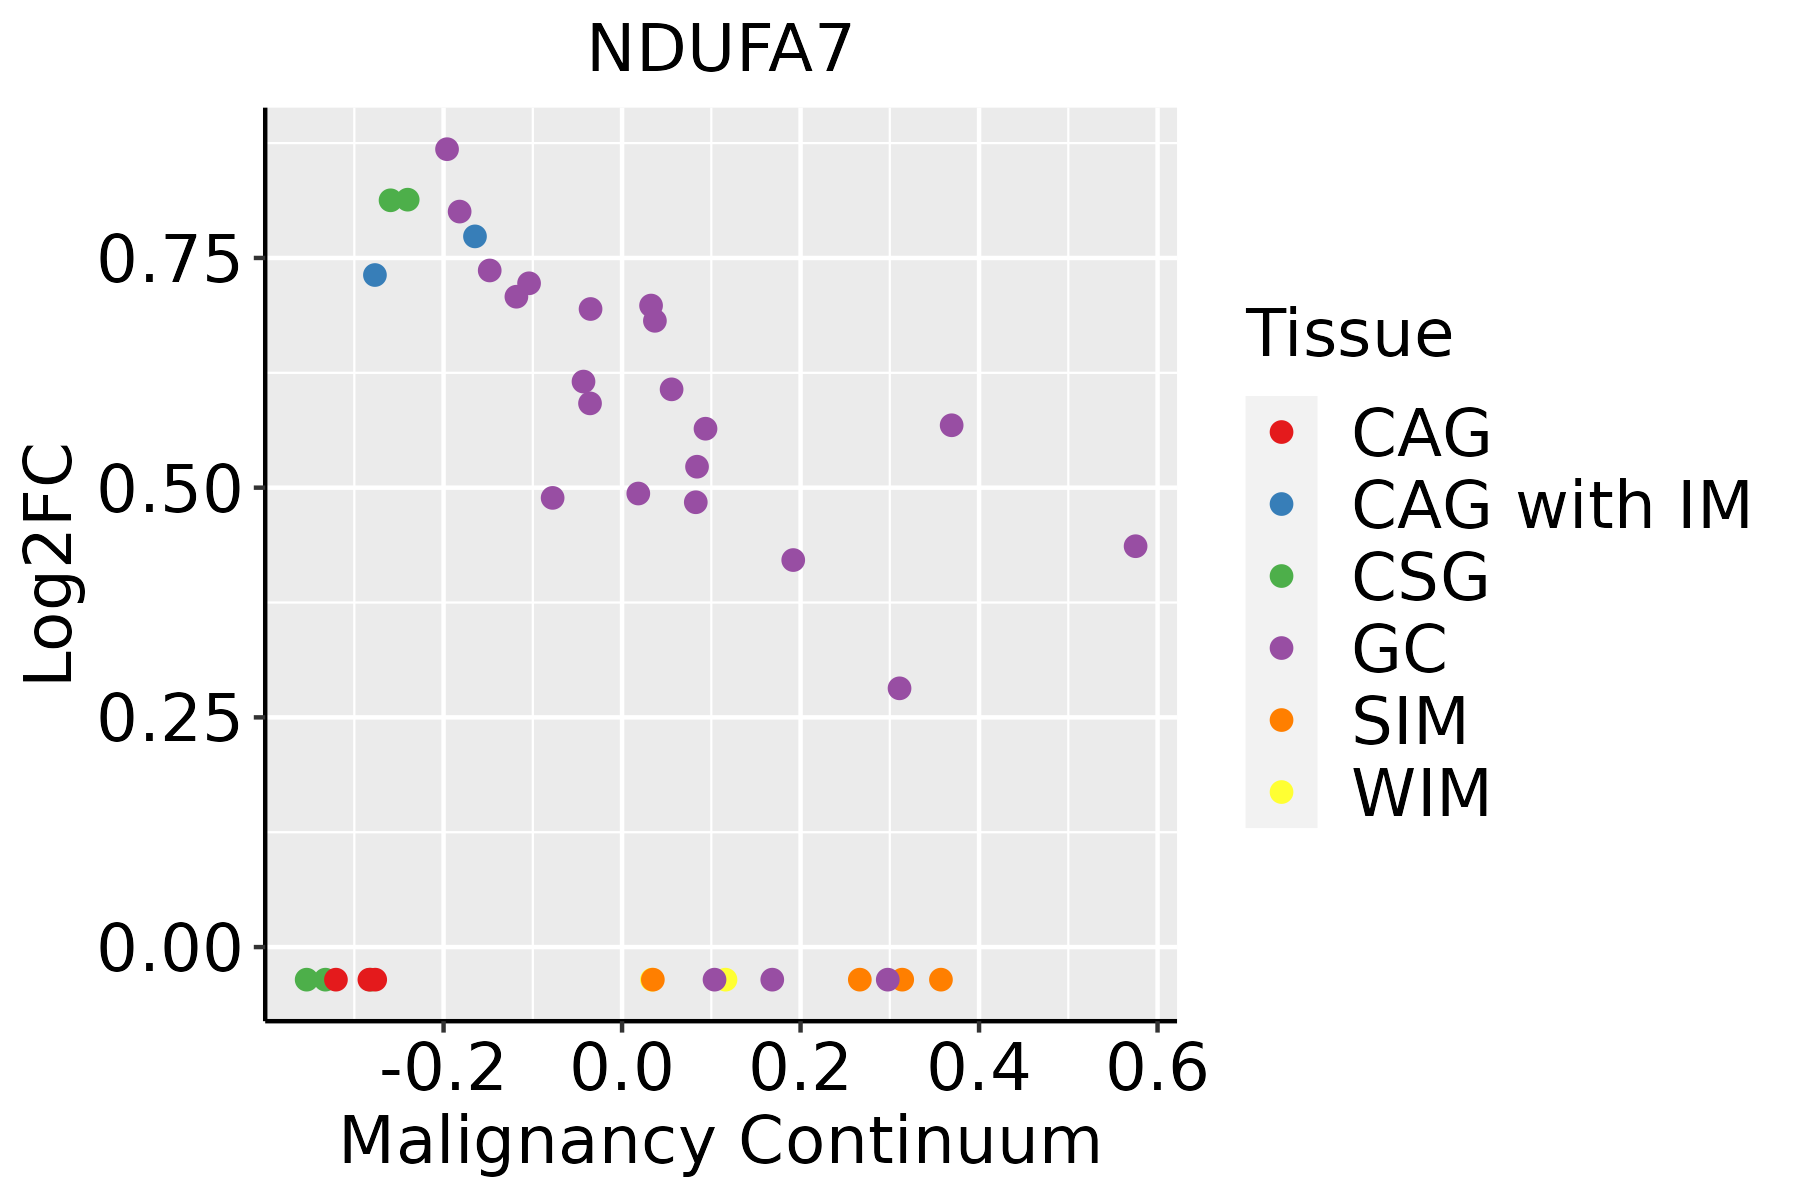 | CAG: Chronic atrophic gastritis |
| CAG with IM: Chronic atrophic gastritis with intestinal metaplasia | ||
| CSG: Chronic superficial gastritis | ||
| GC: Gastric cancer | ||
| SIM: Severe intestinal metaplasia | ||
| WIM: Wild intestinal metaplasia | ||
| Liver | 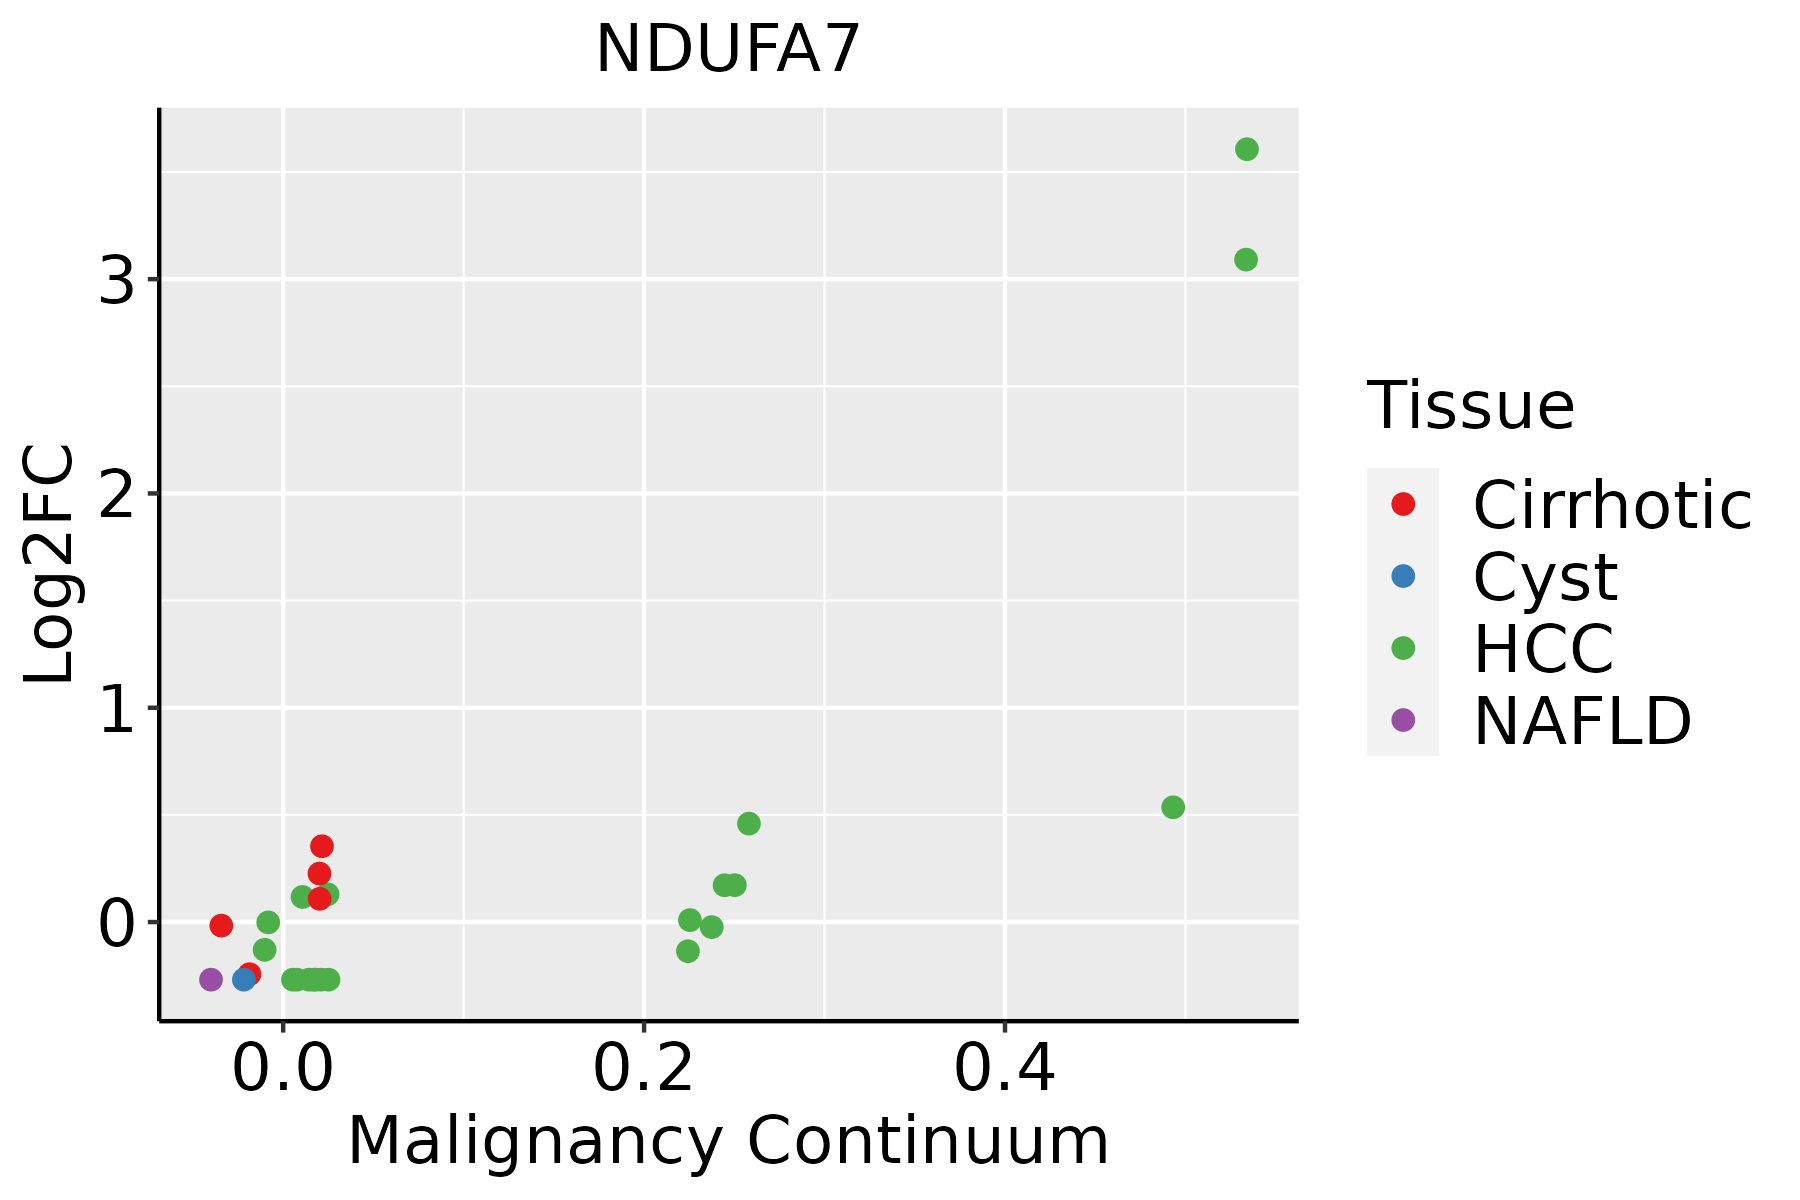 | HCC: Hepatocellular carcinoma |
| NAFLD: Non-alcoholic fatty liver disease | ||
| Oral Cavity | 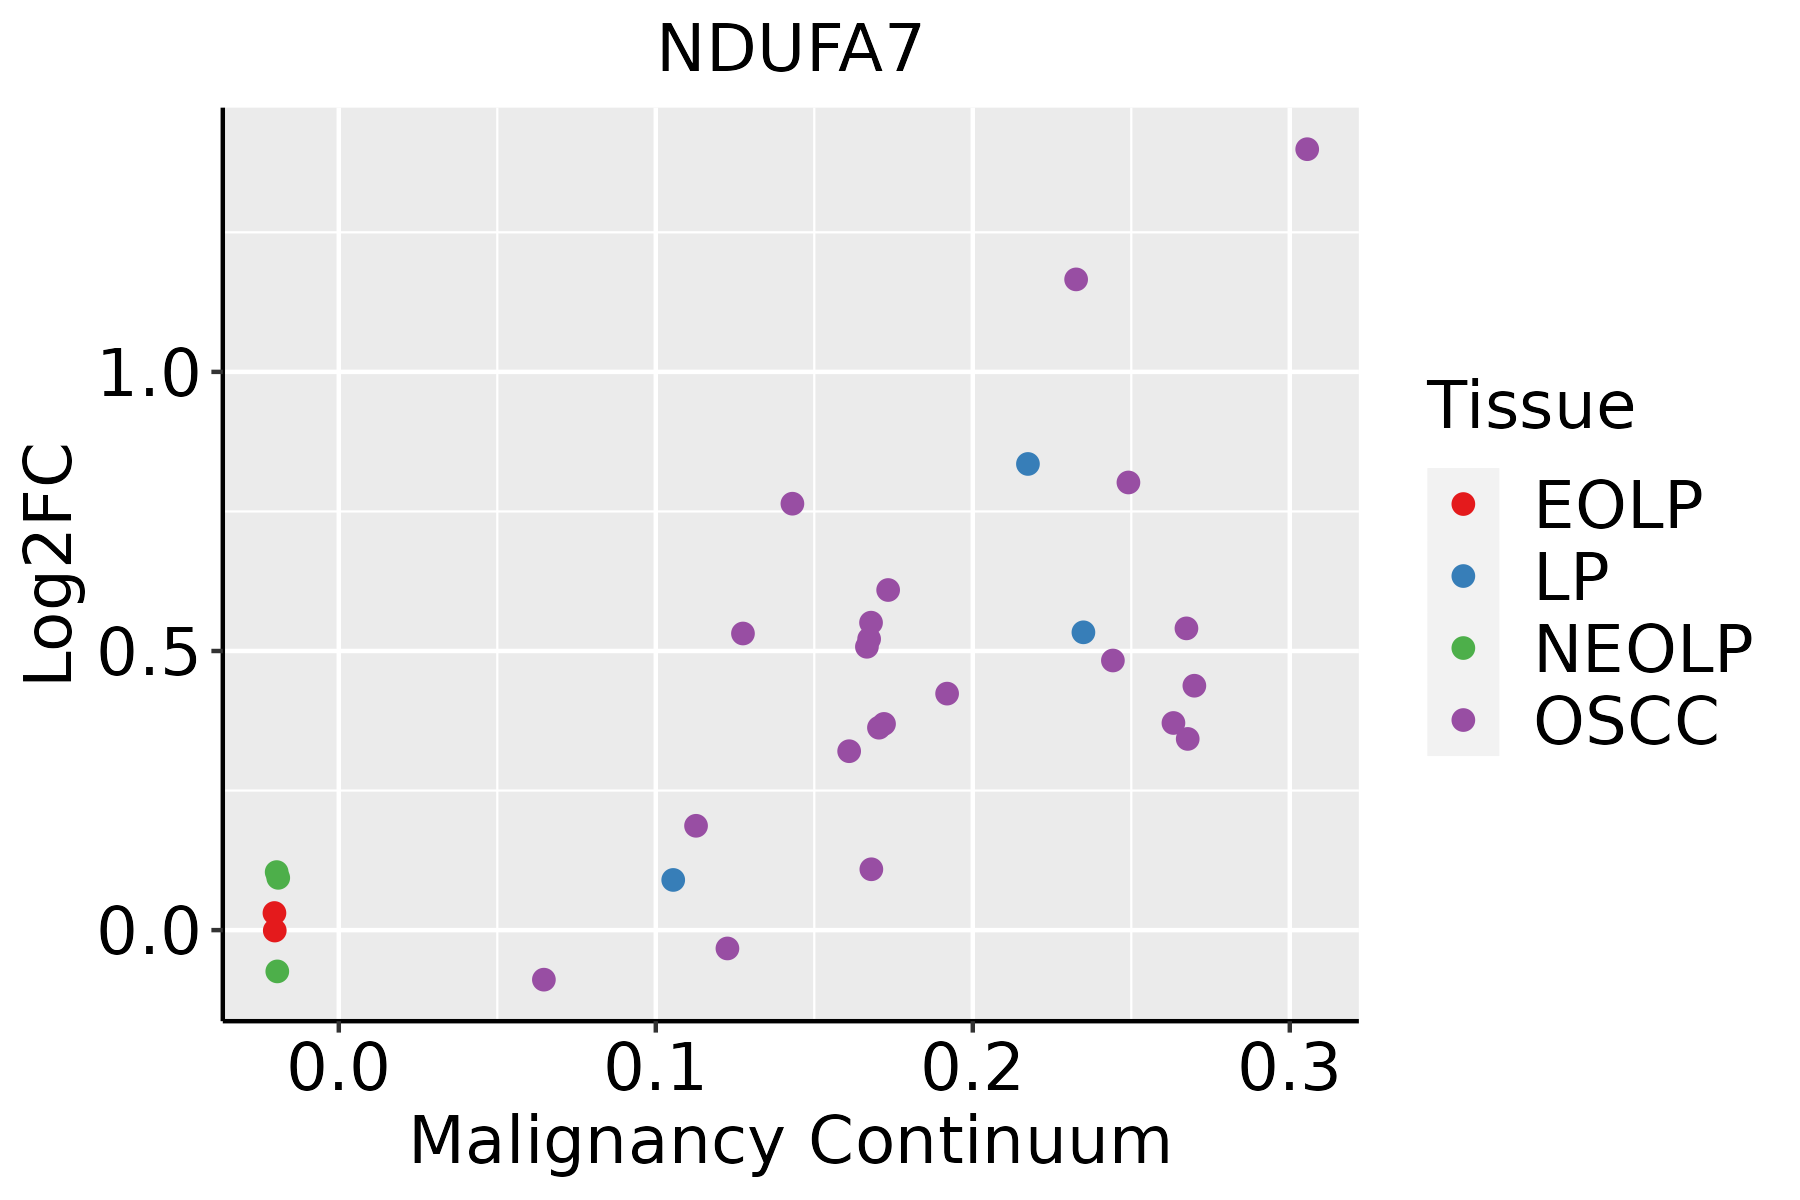 | EOLP: Erosive Oral lichen planus |
| LP: leukoplakia | ||
| NEOLP: Non-erosive oral lichen planus | ||
| OSCC: Oral squamous cell carcinoma | ||
| Prostate | 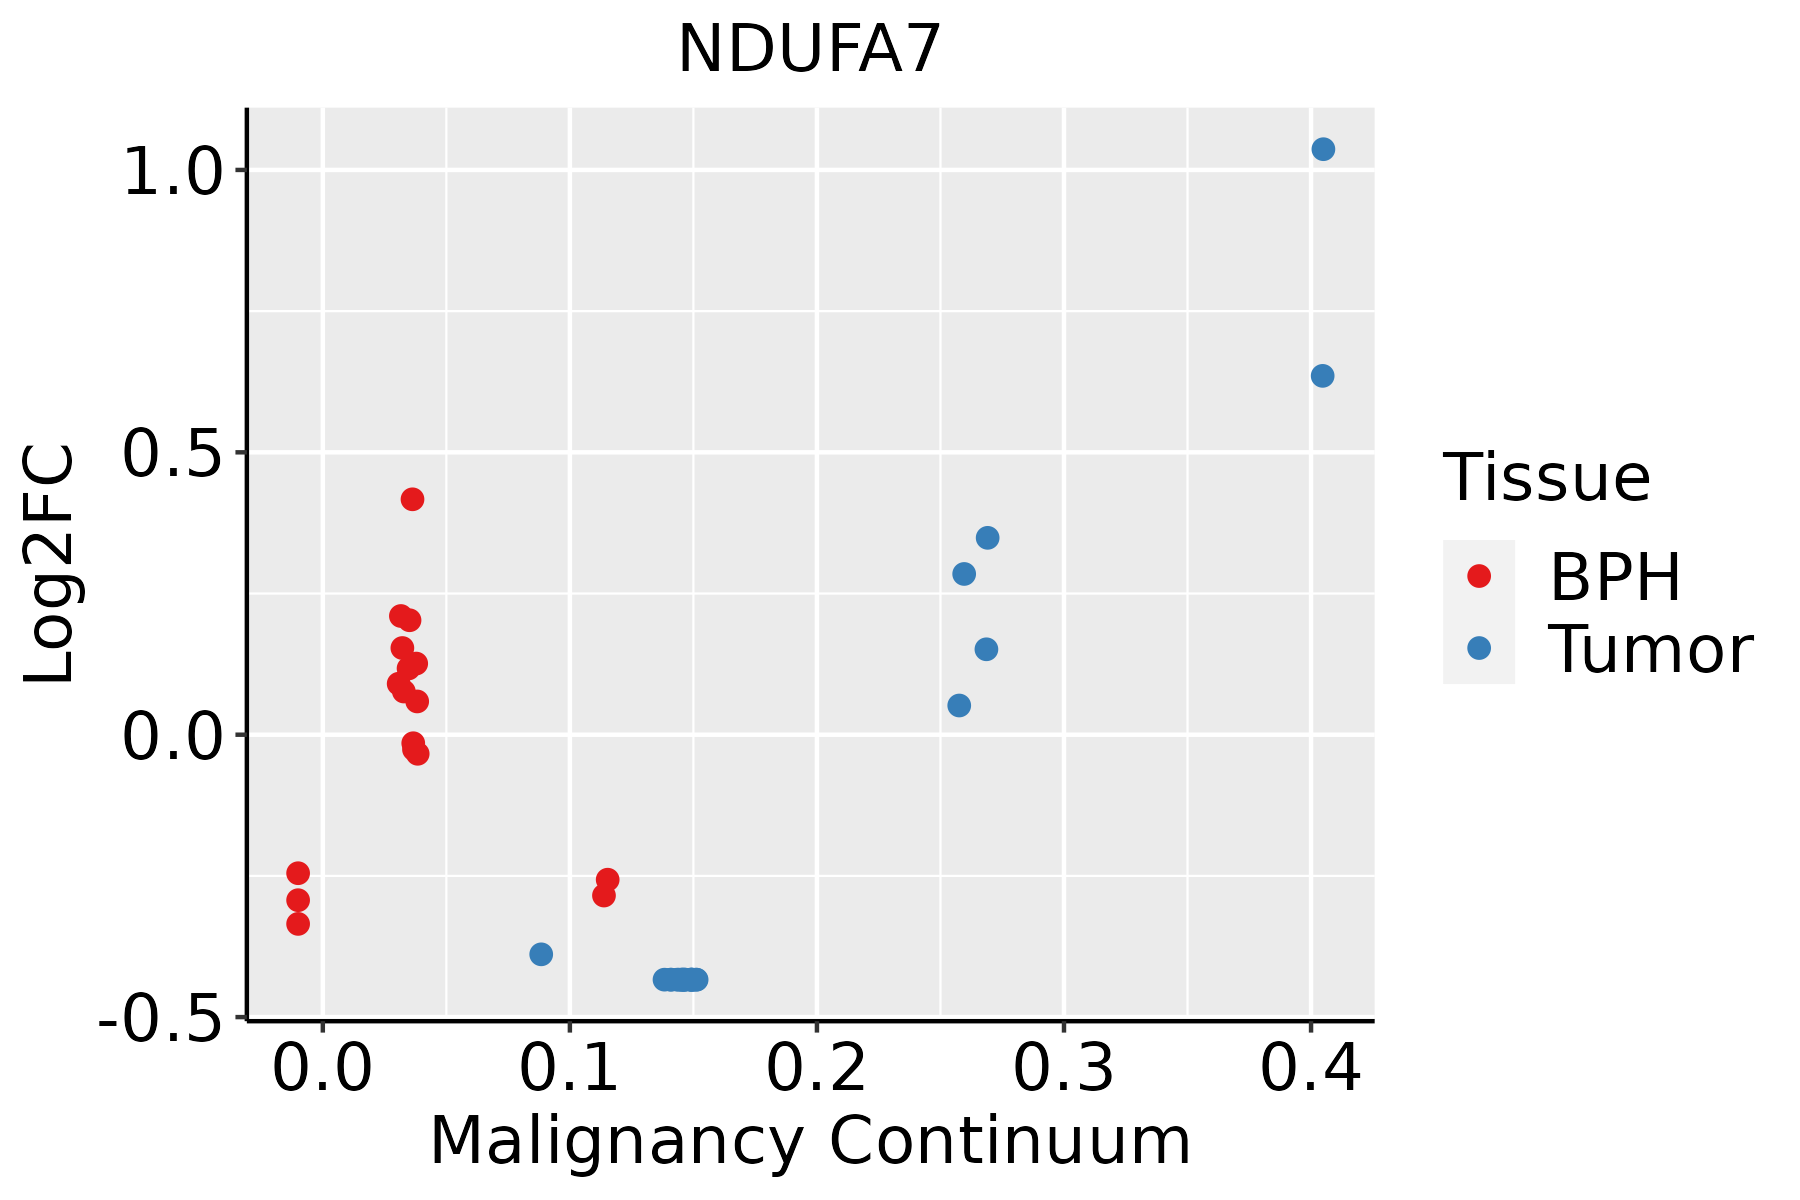 | BPH: Benign Prostatic Hyperplasia |
| Skin | 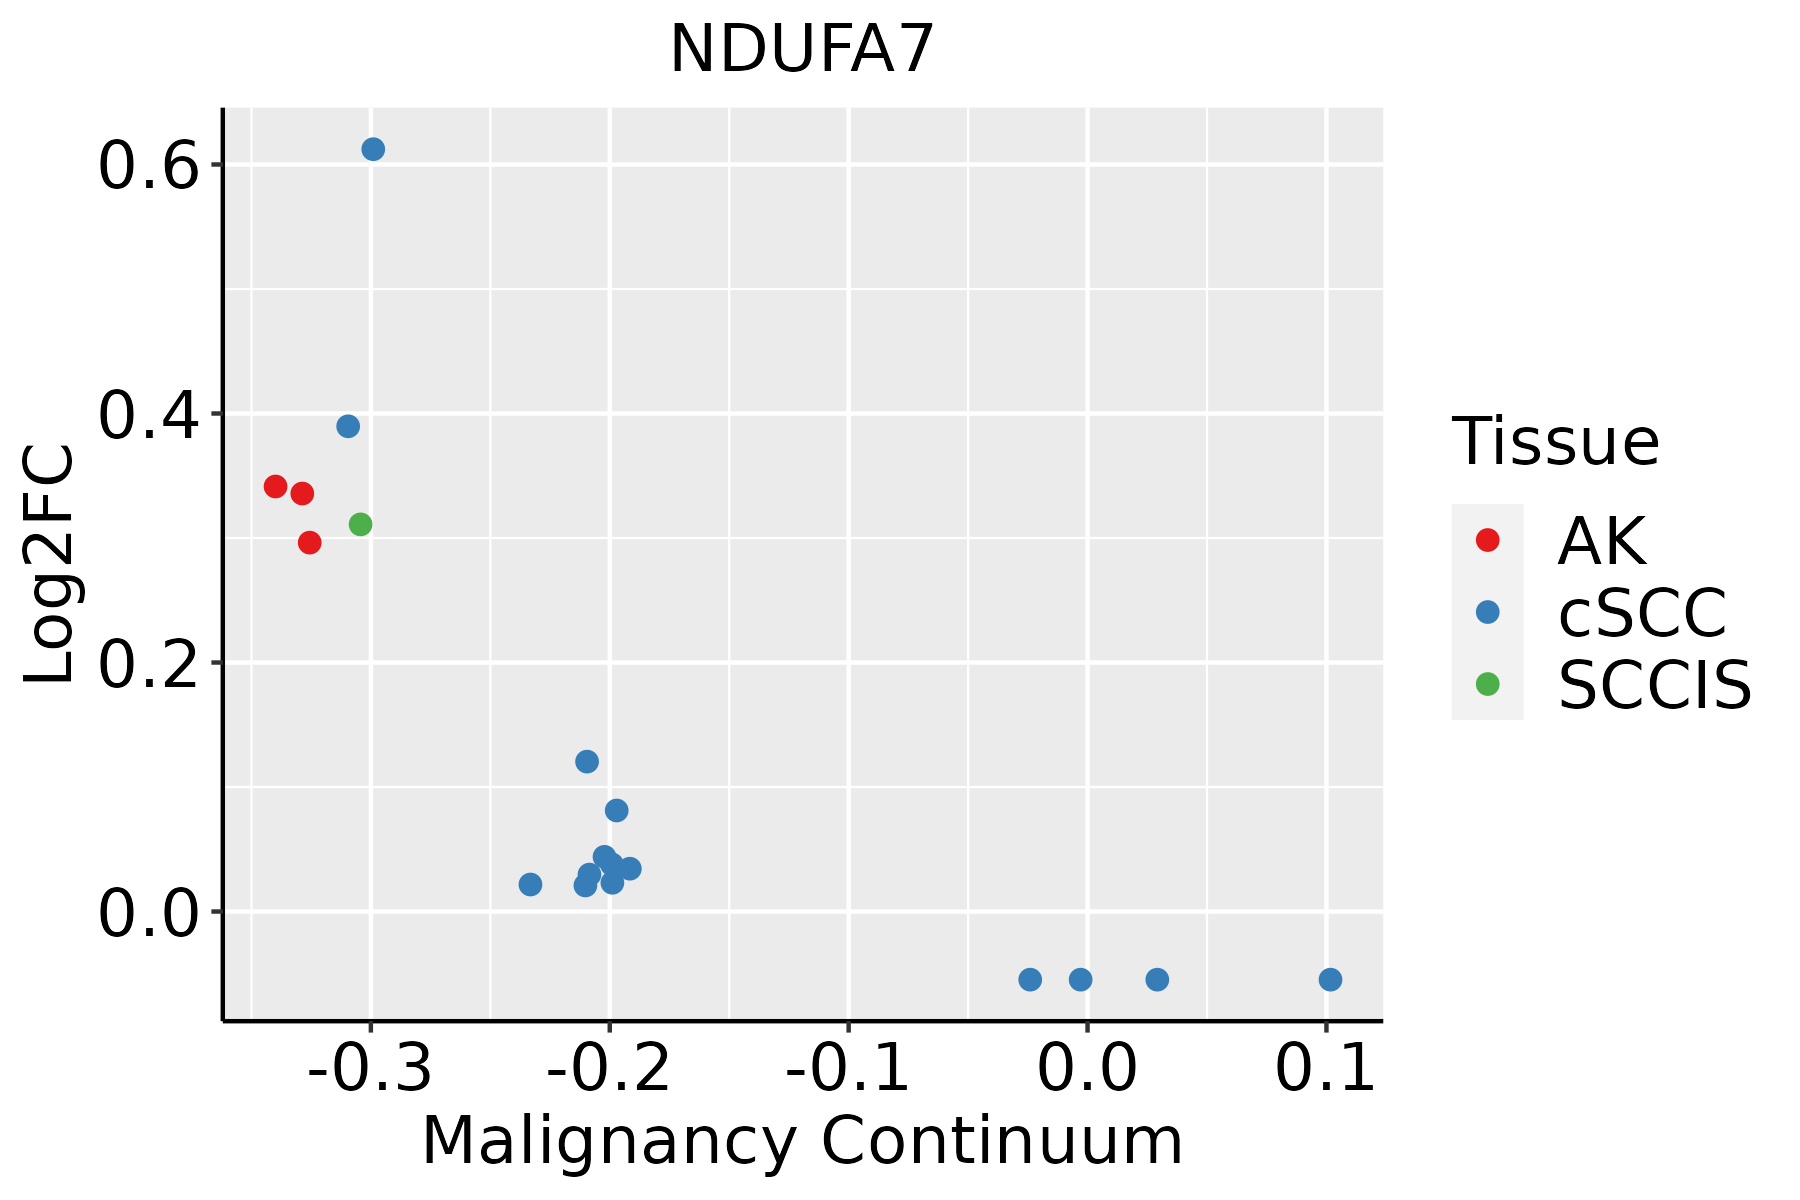 | AK: Actinic keratosis |
| cSCC: Cutaneous squamous cell carcinoma | ||
| SCCIS:squamous cell carcinoma in situ | ||
| Thyroid | 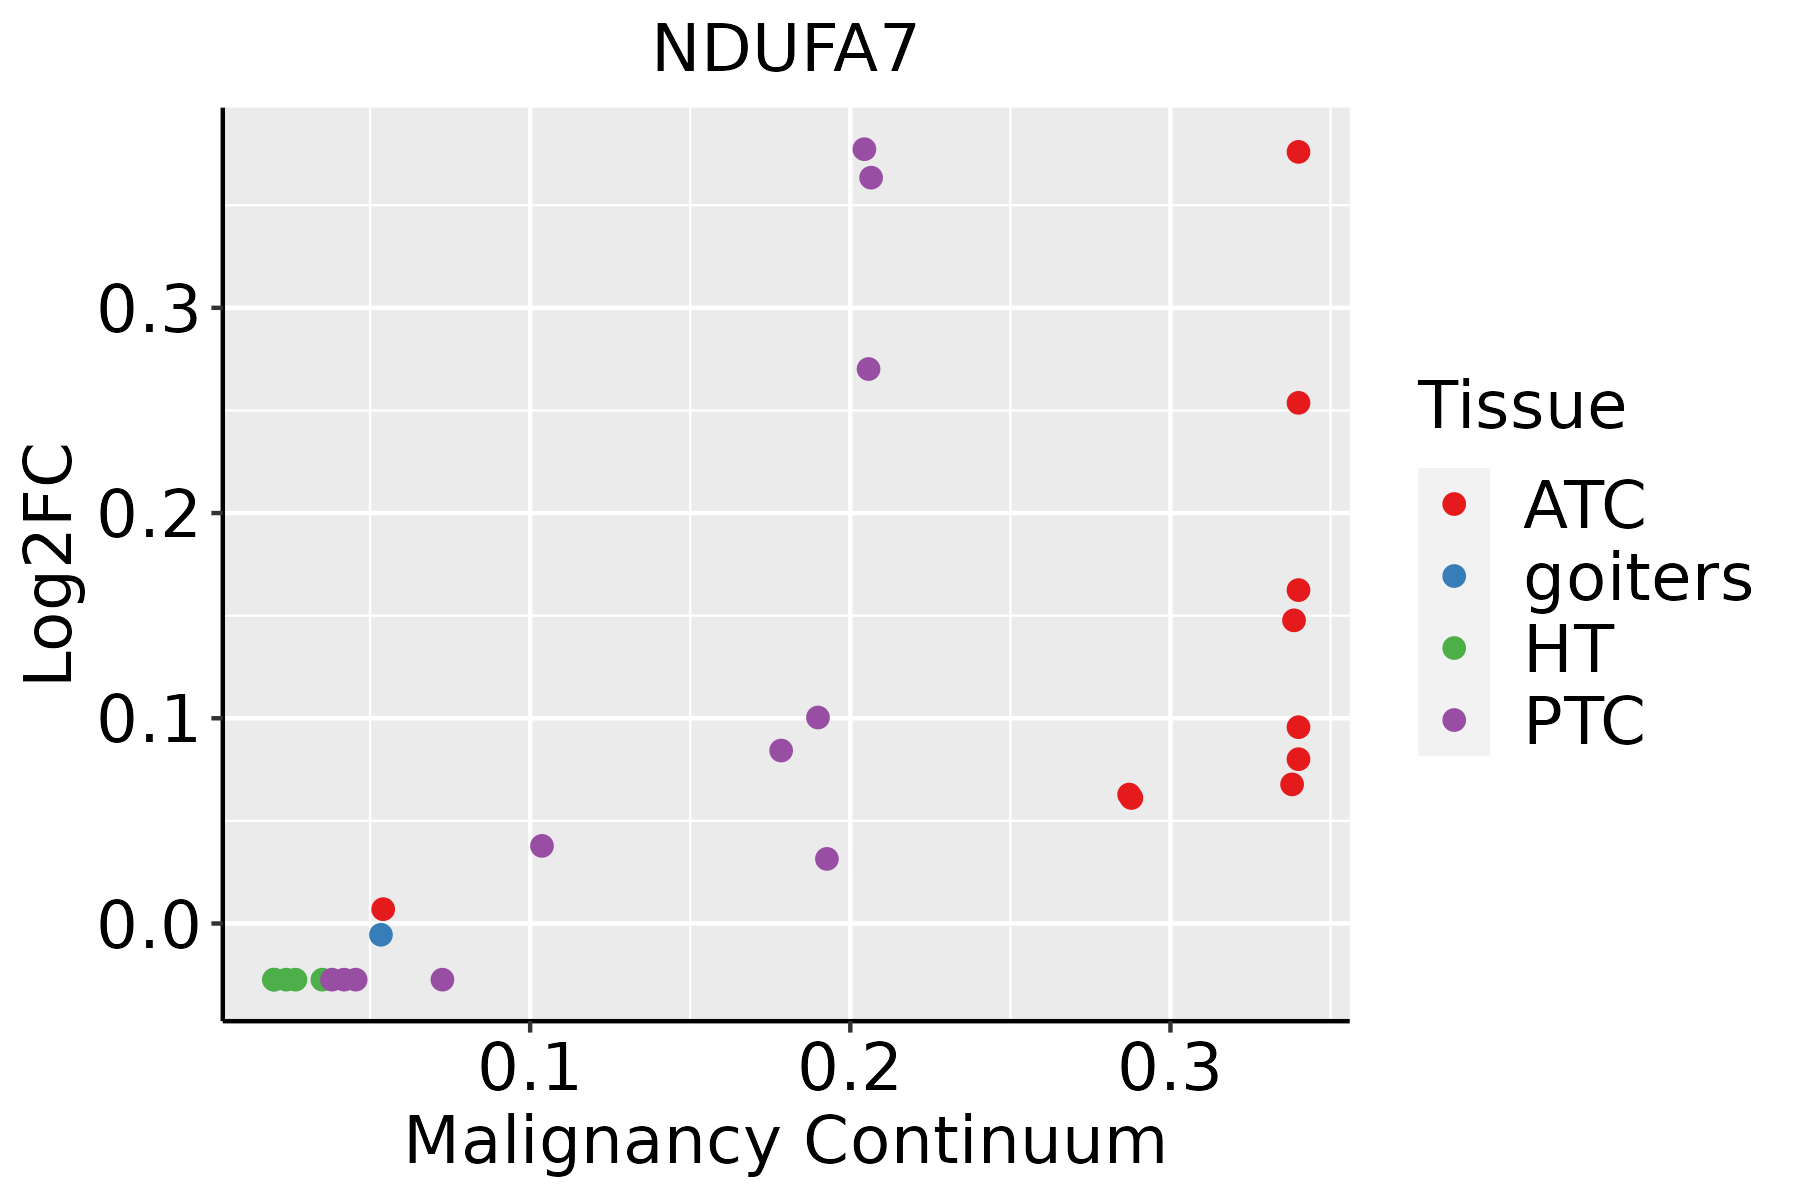 | ATC: Anaplastic thyroid cancer |
| HT: Hashimoto's thyroiditis | ||
| PTC: Papillary thyroid cancer |
| ∗log2FC in expression of this searched gene in stem-like cells from each diseased tissue sample relative to stem-like cells in normal samples in each tissue plotted against the malignancy continuum. Samples are colored based on if they are from different disease stage. |
Top |
Malignant transformation related pathway analysis |
| Find out the enriched GO biological processes and KEGG pathways involved in transition from healthy to precancer to cancer |
| Tissue | Disease Stage | Enriched GO biological Processes |
| Colorectum | AD |  |
| Colorectum | SER |  |
| Colorectum | MSS |  |
| Colorectum | MSI-H |  |
| Colorectum | FAP |  |
| ∗Top 15 enriched GO BP terms are showed in the bar plot of each disease state in each tissue. Each row represents a significant GO biological process which is colored according to the -log10(p.adjust). |
| Page: 1 2 3 4 5 6 7 8 9 |
| GO ID | Tissue | Disease Stage | Description | Gene Ratio | Bg Ratio | pvalue | p.adjust | Count |
| GO:000611920 | Esophagus | HGIN | oxidative phosphorylation | 69/2587 | 141/18723 | 1.37e-23 | 2.05e-20 | 69 |
| GO:000906020 | Esophagus | HGIN | aerobic respiration | 81/2587 | 189/18723 | 1.07e-22 | 9.26e-20 | 81 |
| GO:004603427 | Esophagus | HGIN | ATP metabolic process | 101/2587 | 277/18723 | 1.53e-21 | 1.02e-18 | 101 |
| GO:000609120 | Esophagus | HGIN | generation of precursor metabolites and energy | 145/2587 | 490/18723 | 3.41e-20 | 2.04e-17 | 145 |
| GO:004533320 | Esophagus | HGIN | cellular respiration | 86/2587 | 230/18723 | 2.41e-19 | 1.20e-16 | 86 |
| GO:001598020 | Esophagus | HGIN | energy derivation by oxidation of organic compounds | 105/2587 | 318/18723 | 1.16e-18 | 4.99e-16 | 105 |
| GO:004277320 | Esophagus | HGIN | ATP synthesis coupled electron transport | 49/2587 | 95/18723 | 2.21e-18 | 7.36e-16 | 49 |
| GO:004277520 | Esophagus | HGIN | mitochondrial ATP synthesis coupled electron transport | 49/2587 | 95/18723 | 2.21e-18 | 7.36e-16 | 49 |
| GO:002290420 | Esophagus | HGIN | respiratory electron transport chain | 51/2587 | 114/18723 | 9.63e-16 | 2.41e-13 | 51 |
| GO:001964620 | Esophagus | HGIN | aerobic electron transport chain | 43/2587 | 87/18723 | 1.98e-15 | 4.41e-13 | 43 |
| GO:002290020 | Esophagus | HGIN | electron transport chain | 66/2587 | 175/18723 | 2.21e-15 | 4.73e-13 | 66 |
| GO:000612020 | Esophagus | HGIN | mitochondrial electron transport, NADH to ubiquinone | 28/2587 | 51/18723 | 5.72e-12 | 7.30e-10 | 28 |
| GO:00325435 | Esophagus | HGIN | mitochondrial translation | 23/2587 | 76/18723 | 1.61e-04 | 3.16e-03 | 23 |
| GO:01400534 | Esophagus | HGIN | mitochondrial gene expression | 27/2587 | 108/18723 | 1.34e-03 | 1.57e-02 | 27 |
| GO:0006091110 | Esophagus | ESCC | generation of precursor metabolites and energy | 331/8552 | 490/18723 | 3.86e-23 | 8.45e-21 | 331 |
| GO:0045333110 | Esophagus | ESCC | cellular respiration | 173/8552 | 230/18723 | 4.53e-20 | 5.99e-18 | 173 |
| GO:014005313 | Esophagus | ESCC | mitochondrial gene expression | 93/8552 | 108/18723 | 1.96e-18 | 2.03e-16 | 93 |
| GO:0009060110 | Esophagus | ESCC | aerobic respiration | 145/8552 | 189/18723 | 2.16e-18 | 2.21e-16 | 145 |
| GO:0015980110 | Esophagus | ESCC | energy derivation by oxidation of organic compounds | 220/8552 | 318/18723 | 1.20e-17 | 1.09e-15 | 220 |
| GO:0022900110 | Esophagus | ESCC | electron transport chain | 133/8552 | 175/18723 | 2.18e-16 | 1.67e-14 | 133 |
| Page: 1 2 3 4 5 6 7 8 9 10 11 |
| Pathway ID | Tissue | Disease Stage | Description | Gene Ratio | Bg Ratio | pvalue | p.adjust | qvalue | Count |
| hsa0501239 | Esophagus | HGIN | Parkinson disease | 124/1383 | 266/8465 | 5.95e-32 | 9.70e-30 | 7.70e-30 | 124 |
| hsa0501630 | Esophagus | HGIN | Huntington disease | 129/1383 | 306/8465 | 6.81e-28 | 7.41e-26 | 5.88e-26 | 129 |
| hsa0502030 | Esophagus | HGIN | Prion disease | 117/1383 | 273/8465 | 4.15e-26 | 3.38e-24 | 2.69e-24 | 117 |
| hsa0501430 | Esophagus | HGIN | Amyotrophic lateral sclerosis | 140/1383 | 364/8465 | 2.13e-25 | 1.16e-23 | 9.19e-24 | 140 |
| hsa0019030 | Esophagus | HGIN | Oxidative phosphorylation | 68/1383 | 134/8465 | 1.73e-20 | 8.07e-19 | 6.41e-19 | 68 |
| hsa0520839 | Esophagus | HGIN | Chemical carcinogenesis - reactive oxygen species | 92/1383 | 223/8465 | 2.41e-19 | 9.83e-18 | 7.80e-18 | 92 |
| hsa0502230 | Esophagus | HGIN | Pathways of neurodegeneration - multiple diseases | 153/1383 | 476/8465 | 1.22e-18 | 4.41e-17 | 3.50e-17 | 153 |
| hsa0501030 | Esophagus | HGIN | Alzheimer disease | 130/1383 | 384/8465 | 5.26e-18 | 1.71e-16 | 1.36e-16 | 130 |
| hsa0471439 | Esophagus | HGIN | Thermogenesis | 91/1383 | 232/8465 | 1.97e-17 | 5.36e-16 | 4.25e-16 | 91 |
| hsa0541530 | Esophagus | HGIN | Diabetic cardiomyopathy | 80/1383 | 203/8465 | 1.35e-15 | 3.38e-14 | 2.69e-14 | 80 |
| hsa0493230 | Esophagus | HGIN | Non-alcoholic fatty liver disease | 66/1383 | 155/8465 | 5.21e-15 | 1.21e-13 | 9.64e-14 | 66 |
| hsa0472327 | Esophagus | HGIN | Retrograde endocannabinoid signaling | 36/1383 | 148/8465 | 7.52e-03 | 4.63e-02 | 3.68e-02 | 36 |
| hsa05012114 | Esophagus | HGIN | Parkinson disease | 124/1383 | 266/8465 | 5.95e-32 | 9.70e-30 | 7.70e-30 | 124 |
| hsa05016113 | Esophagus | HGIN | Huntington disease | 129/1383 | 306/8465 | 6.81e-28 | 7.41e-26 | 5.88e-26 | 129 |
| hsa05020113 | Esophagus | HGIN | Prion disease | 117/1383 | 273/8465 | 4.15e-26 | 3.38e-24 | 2.69e-24 | 117 |
| hsa05014113 | Esophagus | HGIN | Amyotrophic lateral sclerosis | 140/1383 | 364/8465 | 2.13e-25 | 1.16e-23 | 9.19e-24 | 140 |
| hsa00190113 | Esophagus | HGIN | Oxidative phosphorylation | 68/1383 | 134/8465 | 1.73e-20 | 8.07e-19 | 6.41e-19 | 68 |
| hsa05208115 | Esophagus | HGIN | Chemical carcinogenesis - reactive oxygen species | 92/1383 | 223/8465 | 2.41e-19 | 9.83e-18 | 7.80e-18 | 92 |
| hsa05022113 | Esophagus | HGIN | Pathways of neurodegeneration - multiple diseases | 153/1383 | 476/8465 | 1.22e-18 | 4.41e-17 | 3.50e-17 | 153 |
| hsa05010113 | Esophagus | HGIN | Alzheimer disease | 130/1383 | 384/8465 | 5.26e-18 | 1.71e-16 | 1.36e-16 | 130 |
| Page: 1 2 3 4 5 6 7 8 9 10 11 12 13 14 |
Top |
Cell-cell communication analysis |
| Identification of potential cell-cell interactions between two cell types and their ligand-receptor pairs for different disease states |
| Ligand | Receptor | LRpair | Pathway | Tissue | Disease Stage |
| Page: 1 |
Top |
Single-cell gene regulatory network inference analysis |
| Find out the significant the regulons (TFs) and the target genes of each regulon across cell types for different disease states |
| TF | Cell Type | Tissue | Disease Stage | Target Gene | RSS | Regulon Activity |
| ∗The dot plots of a searched regulon are shown for all cell subpopulations in each disease state of each tissue based on the regulon specific score inferred using pySCENIC and by calculating the average expression. |
| Page: 1 |
Top |
Somatic mutation of malignant transformation related genes |
| Annotation of somatic variants for genes involved in malignant transformation |
| Hugo Symbol | Variant Class | Variant Classification | dbSNP RS | HGVSc | HGVSp | HGVSp Short | SWISSPROT | BIOTYPE | SIFT | PolyPhen | Tumor Sample Barcode | Tissue | Histology | Sex | Age | Stage | Therapy Types | Drugs | Outcome |
| NDUFA7 | SNV | Missense_Mutation | novel | c.227N>C | p.Leu76Pro | p.L76P | O95182 | protein_coding | deleterious(0) | probably_damaging(0.997) | TCGA-A2-A3Y0-01 | Breast | breast invasive carcinoma | Female | <65 | I/II | Chemotherapy | adriamycin | CR |
| NDUFA7 | insertion | Frame_Shift_Ins | novel | c.147_148insGTGACCCACCGTGCCTGGCCTG | p.Ser50ValfsTer49 | p.S50Vfs*49 | O95182 | protein_coding | TCGA-AP-A0LH-01 | Endometrium | uterine corpus endometrioid carcinoma | Female | <65 | I/II | Chemotherapy | paclitaxel | PD | ||
| NDUFA7 | SNV | Missense_Mutation | novel | c.14C>T | p.Thr5Ile | p.T5I | O95182 | protein_coding | deleterious(0) | probably_damaging(0.996) | TCGA-G3-AAV3-01 | Liver | liver hepatocellular carcinoma | Female | <65 | I/II | Unknown | Unknown | SD |
| NDUFA7 | SNV | Missense_Mutation | c.125N>G | p.Pro42Arg | p.P42R | O95182 | protein_coding | deleterious(0) | probably_damaging(0.99) | TCGA-99-8025-01 | Lung | lung adenocarcinoma | Female | >=65 | III/IV | Chemotherapy | gemzar | SD | |
| NDUFA7 | SNV | Missense_Mutation | novel | c.249N>C | p.Glu83Asp | p.E83D | O95182 | protein_coding | tolerated(0.27) | benign(0.005) | TCGA-CV-5970-01 | Oral cavity | head & neck squamous cell carcinoma | Male | <65 | I/II | Unknown | Unknown | PD |
| NDUFA7 | SNV | Missense_Mutation | novel | c.206T>C | p.Ile69Thr | p.I69T | O95182 | protein_coding | deleterious(0) | benign(0.129) | TCGA-XK-AAIW-01 | Prostate | prostate adenocarcinoma | Male | >=65 | 9 | Unknown | Unknown | PD |
| NDUFA7 | SNV | Missense_Mutation | novel | c.238N>C | p.Lys80Gln | p.K80Q | O95182 | protein_coding | tolerated(0.27) | benign(0.037) | TCGA-EL-A3ZO-01 | Thyroid | thyroid carcinoma | Female | >=65 | III/IV | Unknown | Unknown | SD |
| Page: 1 |
Top |
Related drugs of malignant transformation related genes |
| Identification of chemicals and drugs interact with genes involved in malignant transfromation |
| (DGIdb 4.0) |
| Entrez ID | Symbol | Category | Interaction Types | Drug Claim Name | Drug Name | PMIDs |
| 4701 | NDUFA7 | ENZYME | inhibitor | CHEMBL3545320 | ME-344 | |
| 4701 | NDUFA7 | ENZYME | inhibitor | CHEMBL1703 | METFORMIN HYDROCHLORIDE | |
| 4701 | NDUFA7 | ENZYME | inhibitor | CHEMBL3545135 | NV-128 |
| Page: 1 |

Copyright 2023-Present -The University of Texas Health Science Center at Houston |